Universidade do Minho Escola de Engenharia Departamento de Inform´atica
Sara Manso de Sousa Cardoso
Development of web-based tools for
metabolomics data analysis and mining
3
Universidade do Minho Escola de Engenharia Departamento de Inform´atica
Sara Manso de Sousa Cardoso
Development of web-based tools for
metabolomics data analysis and mining
Master dissertation
Master Degree in Bioinformatics
Dissertation supervised by
Miguel Francisco de Almeida Pereira da Rocha
Marcelo Maraschin, Universidade Federal de Santa Catarina
A G R A D E C I M E N T O S
Quero aqui deixar o meu agradecimento a todas as pessoas que, directa ou indirectamente, contribuiram para a concretizac¸˜ao deste trabalho.
Em primeiro lugar, quero agradecer ao professor e orientador Miguel Rocha, por me ter dado a oportunidade de desenvolver este trabalho, pela partilha de conhecimentos e por todas as oportunidades proporcionadas que surgiram deste trabalho.
Quero tamb´em agradecer ao Marcelo Maraschin, da Universidade Federal de Santa Cata-rina, pela orientac¸˜ao, por concender dados de metabol ´omica para an´alise e pela colaborac¸˜ao na an´alise desses mesmos dados, mais especificamente, os dados de cascas de banana, que resultou no caso de estudo da presente dissertac¸˜ao e num artigo publicado.
Quero tamb´em agradecer a todos os meus amigos por me terem sempre apoiado ao longo dos anos, mas especialmente neste ´ultimo ano.
Por ´ultimo, e n˜ao de todo menos importante, quero agradecer a toda a minha fam´ılia por todo o apoio dado n˜ao s ´o ao longo deste ano, mas desde sempre. Mas especialmente ao meu pai, por me ter ensinado muito do que sou hoje e por muito mais; `a tia S˜ao, por me ter sempre apoiado, mas especialmente por ter estado sempre ao meu lado ao longo deste ano; e, mais especialmente, `a minha m˜ae, que sempre foi quem mais me apoiou em tudo e quem mais me incentivava a crescer profissionalmente e pessoalmente. A ela dedico este trabalho.
Mais uma vez, obrigado a todos.
A B S T R A C T
The recent advances in metabolomics experimental techniques have provided novel ap-proaches for many research issues in the biological fields. Indeed, the ability to identify and quantify numerous compounds in biological samples provides significant advances in functional genomics, biomarker identification, sample characterization or drug discovery and development. To take full advantage of these data advanced bioinformatics methods for data analysis and mining have been required.
A number of methods and tools for metabolomics data analysis have been put forward recently, being one of the major limitations still faced the lack of integrated frameworks for extracting relevant knowledge from these data and being able to integrate these data with previous biochemical knowledge. Also, the lack of reproducibility in many data analyses or data mining processes is a strong obstacle for biological discovery.
In recent work from the host group, specmine, a metabolomics and spectral data analy-sis/mining framework, in the form of a package for the R system, has been developed to address some of these issues.
In this thesis, an integrated web-based platform for metabolomics data analysis and min-ing, named WebSpecmine, was designed and developed, based on the specmine package, thus providing an easier and friendly user interface. This website provides means for analysing metabolomics data from different formats, including tasks such as pre-processing, univari-ate and multivariunivari-ate analysis and metabolite identification. This web-based platform was developed collaboratively and, therefore, this work focused mainly in data from nuclear magnetic ressonance and mass spectrometry.
Also, the package faced some limitations regarding types of analysis not yet provided, such as metabolite identification for other data formats besides Mass Spectrometry coupled to Liquid Chromatography. Therefore, the extension of the metabolite identification feature was addressed, by implementing such analysis for Nuclear Magnetic Ressonance data in the specmine package, as well as making it available in the website.
The website was validated by applying it to reproduce the pipelines from previous stud-ies that made use of the specmine package. Furthermore, a case study involving banana peels and the analysis of their characteristics and potential made use of the newly created website to further validate its functionality. All the analyses here executed were stored and are available in the web application, as public projects.
R E S U M O
Os mais recentes avanc¸os nas t´ecnicas experimentais metabol ´omicas tˆem levado a novas abordagens de muitas quest ˜oes na investigac¸˜ao em ´areas biol ´ogicas. De facto, a capaci-dade de identificar e quantificar os in ´umeros compostos presentes nas amostras biol ´ogicas veio provocar enormes avanc¸os na gen ´omica funcional, identificac¸˜ao de biomarcadores, caracterizac¸˜ao de amostras e descoberta e desenvolvimento de drogas. Para tirar maior par-tido destes dados, ´e necess´ario a existˆencia de m´etodos avanc¸ados de bioinform´atica para a an´alise e minerac¸˜ao de dados.
V´arios m´etodos e ferramentas que permitem a an´alise de dados metabol ´omicos tˆem vindo a ser apresentadas, tendo no entanto como grande limitac¸˜ao a falta de extracc¸˜ao de conhecimento relevante destes dados e integr´a-los com conhecimento bioqu´ımico an-terior. Para al´em disto, a falta de reprodutibilidade de muitas an´alises de dados ou de processamentos de minerac¸˜ao ´e um grande obst´aculo `a descoberta biol ´ogica.
Em trabalhos recentes do grupo de acolhimento foi desenvolvido um package para o sis-tema R por forma a abordar algumas destas quest ˜oes. Este package, denominado specmine, permite a an´alise e minerac¸˜ao de dados espectrais e de metabol ´omica.
Na presente tese, uma plataforma web integrada para a an´alise e minerac¸˜ao de dados de metabol ´omica, denominada WebSpecmine, foi desenvolvida, baseada no package specmine, fornecendo assim uma interface simples e f´acil para o usu´ario. Este site permite a an´alise de dados de metabol ´omica de formatos diferentes, incluindo pre-processamento, an´alises univariada e multivariada, e identificac¸˜ao de metabolitos. Esta plataforma web foi desen-volvida de forma colaborativa e, deste modo, o presente trabalho focou-se maioritariamente em dados provenientes das t´ecnicas espectrometria de massa e ressonˆancia magn´etica nu-clear.
Para al´em disto, o package apresentava algumas limitac¸ ˜oes no que toca a tipos de an´alise ainda n˜ao dispon´ıveis, como ´e o caso da identificac¸˜ao de metabolitos para outros formatos de dados que n˜ao a espectrometria de massa acoplada com cromatografia l´ıquida. Assim, a funcionalidade de identificac¸˜ao de metabolitos no specmine package foi estendida a dados de ressonˆancia magn´etica nuclear, bem como tamb´em implementada no website.
O site foi validado atrav´es da sua aplicac¸˜ao para reproduzir pipelines de estudos anteri-ores que fizeram uso do package specmine. Para al´em disto, um estudo de caso envolvendo cascas de banana e a an´alise das suas caracter´ısticas e potencial, fez uso do site recentemente criado para tamb´em validar a sua funcionalidade. Todas as an´alises aqui executadas foram guardadas na aplicac¸˜ao web, estando dispon´ıveis para consulta, como projectos p ´ublicos.
C O N T E N T S 1 i n t r o d u c t i o n 2 1.1 Context 2 1.2 Objectives 3 1.3 Dissertation Organization 4 2 s tat e o f t h e a r t 5 2.1 Methodologies 5 2.2 Sample Preparation 7 2.3 Techniques 7 2.3.1 Mass Spectrometry (MS) 8
2.3.2 Nuclear Magnetic Ressonance (NMR) 8
2.4 Data Pre-Processing and Pre-Treatment 10
2.5 Analysis of the processed data 12
2.5.1 Metabolite Identification 12
2.5.2 Machine Learning 14
2.5.3 Feature Selection 16
2.6 Metabolomics Databases 17
2.7 Web tools to analyse metabolomics data 19
3 d e v e l o p m e n t 22
3.1 specmine Package 22
3.2 Improvements to the specmine package 25
3.3 Website Development strategies and tools 28
3.4 Website architecture and Layout 30
3.5 Choose the data to work with 31
3.5.1 New Project 32
3.5.2 Choose Files 33
3.5.3 MS Spectra Options 34
3.5.4 NMR or MS peaks lists Options 34
3.5.5 Concentrations Options 35
3.5.6 Load and Save Workspaces 35
3.6 Pre-Processing 36 3.7 Data Visualization 38 3.8 Analysis 40 3.8.1 Run Analysis 40 3.8.2 Analysis Results 46 iv
Contents v
3.9 Home and Help Pages 51
4 u s e c a s e s 53
4.1 NMR Data: Propolis 53
4.1.1 Introduction 53
4.1.2 Choosing files for analysis and pre-processing 54
4.1.3 One-way ANOVA Analysis 56
4.1.4 Principal Components Analysis 57
4.1.5 Machine Learning 59
4.1.6 Metabolite Identification 60
4.1.7 Save Reports 63
4.1.8 Conclusions 64
4.2 LC-MS Data: Mice Spinal Cord 65
4.2.1 Introduction 65
4.2.2 Choosing files for analysis and pre-processing 65
4.2.3 Data Analysis 66
4.2.4 Conclusions 70
5 c a s e s t u d y: banana (musa spp) 71
5.1 Introduction 71
5.2 Data Collection and Processing 73
5.2.1 Chemicals 73
5.2.2 Samples 73
5.2.3 One-dimensional Nuclear Magnetic Resonance (NMR) Spectroscopy 74
5.2.4 Data Processing 74 5.3 Data Analysis 74 5.3.1 Chemometrics Analysis 75 5.3.2 Metabolite Identification 80 5.4 Conclusions 83 6 c o n c l u s i o n s a n d f u t u r e w o r k 84
L I S T O F F I G U R E S
Figure 1 An example of an Mass Spectrometry (MS) Spectrum, adapted from
Bleiholder et al.(2011). 8
Figure 2 An example of an 1D-NMR spectra, adapted from Anandan et al.
(2012). 9
Figure 3 Machine Learning Pipeline. 15
Figure 4 Representation of the data structure in a dataset formed in the specmine
package (Costa et al.,2016). 23
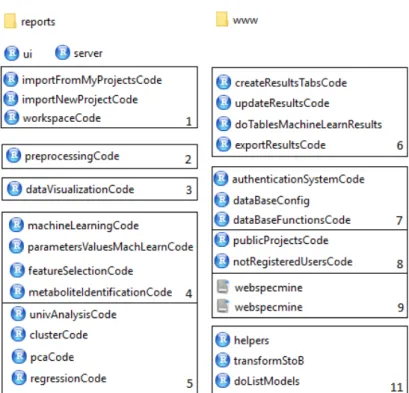
Figure 5 Scheme of the files used to develop the website. The ”reports” folder stores the different RMarkdown files used as basis to create the differ-ent reports that can be saved/downloaded. The ”www” folder stores the Cascading Style Sheets (CSS) files created to customize the web-site, as well as other images used in the website. The main files are ”ui.R” and ”server.R”. The latter calls the rest of the R files present in the scheme. Files numbered with 1 are in charge of submitting the wanted data to analysis, while the files numbered 2 and 3 have, as the names suggest, the code that is in charge of pre-processing and visualizing the data, respectively. The files numbered 4 and 5 include the code that does the different analysis provided by the website, while the files numbered 6 are in charge of the exposure of the obtained results in the website. Files numbered 7 and 8 are re-sponsible for actions related to the database. The files numbered 11 include minor functions. Finally, the files numbered 9 are the SQL
files developed to create the database. 29
Figure 6 Layout of the WebSpecmine Analysis App. 31
Figure 7 Layout of the submission of a new project of concentrations data. 32
Figure 8 Layout of ”Choose Project” feature. 33
Figure 9 Layout of new samples prediction results page. 36
Figure 10 Layout of ”Pre-Processing” page. 37
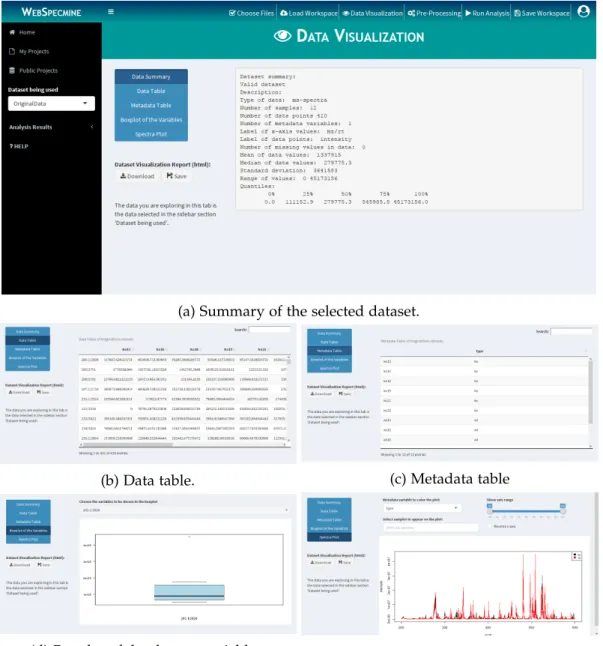
Figure 11 Layout of ”Data Visualization” page. 39
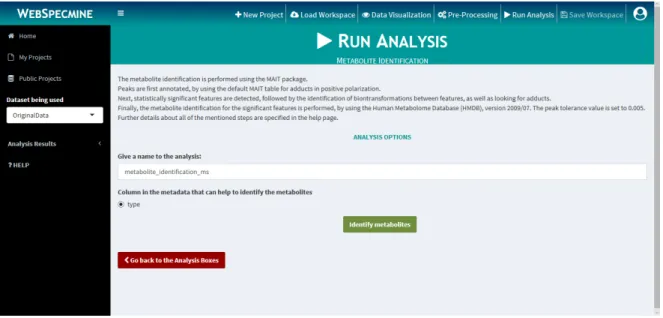
Figure 12 Layout of the ”Run Analysis” page. 40
Figure 13 Layout of the metabolite identification in the ”Run Analysis” page
for MS dataset. 42
List of Figures vii
Figure 14 Layout of the metabolite identification in the ”Run Analysis” page
for NMR peaks lists dataset. 42
Figure 15 Layout of the machine learning in the ”Run Analysis” page. 44
Figure 16 Layout of the feature selection in the ”Run Analysis” page. 45
Figure 17 Layout of a metabolite identification results page for MS data. 46
Figure 18 Layout of the options in a metabolite identification results page for
NMR peaks lists data. 47
Figure 19 Layout of a metabolite identification results page for NMR peaks lists
data. 48
Figure 20 Layout of a model training results page. 49
Figure 21 Layout of new samples prediction results page. 50
Figure 22 Layout of a feature selection results page. 51
Figure 23 Layout of the ”Help” page. 52
Figure 24 Demonstration of how to choose the files from the Propolis project
for analysis. 54
Figure 25 Demonstration of how to pre-proccess the dataset for the
chemomet-rics analysis. 55
Figure 26 Options of the one-way ANOVA on the data chemometrics dataset. 56
Figure 27 Results of the one-way ANOVA on the data chemometrics dataset. 57
Figure 28 Options of normal Principal Components Analysis (PCA) on the
data chemometrics dataset. 57
Figure 29 Results of normal PCA on the data chemometrics dataset. 58
Figure 30 Model training of the two models: Partial Least Squares (PLS) and random forests, using the data chemometrics dataset, for the metadata
class seasons. 59
Figure 31 Results of the model training performed on the data chemometrics
dataset. 60
Figure 32 Options of metabolite identification on the data ID dataset. 61
Figure 33 Results of the metabolite identification performed on the data ID
dataset. 61
Figure 34 Demonstration on how to save a report, with the example for the best model results obtained for the PLS model in the machine learning
analysis. 63
Figure 35 Demonstration of how to see a report, with the example for the re-sults obtained from the best PLS model in machine learning. 64
Figure 36 Demonstration of how to choose the files from the Mice Spinal Cord
project for analysis. 66
List of Figures viii
Figure 38 Results of the T-Test on the dataset. 67
Figure 39 Spectra plots of the dataset, highlighting the two top variables from
the one-way Analysis of Variance (ANOVA) test. 68
Figure 40 Options of the metabolite identification on the dataset. 69
Figure 41 Results of the metabolite identification on the dataset. 69
Figure 42 one-dimensional NMR (1D-NMR) mean spectra plots for each sea-son. Each plot was obtained from the ppm mean of the different samples for each season. A - Spring season. B - Summer/Autumn
season. C - Winter season. 76
Figure 43 Dendrogram plot of the hierarchical clustering, with euclidean dis-tance between samples. Spring samples are in black,
Summer/Au-tumn samples in red and Winter samples in green. 77
Figure 44 Screeplot of the PCA, showing the percentage of explained data vari-ability for each principal component obtained. The blue line corre-sponds to the individual percentage and the red one to the
cumula-tive percentage. 79
Figure 45 PCA pairs plot of the first 3 components. The variables in pink cor-respond to the spring group, the green ones to the summer/autumn
L I S T O F TA B L E S
Table 1 Metabolomics studies regarding MS and NMR techniques. 6
Table 2 Metabolite identification tools. 14
Table 3 Databases of metabolomics data. 18
Table 4 Web tools for metabolomics data analysis. 20
Table 5 Specmine functions that allow MS and NMR data pre-processing and
analysis. 24
Table 6 Table summarizing the new functions added that help in the
metabo-lite identification from NMR peaks data. 27
Table 7 Table summarizing the main the differences and similarities between
a logged out and logged in user. 30
Table 8 Identified metabolites in propolis samples with the best scores. 62
Table 9 K-means clusters for clustering into 3 groups (K=3) and into 4 groups (K=4). Spring samples are in black, Summer/Autumn samples in red
and Winter samples in green. 77
Table 10 ANOVA results for the peaks with the best corrected p-values (False Discovery Rate (FDR) method). The first column contains the con-sidered peaks, the second one the respective corrected p-value, and the final column the result of the Tukey’s test, which consists on the pair of groups that were signicantly dierent in terms of means for
each peak. 78
Table 11 1H and 13C chemical shifts and proton multiplicity for assigned compounds found in aqueous extracts of banana peels (cv. Prata An˜a) produced in southern Brazil (Santa Catarina State). 81
L I S T O F A B B R E V I AT I O N S
R2 coefficient of determination.14
1D-NMRone-dimensional NMR. viii,9,13,14,17,18,25,26,75,76,78,80,84
2D-NMRtwo-dimensional NMR. 9,14,63
AEAqueous Extracts. 73,74
ANOVAAnalysis of Variance. viii,ix,23,24,56,57,60,63,68,73,75,78,80,84
AUCArea Under the ROC Curve.14,23
ChEBIChemical Entities of Biological Interest. 18,19
COWCorrelation Optimized Warping. 11
CSSCascading Style Sheets. vi,28,29
DTWDynamic Time Warping. 11
FAAHFatty Acid Amide Hydrolase. 65,66,70
FDRFalse Discovery Rate. ix,57,60,67,78
GC Gas Chromatography. 7,8
GC-MSGas Chromatography-Mass Spectrometry. 6,20
GC/LC-MS Gas Chromatography/Liquid Chromatography-Mass Spectrometry. 10–12,21, 22
HMDBHuman Metabolome Database. 13,17,18,46–48,61,80
IRInfrared Spectroscopy. 7,22
KEGGKyoto Encyclopedia of Genes and Genomes. 18,19
LCLiquid Chromatography. 7,8
LC-MSLiquid Chromatography-Mass Spectrometry. 6,13,20,23,25,40,41,46,65,66,84
LDA Linear Discriminant Analysis.15,43,84
MMCDMadison Metabolomics Consortium Database. 13,18
MS Mass Spectrometry. vi,vii,ix,7,8,10,13,17–20,22–24,28,30,34,42,46,84
NAE N-Acyl Ethanolamine.65,70
NMR Nuclear Magnetic Resonance. v, vii, ix, 6–10, 12–14,17–20, 22–28, 30, 40–42, 47,48, 73,74,82,84,85
List of Abbreviations 1
NNNeural Networks. 15
PCAPrincipal Components Analysis. vii,viii,23,24,41,49,57,58,73,75,79,84
PLSPartial Least Squares. vii,16,25,43,49,59,60,63,64,84
PLS-DAPartial Least Squares Discriminant Analysis. 15,21
PLS-rPartial Least Squares Regression. 15
RMSERoot Mean Square Error. 14
ROCReceiver Operating Characteristic. 44
SNPSingle Nucleotide Polymorphism.17
SVMs Support Vector Machines.15,16,21,43,84
1
I N T R O D U C T I O N
1.1 c o n t e x t
Omics technologies are responsible for analysing a global set of molecules and their interac-tions at a large scale. These technologies have revolutionized the way biological research is conducted, being very important in areas such as functional genomics, characterization of biological systems, biotechnology and biomedical research (Costa, 2014; Villas-B ˆoas et al., 2006).
Two of these technologies are transcriptomics, which represents the study of the total set of mRNA present in the cell, and proteomics, consisting in the analysis of all proteins present in the cell (Villas-B ˆoas et al.,2006).
Metabolomics is a more recent omics technology and, as the name suggests, analyses all or part of the metabolome, which corresponds to the set of all metabolites used or formed by the cell under study. The metabolome is separated into two major groups: endometabolome, which is the group of intracellular metabolites, and exometabolome, the group of secreted metabolites (Villas-B ˆoas et al.,2006).
Metabolites are compounds of low molecular weight (less than 1000 Daltons), such as glucose, being the biochemical reaction intermediates, playing a role in connecting the pathways that occur in the cell. The metabolites are divided into primary and secondary metabolites. The former are directly involved in the normal cellular growth, development and division, whereas the latter are not directly involved in these processes, although they have very important functions, both in the cell (e.g. in regulatory or signalling pathways) and biomedical research (as is the case of antibiotics).
Therefore, metabolites represent essential information about the cell function, helping to understand and define the cell and tissue phenotype, in response to genetic or environ-mental changes. Thus, metabolomics data help in the study of metabolic systems, sample discrimination and identification of biomarkers, for example (Costa,2014;Villas-B ˆoas et al., 2006).
Although transcriptomics and proteomics are now in rapid development, with high throughput analysis methods being used, the methods used in metabolomics are far less
1.2. Objectives 3
common and there is not a single one that allows the analysis of the whole metabolome. This is partially due to the fact that metabolites are compounds with great chemical diver-sity, that can go from hydrophobic lipids to volatile alcohols, and with fast turnover, i.e., many metabolites are rapidly consumed/transformed as soon as they are formed, thus hav-ing low concentrations in the cell. Also, since the same metabolite can participate in many different pathways, interpretation of metabolomics data can be difficult (Villas-B ˆoas et al., 2006).
Still, metabolomics has a wide range of applications, such as plant biology, nutrition, drug discovery and the study of human diseases, which can consist of finding diagnostic and prognostic biomarkers, environmental factors on human health and predict treatment response (Alonso et al.,2015).
A number of computational tools have been put forward over the last years for metabolo-mics data analysis, targeting broader purposes or more specific tasks, as well as covering a wider or smaller range of experimental techniques. Many of these tools that analyse metabolomics data require programming skills, as they come in the form of packages to be used in different programming systems, with few ones based on a web service, which facilitates the analysis of these type of data for people who do not have programming skills. The existing web services lack some tools regarding metabolomics data analysis, such as the lack of training models diversity, or not allowing the user to save data to be used later or shared. Accordingly, following the development of the R package specmine by the host research group (Costa et al.,2016), a metabolomics and spectral data analysis/mining framework that addresses the development of customizable data analysis pipelines, cover-ing different types of metabolomics and spectral data, a website supportcover-ing this package was created.
1.2 o b j e c t i v e s
Given the context described above, the main aim of this work was the design and develop-ment of a web-based computational platform for metabolomics data analysis and knowl-edge extraction, based on the specmine R package previously developed on the host group. The work aimed to address the exploration and integration of data from distinct experimen-tal techniques, focusing on Nuclear Magnetic Resonance (NMR) and Mass Spectroscopy (MS), and, as regards to analysis tools, on machine learning, feature selection and metabo-lite identification, as the website was created colaboratively.
More specifically, the work aimed to address the following scientific/ technological goals: • To review the state of the art regarding metabolomics data analysis, including
1.3. Dissertation Organization 4
• To design and implement adequate web-based interfaces for metabolomics data anal-ysis and data mining pipelines, based on the functions provided by the specmine pack-age.
• To design and implement novel functions for metabolomics data analysis/mining extending the functionality of specmine, focusing on metabolite identification.
• To validate the tools developed with several case studies of interest for the host groups in the analysis of the biomedical potential of natural products, including for instance bananas or propolis.
• To write scientific publications with the results of the work.
1.3 d i s s e r tat i o n o r g a n i z at i o n
The present dissertation is divided into six chapters. This first chapter consists in a brief introduction to the subject of the present work, by providing a context, reasons and ob-jectives for the work developed. After this chapter, the second one aims to present the state of the art of the metabolomics field, by providing an explanation on the main steps of a metabolomics experiment, as well as current metabolomics tools available, not only in analysis of such data but also in databases that provide metabolomics data and associated information.
After these two chapters, the ”Development” chapter explains how the work was con-ducted, by showing the development strategy applied and tools used in the process. Fur-thermore, it is also given a detailed information on how the website works and why and how the new features were added to the specmine package.
In the following chapter, two use cases are presented, to show how previously developed studies can be reproduced by using the developed site. The next chapter contains a case study developed during this work that made use of the developed technologies, focusing on the analysis of NMR data for bananas.
The final chapter contains the main conclusions taken from this work and an analysis on future work that might be necessary to further improve both specmine package and WebSpecmine site.
2
S TAT E O F T H E A R T
This chapter covers the state of the art of the metabolomics field, addressing the main steps of a metabolomics experiment.
Usually, a metabolomics experiment is performed following a certain methodology, be-ginning with the sample preparation to be studied, involves the acquisition of data, which can be quantification and/or qualification of the metabolites present, according to the type of technique chosen, and ends in the treatment, analysis and interpretation of those data.
The Table 1 shows some of the metabolomics studies that use chemical analytical tech-nologies, data treatment and analysis methods covered in this chapter.
2.1 m e t h o d o l o g i e s
The metabolome analysis, which corresponds to the identification and quantification of the metabolites in biological samples, is done making use of, in general, four main methodolo-gies. Metabolic Fingerprinting aims to know the fingerprint of the metabolites produced in the cell, without providing information about specific metabolites. Therefore, it is a tech-nique utilized to group/discriminate the samples under study, such as sorting mutants or types of growth media, according to the metabolites present. Metabolic Footprinting analy-ses the exometabolome through the analysis of specific metabolites or fingerprints, similarly to what happens with Fingerprinting. Metabolite Profiling is a semi-quantitative technique involved in analysing specific groups of metabolites, whose acquired data may be further used for metabolic models. Lastly, Metabolite Target Analysis quantifies the metabolites involved in a certain part of the metabolism (Villas-B ˆoas et al.,2006;Costa,2014).
Even though Metabolic Fingerprinting and Footprinting can help in the discrimination of the samples under study, the data obtained from these two methodologies is not so useful for integration with other omics data (transcriptomics and proteomics), where quantitative data is required (Villas-B ˆoas et al.,2006).
2.1. Methodologies 6
Table 1: Metabolomics studies regarding MS and NMR techniques. Study Description Technique Pre-processing Analysis Reference Analyze transgenic maize effects on the development
of seeds NMR Normalization; Baseline Correction Machine Learning Castro and Manetti (2007)
Classification of rapeseed oils NMR Baseline Correction
Variable Selection
Chen et al.
(2010)
Predict cancer-associated skeletal muscle wasting NMR Logaritmic Transformation; Normalization Machine Learning Eisner et al. (2010)
Metabolic profiling in Crohn’s disease NMR Baseline Correction; Normalization; Mean Centering Biomarker Analysis Fathi et al. (2014)
Identification of the farm origin of salmon NMR Peak Alignment; Normalization
Machine Learning
Martinez et al.(2009)
Confirmation of wild and farmed salmon and their origins
NMR Peak Alignmetn Machine Learning
Masoum et al.(2007)
Metabolic profiles of tomato flesh and seeds during fruit development NMR Baseline correction; Peak Alignment Machine Learning Mounet et al.(2007)
Propolis classification NMR Normalization Machine Learning
Papotti et al.(2010)
Evaluation of tubulointerstitial lesions’ severity in pa-tients with glomerulonephritides
NMR Baseline Correction Machine Learning Psihogios et al.(2007)
Study the metabolic response of the earthworm Eise-nia fetida to two pesticides
NMR and GC-MS Peak Alignment; Normalization Metabolite Identification; Biomarker Analysis McKelvie et al.(2009)
Identify novel biomarkers and pathways activated in myocardial ischemia LC-MS Logaritmic Transformation; Normalization Pathway Analysis; Biomarker Analysis Sabatine et al.(2005)
Development of an optimized extraction and deriva-tization protocol, using experimental design theory, for analyzing the human blood plasma metabolome
GC-MS Baseline Correction; Alignment Machine Learning Jiye et al. (2005)
Exposure end effect markers of fruit and fruit fibre intake
LC-MS Normalization Biomarker Analysis
Kristensen et al.(2012)
Whether the metabolic signature in serum from pa-tients with acute lymphoblastic leukemia is different from the healthy ones
LC-MS Normalization Metabolite Identification; Biomarker Analysis; Pathway Analysis; Enrichment Analysis Bai et al. (2014) ]
2.2. Sample Preparation 7
2.2 s a m p l e p r e pa r at i o n
Sample Preparation for metabolomics analysis is very important, since it has to ensure that the samples are prepared to be a true representation of the original samples. This step differs with the organism in question and the cells structure, as well as the type of metabolites to be analysed. As mentioned above, metabolites have a high turnover, mainly the primary ones, which makes the quenching method an important step that should be done simultaneously or right after obtaining the samples that will be analysed. Quenching is a sudden and instant change of the samples temperature or pH, to stop all the biochemical processes that are taking place in the concerned cells and, therefore, obtain the metabolites present in that exact moment. It is noteworthy that the techniques used in the quenching vary according to the type of cells being studied (Villas-B ˆoas et al.,2006).
Next, to obtain the desired metabolites, the method varies according to their physico-chemical properties nature and localization, if intracellular or extracellular. If the aim is to analyse both intracellular and extracellular metabolites, without any distinction between these two types, the cells membranes and/or walls should be disrupted, followed by the separation of the compounds from the biological matrix. On the other hand, if the desire is to analyse both extracellular and intracellular metabolites separately, or only one of these, it is necessary to separate the cells from the extracellular medium and, thereafter, extract the intracellular metabolites from the cells and the extracellular ones from the medium (Villas-B ˆoas et al.,2006).
A final step is sample concentration, by removing totally or partially the solvents of the samples. This is done through freeze-drying the solvents (lyophilization) and removing them through sublimation. Removing water from aqueous samples through this method can also prevent heat degradation (Villas-B ˆoas et al.,2006).
2.3 t e c h n i q u e s
There are various techniques used in the analysis of the metabolome, mostly MS, nor-mally coupled to chromatography techniques such as Gas Chromatography (GC)and Liq-uid Chromatography (LC), as well as NMR technique, Infrared Spectroscopy (IR), and
Ultraviolet-Visible (UV-Vis)(Villas-B ˆoas et al.,2006).
Next, we will coverMSandNMRtechniques, which lead to the types of data approached in this work.
2.3. Techniques 8
2.3.1 Mass Spectrometry (MS)
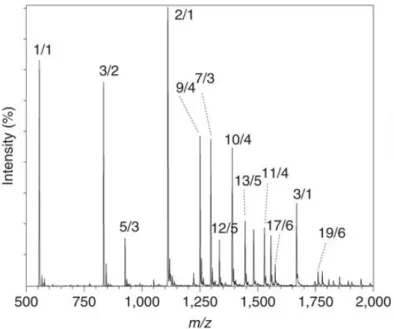
Mass Spectrometry determines the mass charge ratio (m/z) of charged compounds, whether they are molecules, groups (clusters) of molecules, complexes or fragments, or any combi-nation of these. To be able to know the mass/charge ratio of the different metabolites in the sample, usually it is necessary to analyse the metabolites separately. This separation is achieved by the techniques GC or LC, performed before the MS technique. Both chro-matographies are based on the interaction of the different metabolites in the sample with the absorbent materials inside the chromatography column, where the metabolites with different chemical properties result in a different crossing time along the column. GC is only used in volatile samples. The different metabolites are then ionized, so that they are charged and, therefore, to be possible to determine their mass/charge ratio. The results, i.e., spectral data, are obtained in the form ofMSspectrum, where the x-axis is the mass/charge ratio and the y-axis the intensity/quantity of the different ions originated by the metabolite, as shown in Figure1. Thus, the peak patterns of each graph allow the metabolite identifica-tion, since each metabolite has a characteristic pattern (Alonso et al.,2015;Villas-B ˆoas et al., 2006).
Figure 1: An example of anMSSpectrum, adapted fromBleiholder et al.(2011).
2.3.2 Nuclear Magnetic Ressonance (NMR)
NMR spectroscopy exploits the magnetic properties of certain atomic nuclei to determine the chemical and physical properties of those atoms or molecules. This happens because
2.3. Techniques 9
the variation of the external magnetic field causes the absorption and re-emission of energy by the atomic nuclei to vary. Therefore, this shift is calculated as the difference between the resonance and the reference substance frequencies, divided by the operating frequency of the spectrometer.
It must be kept in mind that the analysis of different atomic nuclei generates different metabolomics data, being the most used one the hydrogen (1H-NMR), by virtue of being the most abundant in biological samples. Other atoms, less frequent, such as carbon and phosphorus, can also be the target of this technique. The spectra obtained display the chemical shifts on the x-axis and the signal intensity on the y-axis (Costa, 2014; Alonso et al.,2015).
Two types of spectra are more commonly obtained withNMR. The 1D-NMR spectrum,
shown in Figure 2, is the most used in metabolomics studies, while the two-dimensional NMR (2D-NMR)spectrum is only used for characterization of compounds that are impossi-ble to identify through the1D-NMRspectrum, since the second dimension of this spectrum
allows to separate overlapping peaks. The spectral data obtained from NMRnot only en-ables metabolite quantification, but also provides information on the chemical structure of the metabolites, allowing their identification. This last information is acquired by analysing the spectral peaks pattern, since each metabolite has a characteristic pattern (Costa, 2014; Alonso et al.,2015).
2.4. Data Pre-Processing and Pre-Treatment 10
MS has higher sensitivity than NMR, which enables a quantitative measure of a wider range of metabolites and identification of unknown and unexpected compounds, despite being slower and more complex than NMR. Furthermore, NMR is a non-destructive tech-nique and highly reproducible, although it requires a relatively large number of samples and the equipment costs are much higher. Also, NMR metabolite quantification may be difficult, due to shifting peak positions, peak overlap and noise from the biological matrix.
NMRhas been widely applied to obtain information on metabolite profiles of complex bio-logical mixtures, such as biobio-logical fluids and cells extracts (Costa,2014;Alonso et al.,2015; Kosmides et al.,2013;Hao et al.,2012).
2.4 d ata p r e-processing and pre-treatment
Pre-processing and pre-treatment are two terms that can be considered different. The first one is often taken to include the techniques used when extracting the data or preparing it for analysis, and the latter to include the methods applied on the dataset that make samples analysable and comparable (Liland,2011).
Nevertheless, the processing/treatment ofNMRandGC/LC-MSdata is normally achieved by treatment of missing values and outliers, peak spectra processing, normalization and scaling.
A missing value consists of an observation where a variable has no value. There are several ways to do the processing of missing values. One of these involves the removal of the variable or sample that contains the missing value, whilst the substitution of the variable with a certain value is another way. This ”default” value may result from the data column or row mean, as well as from other methods that use information from the nearest values, such as K-nearest neighbours, which selects the most frequent value from the k nearest values or their mean. Outliers are data points that are distant from the other observations, whether due to variations in data measurement or experimental errors, and are usually excluded from the dataset (Batista and Monard,2002).
Processing spectral data from GC/LC-MS and NMR techniques consists of peak align-ment, baseline, offset and background corrections and smoothing.
Normally, spectral peaks can suffer dislocations through the x-axis, which can be caused by changes in the chemical environment of the sample like ionic strength, pH or protein content, in NMR, or in the chromatographic column, in the MS technique. Correcting these displacements before the data analysis is very important, so that the peaks appear where expected and it will be possible to study the multiple samples, specially to compare metabolic features between spectra (Alonso et al.,2015).
Peak Alignment methods can be separated into warping and segmenting methods. The first ones are based on the application of a non-linear transformation to the ppm, in NMR,
2.4. Data Pre-Processing and Pre-Treatment 11
and retention time, inGC/LC-MS, axis, in order to increase the correlation between spectra. Then, the alignment is done through the enlarging or shortening of the spectra segments until the maximum correlation is achieved. Correlation Optimized Warping (COW) and
Dynamic Time Warping (DTW)are two of these methods.
On the other hand, segmenting methods apply a constant shift to all spectra points, then aligning the overall spectra or splitting it and aligning all the resulting segments indepen-dently. The easiest way to correct the dislocations is by using shifting correction, which divides the spectrum into a certain number of local windows, moving the peaks to match along the spectrum. Although it is fast due to the fact that it is done locally, this method leads to some alignment errors, when peaks fall into the wrong local window, existing more robust methods, such as the aforementioned COW. Also, there is the Icoshift procedure, a newer and quicker method that uses fast Fourier transforms (Liland, 2011; Alonso et al., 2015).
Data correction, which can either be baseline, offset or background, aims to eliminate the effect of certain signal variations through the spectra and background noise during the sample analysis, caused by either experimental or instrumental variation, because most analysis techniques cannot distinguish between noise and signal (Alonso et al.,2015; Villas-B ˆoas et al.,2006). This correction is very important, for example, in metabolite identification, so that the analysis does not reveal metabolites that are not there (Liland, 2011). Lastly, smoothing consists in the reduction of the data random noise, which helps the robustness of the analysis and visual interpretation, especially in cases where the ratio signal-to-noise is high or the analysis methods to be used are sensitive to noise. There are three different methods to perform this technique: Savitzky-Golay, the most used, binning, useful when there are various measurements per spectrum and has the potential to correct small peak shifts, and loess (Varmuza and Filzmoser,2010;Liland,2011).
Sometimes, it is preferable to look at the relative differences between samples, instead of the absolute values. This allows to make different data comparable and consistent and, thus, allow a correct measurement of the features in the metabolomics analysis. This type of correction is known as normalization and, therefore, consists of row-wise transformation. The most common normalization method is the subtraction of the row mean to each data value and dividing by the standard deviation (Villas-B ˆoas et al., 2006; Alonso et al., 2015; Varmuza and Filzmoser,2010).
Data mean-centering is a column-wise transformation and consists of subtracting the mean spectrum to each sample, so that all columns have zero mean. Mean-centering is focused on emphasizing the differences and not the similarities of the data, being applied with scaling methods (Varmuza and Filzmoser, 2010; van den Berg et al., 2006). Scaling consists of a column-wise transformation so that all have the same variance, by dividing each variable by a factor, the scaling factor. Scaling also allows samples with variables
mea-2.5. Analysis of the processed data 12
sured on different scales more comparable. Auto-scaling, used when comparing metabo-lites based on correlations is required, Pareto scaling, used to reduce the relative importance of large values, while keeping the data structure relatively intact, and Range scaling, which enables the comparison between different metabolites with regard to biological response range (van den Berg et al.,2006;Liland,2011).
Finally, transformations, both logarithmic and power, are non-linear conversions of the data and are usually applied to correct, for example, heteroscedasticity, which is the ex-istence of absolute noise that increases with the rising of the signal intensity. Whilst the logarithmic transformation does not deal with null values, the power transformation can, in addition to having effect on heteroscedasticity (Kvalheim et al.,1994;van den Berg et al., 2006).
2.5 a na ly s i s o f t h e p r o c e s s e d d ata
To analyse metabolomics data, it is possible to do metabolite identification, univariate anal-ysis, unsupervised and supervised multivariate analysis. Univariate analysis studies a data variable at a time, which is easy to perform and interpret. Multivariate analysis uses all or many metabolomics features simultaneously to identify relations between them. The unsupervised multivariate analysis is normally used to summarize data and thus detect patterns that can be related to biological variables or experimental ones. Supervised multi-variate analysis consists of machine learning and feature selection (Alonso et al.,2015).
2.5.1 Metabolite Identification
Metabolite identification is done using NMRandGC/LC-MSdata and is an essential step to give biological meaning to the study.
Metabolite identification of GC/LC-MS data starts with the detection of the existing peaks in the spectra, followed by discrimination of which peaks belong to the same source metabolite and, finally, each of these groups of peaks, which have a certain mass and were acquired under a certain chemical environment (ionization mode, for example), are com-pared to the peaks of each metabolite on a predefined database. These metabolites are acquired under similar conditions to those of the samples analysed. The identification is possible because each metabolite has a characteristic spectrum under different conditions.
The identification of metabolites from NMR data is achieved by matching the spectra of measured NMRpeaks against the ones from each reference metabolite, acquired under similar conditions to those of the samples analysed. One of the approaches taken can also include a discrimination of which peaks belong to the same source metabolite before
match-2.5. Analysis of the processed data 13
ing each group of peaks obtained with the peaks of each one of the reference metabolites (Jacob et al.,2013).
The reference metabolites that reveal to have more peaks that better match to the ones in the samples, or to the groups of peaks obtained, are the identified metabolites.
The quantity, as well as quality, of the reference spectra in metabolite spectral databases is essential for a good metabolite identification (Alonso et al.,2015;Fern´andez-Albert et al., 2014).
There are several R packages that were developed to achieve metabolite identification. MAIT is an R package that allows metabolite identification of data from the LC-MS tech-nique. It includes peak detection in the LC-MS samples files, peak annotation, which in-creases the biological and chemical information of the dataset and improves the metabolite identification, statistic analysis, revealing which samples features are statistically significant and their predictive power, and tables and graphics creation. The MAIT package uses the packages xcms and CAMERA to detect and align the peaks and the Human Metabolome Database (HMDB) as the database of metabolites to compare to (Fern´andez-Albert et al., 2014;Kuhl et al.,2012;Tautenhahn et al.,2012).
The Bayesian AuTomated Metabolite Analyser for NMR spectra, batman, is an R pack-age that deconvolves the 1D-NMRspectrum peaks, automatically assigning them specific
metabolites and estimating their concentration, with a reduced average estimation error when compared with other conventional numeric integration methods. The Bayesian model uses information about characteristic peak patterns of metabolites, which enables the recog-nition of overlapped signal(s), and has into account the shifts that may occur in the position of the peaks that normally are found in NMRspectra of biological samples. These charac-teristic peak patterns of metabolites are obtained through the database HMDB(Hao et al., 2012,2014).
There are also web tools specialized in performing metabolite identification. Metabo-Hunter (http://www.nrcbioinformatics.ca/metabohunter/) is a web tool that automat-icaly identifies metabolites, based on spectra or peak lists from the 1D-NMR technique,
through three different methods (Tulpan et al., 2011). This web server uses manually cu-rated data from the publicly available databasesHMDBandMadison Metabolomics Consor-tium Database (MMCD). Bayesil is another web tool specialized in metabolite identification from the NMR technique. This tool focuses on identifying metabolites and their concen-trations present in a human’s biofluids, the metabolic profile, due to the fact that many diseases can cause changes in the metabolic profile (Ravanbakhsh et al.,2015).
This and other tools used for metabolite identification fromMSandNMRtechniques are listed in Table 2
2.5. Analysis of the processed data 14
Table 2: Metabolite identification tools. Tool Type Spectral Data URL
MAIT R GC-MS https://www.bioconductor.org/packages/ release/bioc/html/MAIT.html
BATMAN R 1D-NMR http://batman.r-forge.r-project.org/
rNMr R NMR http://rnmr.nmrfam.wisc.edu/
MetaboHunter Web tool 1D-NMR http://www.nrcbioinformatics.ca/ metabohunter/
Bayesil Web tool NMR http://bayesil.ca/
MetaboMiner Software 2D-NMR http://wishart.biology.ualberta.ca/ metabominer/index.html
2.5.2 Machine Learning
Supervised multivariate analysis, or Machine Learning, consists in the creation of predictive models that predict a determined output from a certain data input. From certain examples, normally part of the given data, that lead to a particular known output, it is possible to form a general model that not only can predict the given examples, but also other data whose outputs are unknown, in an accurate way. There are two approaches to reach a predictive model. The first one, called classification, involves a discrete output variable, i.e., the models seek to predict to which category a certain sample belongs, from a set of output categories/classes possible. The second one, regression, involves a numerical output variable, where the model will be, typically, a set of mathematical expressions that lead to the output value (Rocha et al.,2008).
So that the model can be evaluated, it is necessary to use error metrics. The simplest one is accuracy, which is the proportion of samples correctly classified, while the Kappa Statistic compares the observed accuracy with the expected, determining how close the classification from the model is to real classification. The metric Area Under the ROC Curve (AUC)measures the performance of a two classes classifier. These metrics are used in a classification problem. With regard to regression problems, there are essentially two error metrics: Root Mean Square Error (RMSE)andcoefficient of determination (R2)(Rocha
et al.,2008).
The error metrics are then used in model validation methods, which evaluate the model performance based on data, test examples, whose output is already known, but not used to build the model. The holdout method, the most popular, divides the available data into these two parts. The k-fold cross validation method also divides the data this way, but k different times, where test sets are mutually exclusive. In the resampling method, train examples are randomly chosen, allowing the existence of data repetitions, and test examples are those that are not selected as train examples. Model validation is crucial to
2.5. Analysis of the processed data 15
choose the best model to utilize, out of a set of selected models, having to pay attention that, nevertheless, the model with the least error may not be the best one (Rocha et al.,2008). The pipeline of machine learning is elucidated in Figure3.
Figure 3: Machine Learning Pipeline.
About the actual models, trees and functional models can be applied in both classification and regression problems. In trees, each example is predicted by a downward path through the tree, starting at the root node and ending in one of the leaves, whose value is the output prediction for that example. Each tree node is a variable and its possible values are the branches that leave the node. In classification problems, the model is called decision tree, while in regression problems is named regression tree (Rocha et al.,2008).
Random forests consist of a set of decision trees whose nodes are chosen randomly (Liland, 2011). Similar to tree models is Rule-Base Classifier, which is a model with a set of classification rules, where each rule leads to one of the possible output values. The output of an example to classify depends on what rule or rules the example follows (Rocha et al.,2008).
Functional models attempt to model a problem through a function, whose arguments are the input values and the output variable is the one intended to be predicted. Some of these models, such as Linear Discriminant Analysis (LDA), Partial Least Squares Discriminant Analysis (PLS-DA)for classification problems andPartial Least Squares Regression (PLS-r)
for regression problems, utilize a mathematical formula known a priori that is adjusted to better predict data.
Other models are more complex and general, with non-linear components, capable of modelling any type of function, such as Neural Networks (NN)and Support Vector
Ma-2.5. Analysis of the processed data 16
chines (SVMs). The first one tries to mimic the learning process of the brain, by having an initial layer that has as input the examples, an hidden layer that does calculations that lead to the output, the third layer. The latter, SVMs, have vectors that are the examples considered to be on the margin between two possible outputs and are used to distinguish the outputs (Liland,2011).
There are also many other models, such as K-Nearest Neighbours, where a predicted value corresponds to the most common value on a set of k nearest examples to the example to predict, from a dataset whose outputs are known; and Na¨ıve-Bayes, that estimates the probability of each possible output value for a certain example, according to what is known by a set of examples whose outputs are known (Costa, 2014; Rocha et al., 2008; Liland, 2011).
2.5.3 Feature Selection
Many of the input variables have null impact (or even negative) on the output to predict. Therefore, feature selection seeks to select the set of the most important input variables, allowing the model learning process to be easier, improving its prediction performance, robustness and generalization. Thus, the models derived from the selected variables can be faster and more cost-effective (Rocha et al.,2008;Guyon and Elisseeff,2003).
In addition to the potential benefits from using feature selection listed above, the data visualization and comprehension can be facilitated, as well as the measurement and storage requirements and training and utilization time reduced (Guyon and Elisseeff,2003).
The feature selection algorithms can be divided into two main groups. Wrapper Algo-rithms use the prediction performance of a given model to evaluate the usefulness of a previous selected subset of variables and compare it to other subsets of variables created.
There are, then, three main questions to answer when developing a wrapper algorithm. Firstly, how the search of the possible variable subsets to consider should be done. For this, an exhaustive search could be used. However, for a large number of variables, it is not the best method. There are more efficient methods, such as genetic algorithms, which use populations of solutions that evolve during a set of generations; forward selection, which begins with one or few features and adds iteratively more important variables; and backward selection, which begins with all variables and removes less important variables iteratively.
Secondly, what model validation methods should be used to access the model perfor-mance, by estimating error measures, in order to evaluate the subsets of variables. Lastly, what learning model should be used. The most popular include decision trees, na¨ıve Bayes,
2.6. Metabolomics Databases 17
Filter Algorithms, on the other hand, do not depend on a model, which can be seen as a pre-processing method. The best subset of variables is selected through the evaluation of the variables in the dataset, using univariate statistics, such as correlation between the input variables and the variable to predict, or quality information gain, leaving behind the least interesting variables. Then, the selected subset of variables is used in a selected model and its prediction performance is assessed (Rocha et al., 2008; Guyon and Elisseeff, 2003; Costa,2014).
Sometimes, these two strategies are used together.
2.6 m e ta b o l o m i c s d ata b a s e s
So that is possible to perform analyses such as metabolite identification, pathway analysis, enrichment analysis and biomarker identification, it is important that researchers have an easy access to information such as metabolite characteristics, metabolic networks, metabo-lite spectra and datasets of metabolomics experiments. This information has been easier to access due to the increasing number of open and web accessible databases, some mentioned in Table3.
TheHuman Metabolome Database (HMDB),http://www.hmdb.ca, was first introduced in 2007 and it is now the world’s largest and most comprehensive web-accessible organism-specific metabolomics database. HMDB is designed for biochemists, clinical chemists, physicians, medical geneticists, members of the metabolomics community and general ed-ucation (Wishart et al.,2007,2013).
Each metabolite entry in the database has many separate data fields, including compound description, names and synonyms, structural information, physical, chemical and biological data, such as biofluid concentrations, disease associations and pathway information. It also contains NMR andMSspectra from many reference metabolites. Furthermore, it can also provide enzyme data, gene sequence data, Single Nucleotide Polymorphism (SNP) and mutation data, and links to images, references and other public databases (Wishart et al., 2007,2009).
Metabolights, http://www.ebi.ac.uk/metabolights/, was introduced in 2012 and it is an open-access repository for metabolomics studies, providing not only the raw experi-mental data, but also the respective metadata. This repository is species and cross-technique, such as NMR spectroscopy and MS. Lastly, it also comprises metabolite struc-tures, their reference spectra and biological roles, location and concentrations (Haug et al., 2013). The total number of studies made public arises to more than 200.
Mery-b, http://services.cbib.u-bordeaux.fr/MERYB/, was first introduced in 2009 and it is a web-accessible repository for metabolomics studies, metabolites information and spectra of 17 different plants, obtained by the 1D-NMRtechnique. The number of spectra
2.6. Metabolomics Databases 18
Table 3: Databases of metabolomics data.
Database Description Type1 URL
BioCyc Freely accessible data collection of metabolic pathways and genomic infor-mation.
MPath https://biocyc.org/
ChEBI Freely accessible data collection of small molecules, such as metabolites.
MInf http://www.ebi.ac. uk/chebi/
CHEMBL Freely accessible data collection of man-ually curated drug-like bioactive com-pounds.
MInf https://www.ebi.ac. uk/chembl/
ChemSpider Freely accessible data collection of chem-ical compounds, not only metabolites.
MInf http://www. chemspider.com/
DROP met Being part of the web technology Prime, it allows the download of plant datasets and metadata from theMStechnique.
MDat http://prime.psc. riken.jp/?action= drop_index HMDB Freely accessible data collection of
hu-man metabolites.
MInf, MPath, MSpec http://www.hmdb.ca/
KEGG Freely accessible data collection of genes, genomes, genes products, metabolic and regulatory pathways from various species.
MPath http://www.genome. jp/kegg/
MassBank Freely accessible data collection of MS
pure metabolite spectra.
MSpec http://www.massbank. jp/
MassBase 1.0 Freely accessible data collection of metabolomics plant datasets from the MS technique for download.
MDat http://webs2.kazusa. or.jp/massbase/ index.php/
Mery-b Web-accessible repository for metabolomics studies, metabolites information and spectra of plants, obtained by the1D-NMRtechnique
MInf, MSpec, MDat http://services. cbib.u-bordeaux.fr/ MERYB/
MetaboLights Freely accessible data collection ofmetabolomics datasets and metadata from the techniques MS and NMR for download, and metabolite information derived from those experiences.
MInf, MSpec, MDat http://www.ebi.ac. uk/metabolights/
Metabolome Express
Freely accessible data collection of metabolomics datasets, centered in plants, from the MS technique.
MDat https://www. metabolome-express. org/
Metabolomics Workbench
Public repository for metabolomics ex-perimental data from various species and from the NMRandMStechniques, and metabolite information.
MInf, MDat http://www.
metabolomicsworkbench. org/
METLIN Freely accessible data collection of metabolite information and MS/MS spectra, centered in humans.
MInf, MSpec https://metlin. scripps.edu/ MMCD Freely accessible data collection ofNMR
metabolite spectra.
MSpec http://mmcd.nmrfam. wisc.edu/
PubChem Freely accessible data collection of gen-eral information about chemical com-pounds.
MInf https://pubchem. ncbi.nlm.nih.gov/
Reactome Freely accessible data collection of previ-ously curated metabolic pathways.
MPath http://www.reactome. org/
1The column Type covers the types of metabolite information that the databases may provide: MInf-Metabolite Information,
2.7. Web tools to analyse metabolomics data 19
publicly available accounts to more than 1900, with 34 studies made public (Ferry-Dumazet et al.,2011).
Metabolomics Workbench,http://www.metabolomicsworkbench.org/, is a public repos-itory for metabolomics experimental data, and respective metadata, from various species and from the NMRand MStechniques. This database also provides information on more than 60 000 metabolites, regarding structure, physicochemical properties, taxonomy and database links (Sud et al.,2016).
The Chemical Entities of Biological Interest (ChEBI) database, present in http://www. ebi.ac.uk/chebi/, was first introduced in 2007 and provides information about natural or synthetic small molecules, such as metabolites, that intervene in the living organisms processes. This information includes molecules’ 2D and 3D structure, definition, molecular formula, onthology, synonyms, links for other databases, among others (Degtyarenko et al., 2008;Hastings et al.,2013).
Another important database is Pubchem,https://pubchem.ncbi.nlm.nih.gov/, which was first introduced in 2004 as a component of the Molecular Libraries Roadmap Initiatives of the US National Institutes of Health (NIH) and provides information about chemical sub-stances and their biological activities. This database consists on three inter-linked databases: Substance, which contains chemical information; Compound, with the chemical structures; and BioAssay, with the biological activity of the chemical substances (Kim et al.,2015).
One last database worth mentioning is the Kyoto Encyclopedia of Genes and Genomes (KEGG), a database project initiated in 1995 under the Human Genome Program of the Min-istry of Education, Science, Sports and Culture in Japan that comprises information from three different databases, present inhttp://www.genome.jp/kegg/. The Genes database is a collection of gene catalogues for completely sequenced and partial genomes. The Ligand database consists in a collection of chemical compounds in the cell, enzyme molecules and enzymatic reactions. Lastly, the Pathway database contains graphical representations of cellular processes, such as metabolism, membrane transport, signal transduction and cell cycle. The metabolic pathways part is the best organized one of the Pathway database, with approximately 90 graphical diagrams of reference metabolic patahways (Ogata et al.,1999).
2.7 w e b t o o l s t o a na ly s e m e ta b o l o m i c s d ata
Web tools that allow the processing and analysis of metabolomics data facilitate the com-prehension and extraction of knowledge from metabolomics data, without enforcing the user to have programming skills, as many tools currently available that help in this analysis require these skills. There are many web tools that have been created throughout the years, and some of them are reviewed in the Table 4. The website MetaboAnalyst3 is the most remarkable one.
2.7. Web tools to analyse metabolomics data 20
Table 4: Web tools for metabolomics data analysis.
Web tool Covered
Techniques
Features1 URL
Bayesil NMR MId http://bayesil.ca/
IMPaLA - PA, EA http://impala.molgen.mpg.
de/
MassTrix - PA http://masstrix3.
helmholtz-muenchen.de/ MetaboAnalyst 3.0 NMR,MS MId, ML, FS, PA, EA, BI http://www.metaboanalyst.
ca/
MetExplore - PA, L http://metexplore.
toulouse.inra.fr/ MetaboHunter NMR MId http://www. nrcbioinformatics.ca/ metabohunter/ Metabolites Biological Role (MBRole2.0) - EA http://csbg.cnb.csic.es/ mbrole2/
Metabolome Express GC-MS MId, L https://www.
metabolome-express.org/ Metabolomics Work-bench NMR,MS ML, FS, PA, L http://www. metabolomicsworkbench. org/
MetDAT MS MId, ML, PA, L https://smbl.nus.edu.sg/
METDAT2/
Metldb2.0 GC-MS MId, ML, EA, L https://meltdb.cebitec. uni-bielefeld.de/
Paintomics - PA, L http://bioinfo.cipf.es/
paintomics/
XCMX online LC-MS MId, PA, L https://xcmsonline.
scripps.edu/
1The column Features covers the features that the web tools may have: MId-Metabolite Identification, ML-Machine Learning,
FS-Feature Selection, PA-Pathway Analysis, EA-Enrichment Analysis, BI-Biomarker Identification, L-Login
MetaboAnalyst, http://www.metaboanalyst.ca/, was first introduced in 2009 and it al-lows now the comprehensive analysis, visualization and interpretation of metabolomics data that come from NMR and MS techniques. This website provides various types of metabolomics analysis and processing. Besides providing various statistical analysis, it is also available enrichment analysis, pathway analysis, machine learning and feature se-lection, metabolite identification, biomarker analysis, among others (Xia et al., 2009, 2012, 2015).
2.7. Web tools to analyse metabolomics data 21
However, some of these analyses may be very limited in terms of methods diversity. For instance, regarding machine learning, it is only possible to perform the PLS-DA, random forests andSVMsalgorithms. Furthermore, classification of new samples using the models created is not available, as well as the impossibility to perform feature selection separately from the model creation, as the model creation from each algorithm has a specific feature selection method associated.
XCMS online is another web tool,https://xcmsonline.scripps.edu/, providing a sim-ple and user friendly web based version of the XCMS software. This tool provides analysis for metabolomics data that come from theGC/LC-MStechnique, such as statistical analysis and data visualization (Tautenhahn et al.,2012).
There are other web tools that provide metabolomics data processing and analysis, and some of them are reviewed in the Table4.
3
D E V E L O P M E N T
In this chapter, the details about the website and its development process will be covered, as well as the technologies used in this process. Furthermore, improvements done to the specmine package, used as the core package for the development of the website, will also be covered.
3.1 specmine package
The specmine package was created for the R environment by the host research group and has functions that allow pre-processing and analysis of metabolomic data from techniques such as GC/LC-MS, NMR, IR and UV-Vis (Costa et al., 2016). This is the package that constitutes the base for the development of the website proposed in this work.
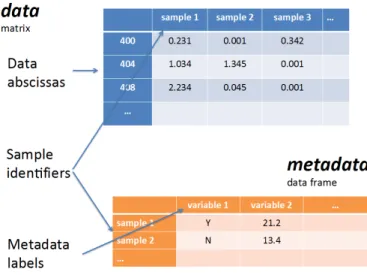
The data that can be processed by this package must have one of these formats: CSV files for NMR andMS peaks lists, CSV or TSV files for metadata files and concentrations files, (J)DX spectra files, and NetCDF, mzDATA or mzXML for MSdata. The dataset then formed is an R list with the following fields: description of the dataset, the data type, data matrix, the metadata data frame and the x and y axis labels, as shown in Figure4.
To processMSspectral data, baseline, offset and background corrections, and peak align-ment are available.
Missing values can be replaced by values that are calculated through K-nearest neigh-bours, linear approximation, mean or median, or that are given by the user. They can also be eliminated by removing the sample or the variable.
Normalization can be achieved by the sum, median, sample reference or feature reference. Four different approaches for scaling are provided: pareto, auto, range and interval scaling. Mean-centering and cubic root or logarithmic transformations can also be done.
Finally, it is possible to remove variables with low variance using flat pattern filters, using methods such as interquantile range, relative standard deviation, standard deviation, median absolute deviation, median and mean. The removal of the low variance variables is achieved through a chosen percentage or a given treshold value. It is also possible to remove specific samples and data and metadata variables, as well as remove samples and
3.1. specmine Package 23
Figure 4: Representation of the data structure in a dataset formed in the specmine package (Costa et al.,2016).
data variables according to the amount of missing values present in the samples or data variables, respectively, or according to the amount of missing values in the metadata.
Metabolite identification was made only available forLC-MS data, using the mait pack-age.
For supervised multivariate analysis, there are functions to train models and predict sam-ples separately, but also one that does these two things. These functions are based on the caret R package. There are many validation methods available, such as k-fold cross valida-tion, leave-one-out cross validavalida-tion, resampling, and others. The error metrics available are
AUC, kappa statistics, and others.
For feature selection, it is possible to perform filter and wrapper selections, separately from the machine learning functions.
There are also functions that allow the execution of univariate analysis, such as t-test, one-way and mutifactor ANOVA, Kruskal-Wallis and Komolgorov-Smirnov tests, fold change analysis, and regression and correlation analysis; and unsupervised multivariate analysis, such as PCA, and clustering analysis.
Finally, there are functions that allow the user to update dataset fields, do various differ-ent plots, among others.
The specmine functions that allow the MS and NMR data pre-processing and analysis listed above and others are present in Table5.
Many were the applications that the specmine package was used for. Cachexia, character-ized by loss of muscle with or without loss of fat mass, is a complex metabolic syndrome. Therefore, the metabolites produced from tissue breakdown may be a good indicator for this disease. The package was used to analyse urine samples, as many end products of
3.1. specmine Package 24
Table 5: Specmine functions that allowMSandNMRdata pre-processing and analysis.
Specmine Function Data Reading
Read folder with peak list files read csvs folder Read metabolite concentrations file read dataset csv ReadMSspectra File read ms spectra
Read metadata File read metadata
Pre-processing spectral data
Baseline, offset and background correction
data correction
Peak alignment group peaks
Smoothing (Savitzky-Golay; bin-ning; and loess)
smoothing interpolation
Other Pre-processing
Missing values missingValues imputation
Normalization normalize
Mean-centering mean centering
Scaling (auto; pareto; and range) scaling Logarithmic and cubic root
trans-formations
transform data
Flat pattern filters flat pattern filter Create subset of a dataset by data
variables interval
subset x values by interval
Remove specific samples, remove samples data or metadata remove data variables
variables remove metadata variables
Remove samples or data remove samples by nas variables according to remove variables by nas ammount of missing values remove samples by na metadata Aggregate samples aggregate samples
MSMetabolite identification MAIT identify metabolites
Machine learning
Train models train models performance
Predict samples predict samples
Train models and predict samples train and predict
Feature selection feature selection
Univariate analysis
T-tests ttests dataset
One-wayANOVA aov all vars
MultifactorANOVA multifactor aov all vars Kruskal-Wallis tests kruskalTest dataset Kolmogorov-Smirnov tests ksTest dataset
Fold change fold change
Regression analysis on one variable line regression onevar Regression analysis on two or more
variables
linreg all vars
Correlation analysis correlations dataset
PCA ClassicalPCA pca analysis dataset
RobustPCA pca robust
Clustering analysis Hierarchical hierarchical clustering