481 Growth and yield of ‘Amarante’ garlic accessions
Caracterização do crescimento e produtividade de acessos de alho ‘Amarante’
Embora seja importante hortaliça condimentar em todo o mundo, existe pouca informação relativa à caracterização do crescimento e produtividade dos acessos de alho ‘Amarante’. O trabalho teve por objetivo avaliar características morfofisiológicas e produtivas de 20 acessos de alho ‘Amarante ‘do Banco de Germoplasma de Hortaliças da Univer-sidade Federal de Viçosa (BGH/UFV). O experimento foi conduzido a campo, no delineamento em blocos ao acaso, com quatro repetições. Durante o ciclo, foram avaliadas as características morfológicas das plantas, intensidade da cor verde, análise de crescimento, índice de colheita e produtividade de bulbos. Os dados obtidos foram submetidos à análise de variância, e as médias agrupadas pelo critério de Skott-Knott e estimado o coeficiente de correlação de Pearson entre características morfofisiológicas e produtividade de bulbo. Os acessos apresentaram comportamento diferencial durante as avaliações. Dentre esses, o BGH 7616 destacou-se por apresentar maiores área foliar, índice de colheita, massas de matéria seca de folhas, pseudocaule, bulbo e da planta inteira, resultando maiores produtividade total e comercial de bulbos. Maiores correlações foram encontradas entre produtividade total e duração de área foliar (r = 0,7263; p < 0,01) no período de 87 a 114 dias após o plantio (DAP) e entre produtividade total e área foliar aos 87 DAP (r = 0,6442; p < 0,01). Dentre todas as características avaliadas, a área foliar aos 87 DAP e a duração da área foliar no período de 87 a 114 DAP, foram as características morfofisiológicas que mais influenciaram a produtividade de bulbos de acessos de alho ‘Amarante’.
Palavras-chave: Allium sativum; análise de crescimento; produtividade.
ABSTRACT
RESUMO
Growth and yield of ‘Amarante’ garlic accessions
1Although it is an important vegetable used as a culinary ingredient around the world, there is little information on the characterization of growth and productivity of garlic cv. ‘Amarante’. The objective of this study was to evaluate the morphophysiological and productive characteristics of 20 accessions of ‘Amarante’ garlic from the Vegetable Germplasm Bank of the Universidade Federal de Viçosa (BGH/UFV). The experiment was conducted in the field, in a randomized complete block design, with four replications. During the garlic cycle, plants were evaluated for morphological characteristics, green color intensity, growth analysis, harvest index, and bulb productivity. Data were subjected to analysis of variance, and the means were grouped by the Skott-Knott criteria. The Pearson correlation coefficient was estimated between morphophysiological characteristics and bulb yield. The accessions presented different behavior during the evaluations. BGH 7616 stood out for showing the greatest leaf area, harvest index, dry mass of leaves, pseudostem, bulb, and whole plant, resulting in the greatest total and commercial bulb yield. The highest correlations were found between total yield and leaf area duration (r = 0.7263; p < 0.01) from 87 to 114 days after planting (DAP) and between total yield and leaf area at 87 DAP (r = 0.6442, p < 0.01). Among the evaluated characteristics, the leaf area at 87 DAP and leaf area duration from 87 to 114 DAP were the morphophysiological characteristics that most influenced the bulb yield in ‘Amarante’ garlic.
Keywords: Allium sativum; growth analysis; yield.
Nelson Licínio Campos de Oliveira2*, Mário Puiatti3, Fernando Luis Finger3, Paulo Cezar Rezende Fontes3,
Paulo Roberto Cecon4, Rodrigo Amato Moreira2
10.1590/0034-737X201865060003
licence Creative Commons
Submetted on March 22nd, 2018 and accepted on October 08th, 2018.
1 This work is part of the first author’s doctoral thesis.
2 Instituto Federal do Norte de Minas Gerais, Januária, Minas Gerais, Brasil. [email protected]; [email protected] 3 Universidade Federal de Viçosa, Departamento de Fitotecnia, Viçosa, Minas Gerais, Brasil. [email protected]; [email protected]; [email protected] 4 Universidade Federal de Viçosa, Departamento de Estatística, Viçosa, Minas Gerais, Brasil. [email protected]
482 Nelson Licínio Campos de Oliveira et al.
Rev. Ceres, Viçosa, v. 65, n.6, p. 481-490, nov/dez, 2018
INTRODUCTION
Garlic (Allium sativum L.) is one of the most important vegetable crops in Brazil. It is used in regional and national cuisine, in which its flavor and condiment properties are highly appreciated (Oliveira et al., 2010; Viana et al., 2016). Despite the increasing supply of garlic in the domestic market, the Brazilian production is insufficient to meet national demand (Resende et al., 2013, Lopes et al., 2016a, b). Brazil is a major consumer and the world’s second largest importer of garlic. In 2015, the Brazilian production was 120,569 t while imports were near 161,760 t (Agrianual, 2017). Garlic average yield in Brazil is 11 t ha-1 (Agrianual, 2017),
and yield increase has been achieved in the last years thanks to the use of cultivars more adapted to planting in several producing regions (Lopes et al., 2016b). Knowledge on ecophysiology of garlic will help crop management decisions, allowing strategies to improve adaptation of plants to climatic conditions (Kim et al., 2013).
Some physiological characteristics such as crop index and leaf area duration have been used as rapid and non-destructive assessment tools in tropical root crops, e.g., in cassava breeding programs (El-Sharkawy, 2006 a, b ). In garlic, cultivar yield has been directly related to the leaf area, the leaf area duration, as well as the pattern of dry matter allocation in plant organs (Marcelis et al., 1998).
In Brazil, two types of garlic are cultivated: the common garlic, which has small bulbs with many small bulbils of low commercial value, and the noble garlic, which has large bulbs with few bulbils and high commercial value (Rezende et al., 2013, Albuquerque et al., 2017). Common garlic cultivars require a lower level of technology and are cultivated by family farming, while the noble garlic cultivars are cultivated in high-technology farms.
Cultivar ‘Amarante’ is classified as “semi-noble” because presents medium-size bulbils, in number of 8 to 12 per bulb, similar to the noble garlic cultivars, but does not have large bulbs. It presents medium cycle, with purple bulbils, rare pseudostem, and intermediate requirement of cold temperature and long day length for bulbification (Albuquerque et al., 2017). It is not as demanding in terms of cropping technology as the noble garlic, but reaches higher marketing values than the common types. For these reasons, it has been cultivated in southeastern Brazil, where ecotypes have been given diverse denominations creating a group called Amarante.
Despite the importance and worldwide garlic farming, studies on the physiological determinants of crop yield are scarce. These evaluations are important because they make it possible to understand the physiological interactions of each plant material with the edaphoclimatic conditions of the region and explain the possible differences in bulb yield.
From the foregoing, therefore, the objective of this study was to evaluate the morphophysiological characteristics determinant of bulb yield in 20 accessions of ‘Amarante’ garlic from the BGH/UFV.
MATERIAL AND METHODS
The experiment was conducted in the vegetable expe-rimental field of the Departmento de Fitotecnia (Plant Science Department) of the Universidade Federal de Vi-çosa (UFV), from April to September 2008. ViVi-çosa, Minas Gerais, Brazil, is located at 20°45’S, 42°51’W and 651 m altitude. During this period, the minimum, average, and maximum temperatures were 5.7 °C; 18.0 °C and 33.2 °C, respectively, and the minimum, average, and maximum air relative humidity were 51%; 81%; and 95%, respectively. The minimum photoperiod was 10.85 hours and the maximum 11.96 hours.
The experiment consisted of 20 treatments, correspon-ding to the 20 accessions of ‘Amarante’ garlic from the Vegetable Germplasm Bank of UFV (BGH/UFV) (Table 1). The experiment was arranged in a randomized block design, with four replications. The experimental unit of 2.0 m2 consisted of a plot with four rows of 2.0 m in length,
spaced 0.25 m apart, and plants at each 0.10 m.
Plant beds followed an east-west arrangement. At 60 days before planting, the soil was amended with 2.6 t ha -1 of dolomitic limestone, PRNT 80%. The soil was classified
as Cambic Red-Yellow Argisol, with the following chemical and physical characteristics: pH in water (1: 2,5) = 5.8; P = 220 mg dm-3; P-rem = 30 mg L-1; K = 160 mg dm-3; Ca+2 =
6.4; Mg+2 = 1.1, Al+3 = 0.4; H + Al = 6.44; SB = 7.91; CTC (t)
= 7.91 and CTC (T) = 14.35 cmolc dm-3; V = 55%; m = 0%;
OM = 2.8 dag kg-1; Zn = 56; Fe = 112; Mn = 8; Cu = 2 eB =
2mg dm-3; clay = 30%; silt = 13%; coarse sand = 25%; fine
sand = 32%; textural classification = sandy clay frank. Fertilization at planting consisted of 28.26 t ha-1 of
cattle manure (dry matter) and the following rates (kg ha -1) and sources of macro and micronutrients: 120 kg of
ammonium sulphate; 833 kg of single superphosphate; 21.0 kg of potassium chloride; 3.0 kg of zinc sulfate; 5.0 kg borax; 5.0 kg copper sulphate; and 250 g sodium molybdate. At 50 and 100 days after planting, 140 kg ha-1 of ammonium
sulfate and 24 kg ha-1 of potassium chloride were applied.
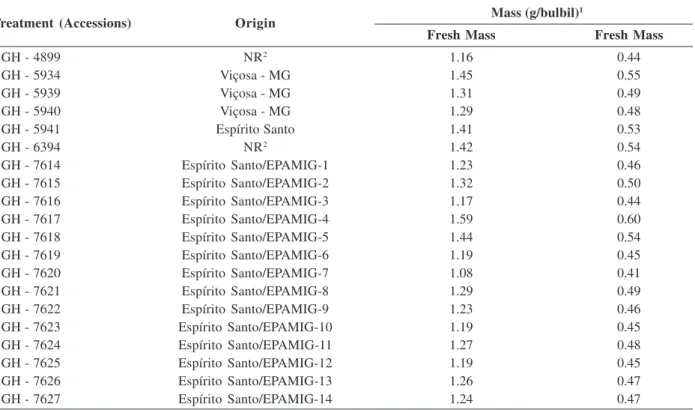
Planting was carried out on 08/04/2008 using bulbils retained by an 8x17 mm mesh- sieve (3) and fresh mass varying from 1.08 to 1.59 g (Table 1). Bulbil samples of all accessions, at planting, had dormancy breaking index (IVD) above 90%. The bulbils were hand-planted, with apex facing upwards, and covered with about 1.5 cm of soil.
out by microsprinkling managed for all stages of crop development and interrupted at 20 days before harvest.
In order to do the morphophysiological evaluations, the crop cycle was divided into four phases. The first phase, from 59 to 87 days after planting (DAP), corresponding to the stage of axillary bulb differentiation; the second phase, from 87 to 114 DAP, corresponding to the end of bulb differentiation and beginning of bulb filling; the 3rd phase, from 114 to 136 DAP, corresponding
to the stage of bulb filling; and 4th phase, from 136 to 156
DAP, finishing with the end of bulb filling, leaf senescence, and maturation.
Leaf green intensity (SPAD), leaf number (LN), leaf area (LA), and leaf dry mass (LDM), pseudostem (PDM), bulb (BDM), roots (RDM), and whole plant (WPDM) were evaluated at 59, 87, 114, 136, and 156 DAP. Plant relative growth rate (PRGR), bulb growth rate (BGR), plant net assimilation rate (PNAR), and ), bulb net assimilation rate (BNAR), leaf area ratio (LAR), bulb area ratio (BAR), and leaf area duration (LAD) were calculated for the periods 59 to 87; 87 to 114; 114 to 136; and 136 to 156 DAP. At 156 DAP, data that generated the harvest index and the total and commercial bulb yields were collected.
Leaf green intensity (SPAD) was performed in two competing plants on the 3rd expanded leaf (newly mature
leaves), from the apex to the base of the plant from 7 to 10 hours using a portable chlorophyll meter (MINOLTA CHLOROPHYLL METER SPAD - 502). Two measurements
were recorded on each leaf, one in the middle and another about 2/3 of its length, and the average was used.
The measurements for growth analysis were performed in two competing plants randomly chosen in the harvest area. Leaf number (LN NFP) was obtained by counting all the leaves in the plant with a minimum size of 50 mm in length. Leaf area (AF) expressed as dm2/plant was obtained
by reading all leaves in a LICOR leaf area integrator (Model 3100 Area Meter®).
Dry masses of different plant parts were obtained after drying the material at 65 °C in an oven with forced ventilation to constant mass. Growth analysis was performed by calculating the following indices: plant relative growth rate - PRGR = (ln PL2 - ln PL1)/(t2 - t1) as (g g-1 tIME-1); bulb growth rate - BGR = (ln PBP
2- ln PBP1)/(t2
- t1 ) as (g g-1 time-1); plant net assimilation rate - PNAR =
(PL2 - PL1/t2 - t1) x (ln A2 - ln A1/A2 - A1); and bulb net assimilation rate - BNAR = (PB2 - PB1/t2 - t1) x (ln A2 - ln A1/ A2 - A1); leaf area ratio - LAR = [(A1/PF1) + (A2/PF2)]/2 as (dm2 g-1); and bulb area ratio - BAR = [(A
1 / PB1) + (A2 /
PB2)] / 2 as (dm2 g-1); leaf area duration - LAD = [(A 1 + A2)
x ( t2 – t1)] / 2; harvest index HI = BDM / TotalDM, where: ln = natural logarithm; PW2 = plant weight at time 2 and PW1 = plant weight at time 1; t2 = time 2 and t1 = time 1; BW2 = bulb weight at time 2 and BWP1 = bulb weight at time 1; A2 = plant leaf area time 2 and A1 = plant leaf area time 1; LW2 = plant leaf weight at time 2 and LW1 = plant leaf weight at time 1;
Table 1: Treatment (accessions), origin, fresh and dry masses of bulbil samples of ‘Amarante’ garlic accessions from the Vegetable Germplasm Bank - UFV
Mass (g/bulbil)1
Fresh Mass Fresh Mass
BGH - 4899 NR2 1.16 0.44
BGH - 5934 Viçosa - MG 1.45 0.55
BGH - 5939 Viçosa - MG 1.31 0.49
BGH - 5940 Viçosa - MG 1.29 0.48
BGH - 5941 Espírito Santo 1.41 0.53
BGH - 6394 NR2 1.42 0.54
BGH - 7614 Espírito Santo/EPAMIG-1 1.23 0.46
BGH - 7615 Espírito Santo/EPAMIG-2 1.32 0.50
BGH - 7616 Espírito Santo/EPAMIG-3 1.17 0.44
BGH - 7617 Espírito Santo/EPAMIG-4 1.59 0.60
BGH - 7618 Espírito Santo/EPAMIG-5 1.44 0.54
BGH - 7619 Espírito Santo/EPAMIG-6 1.19 0.45
BGH - 7620 Espírito Santo/EPAMIG-7 1.08 0.41
BGH - 7621 Espírito Santo/EPAMIG-8 1.29 0.49
BGH - 7622 Espírito Santo/EPAMIG-9 1.23 0.46
BGH - 7623 Espírito Santo/EPAMIG-10 1.19 0.45
BGH - 7624 Espírito Santo/EPAMIG-11 1.27 0.48
BGH - 7625 Espírito Santo/EPAMIG-12 1.19 0.45
BGH - 7626 Espírito Santo/EPAMIG-13 1.26 0.47
BGH - 7627 Espírito Santo/EPAMIG-14 1.24 0.47
1 Bulbils retained by sieve 3; 2NR - Origin not identified in the passport data.
484 Nelson Licínio Campos de Oliveira et al.
Rev. Ceres, Viçosa, v. 65, n.6, p. 481-490, nov/dez, 2018 At 156 days after planting (13/09/2008), with plants showing 2/3 of senescent leaves, all the accessions were harvested. After harvesting, the plants were pre-cured in the field for two days and taken to a drying shed to com-plete the curing process for seven days. Once the garlic was dried and fully cured, the senescent leaves were trimmed off and the bulbs were classified based on the diameter, according to Ordinance No. 242 of of the Brazilian Ministry of Agriculture – MAPA - 17/9/1992, as follows: class 7 = extra large (> 56 mm); class 6 = large (48-56 mm); class 5 = medium (43-47 mm); class 4 = small (38-42 mm); class 3 = very small (32-37 mm), and discards (< 32-37 m), and their respective masses (g) were obtained.
Total production included all harvested bulbs and commercial production included bulbs that fit into clas-ses 3 to 7. The yield (t ha-1) was estimated with a plant
population in 8,000 m2.
Data were subjected to analysis of variance and the means of accessions were grouped by the Scott-Knott criterion at 5% of probability level. The association between total bulb yield and morphophysiological quantitative variables was estimated by the Pearson correlation coefficient, which were tested using Student’s t-test at 5% probability level.
RESULTS AND DISCUSSION
There was difference between accessions for total (TY) and commercial (CY) bulb yields in the harvest at 156 DAP. The accessions BGH 5934, 5939, 6394, 7614, 7616, 7617, 7618, 7620, 7621, and 7623 stood out with the highest yields (Table 2). There was a significant and positive correlation between CY and TY (r = 0.9971; p < 0.01), indicating that accessions with higher TY also had higher CY. Considering that the same number of plants were collected per unit area for all accessions, higher TY and CY indicate bulbs with higher fresh mass, an important characteristic since these reach better market prices.
The results of total yield of cv. Amarante found in this study agree with those found by Silva et al. (2000), which was 10.86 t/ha, but were well above 2.5 t/ha found by Resende et al. (2013), which demonstrate the need to understand the ecophysiological aspects of the crop, as discussed below.
1st PHASE - 59 to 87 DAP: differentiation of
axillary bulbs
The evaluation carried out at 59 DAP, corresponding to the beginning of the bulb differentiation phase, found no difference between the accessions for LN, BDM, and RDM. The results for these characteristics varied from 4.75 to 5.87 ud/plant, 0.12 to 0.27, and 0.10 to 0.20 g/plant,
respectively. However, differences were found between the accessions for LA, LDM, PDM, and WPDM (Table 3). In this phase, the accessions BGH 5934, 7616, 7617, 7621, and 7623 showed the highest values for LA, LDM, PDM, and WPDM, and the accessions BGH 5939 and 6394 for LA, LDM, and WPDM, characterizing larger plant size and larger photosynthetic area in relation to other accessions.
The accessions BGH 7614, 7618, and 7620 were grouped with the accessions with the highest TY and CY (Table 2); however, in this phase, they were inferior to the other accessions for the characteristics LA, LDM, PDM, and WPDM (Table 3). These accessions did not express morphological features that led them to higher yields at the end of the cycle, although these characteristics (LA, LDM, PDM, and WPDM) presented a significant and positive correlation with TY (r = 0.5320, 0.5498, 0.2629, and 0.5180, respectively, p < 0.01).
The fact that accessions BGH 5934, 5939, 6394, 7616, 7617, 7621, and 7623 have higher LA, LDM, and WPDM, positively correlated with TY, indicates that these accessions had already shown great potential for bulb production at the beginning of the cycle.
In this phase (59 DAP), differences between the accessions were found for the SPAD index (Table 2). Accessions BGH 5934, 6394, 7616, 7617, 7621, and 7623 showed the lowest values, with SPAD indices ranging from 59.05 to 60.51, although they had the highest values of LA, LDM, and WPDM (Table 3). In contrast, BGH 7620 showed a high SPAD index (61.78), but with lower LA and LDM (Table 3), indicating a higher chlorophyll content per leaf blade unit. The correlation between SPAD and TY was negative and significant (r = -0.2085; p < 0.05), indicating that lower SPAD values are related to higher total yields (TY).
There was positive correlation of LA, LDM, and WPDM with TY (r = 0.5320, 0.5498 and 0.5180, respectively, p < 0.01). Although with higher LA, LDM, and WPDM, the accessions BGH 5934, 6394, 7616, 7617, 7621, and 7623 had lower SPAD indices. This shows an effect of N dilution on the leaf blade, because of the greater LA growth, the N is redistributed throughout the mass (Backes et al., 2010), which is confirmed by the negative correlation between SPAD and TY.
In the period between 59 and 87 DAP, no difference was found between the accessions for PRGR, BGR, PNAR, BNAR, and BAR. The variations for these characteristics were respectively: 0.15 to 0.31 g g-1 week -1; 0.01 to 0.39 g g-1 week-1; 0.23 to 0.46 g dm-2 week-1; 0.02
to 0.05 dm-2 week-1, and 5.01 to 5.12 dm-2 g-1. However,
485
Growth and yield of ‘Amarante’ garlic accessions
Rev
. Ceres,
V
içosa, v
. 65, n.6, p. 481-490, nov/dez, 2018
Accession HI TYt ha-1 CYt ha-1
accessions from the Vegetable Germplasm Bank - UFV
SPAD LAR LAD PRGR
(unit) (dm2 g -1) (dm2 week -1) (g g-1 week-1)
59 87 114 59 to 87 114 to 136 136 to 156 59 to 87 87 to 114 114 to 136 114 to 136 156 156 156 BGH 4899 64.62 a 54.71 a 60.61 b 0.61 b 0.29 a 0.148 a 306.27 c 489.10 d 462.06 b 0.19 a 0.72 a 8.44 c 8.37 c BGH 5934 59.27 b 51.15 b 60.30 b 0.66 b 0.26 b 0.130 b 516.34 b 808.76 b 656.06 a 0.12 b 0.67 b 11.09 a 11.02 a BGH 5939 63.58 a 52.81 a 62.48 a 0.74 a 0.30 a 0.160 a 484.53 b 713.09 c 604.15 a 0.13 b 0.67 b 11.35 a 11.35 a BGH 5940 60.45 b 52.73 a 58.86 b 0.66 b 0.28 b 0.150 a 368.47 c 608.60 c 560.55 b 0.16 a 0.66 b 9.36 b 9.07 b BGH 5941 62.77 a 54.47 a 66.97 a 0.67 b 0.26 b 0.120 b 401.41 c 649.72 c 502.78 b 0.12 b 0.67 b 9.52 b 9.48 b BGH 6394 60.51 b 55.00 a 60.33 b 0.68 b 0.30 a 0.150 a 495.54 b 857.25 b 655.88 a 0.05 b 0.64 b 10.74 a 10.70 a BGH 7614 58.73 b 49.65 b 59.41 b 0.67 b 0.32 a 0.120 b 358.13 c 633.35 c 552.45 b 0.23 a 0.71 a 10.25 a 10.16 a BGH 7615 61.83 a 52.21 b 58.13 b 0.62 b 0.26 b 0.130 b 375.77 c 607.85 c 549.58 b 0.17 a 0.62 b 9.73 b 9.50 b BGH 7616 59.91 b 50.08 b 58.75 b 0.67 b 0.25 b 0.120 b 668.97 a 1054.14 a 749.71 a 0.05 b 0.72 a 12.49 a 12.49 a BGH 7617 60.10 b 50.11 b 58.83 b 0.72 a 0.27 b 0.120 b 551.58 b 868.58 b 688.81 a 0.13 b 0.64 b 10.79 a 10.70 a BGH 7618 58.67 b 48.83 b 58.15 b 0.71 a 0.31 a 0.150 a 505.71 b 779.79 b 614.60 a 0.17 a 0.63 b 10.14 a 10.08 a BGH 7619 61.32 a 56.62 a 63.98 a 0.60 b 0.28 b 0.141 b 261.81 c 428.84 d 386.96 b 0.19 a 0.67 b 7.00 c 6.61 d BGH 7620 61.78 a 50.90 b 59.25 b 0.62 b 0.30 a 0.141 b 450.20 b 790.07 b 611.35 a 0.13 b 0.66 b 10.74 a 10.66 a BGH 7621 59.86 b 49.96 b 59.78 b 0.67 b 0.29 a 0.150 a 532.36 b 790.60 b 613.01 a 0.18 a 0.61 b 9.98 a 9.80 a BGH 7622 62.08 a 49.80 b 58.10 b 0.66 b 0.31 a 0.150 a 485.50 b 733.22 b 613.47 a 0.20 a 0.69 a 9.43 b 9.21 b BGH 7623 59.05 b 51.12 b 57.01 b 0.75 a 0.31 a 0.146 a 526.46 b 904.10 b 700.16 a 0.02 b 0.66 b 10.73 a 10.62 a BGH 7624 62.33 a 53.32 a 62.76 a 0.66 b 0.26 b 0.140 b 381.75 c 576.80 c 519.28 b 0.22 a 0.68 a 8.41 c 8.28 c BGH 7625 60.65 b 53.90 a 58.35 b 0.62 b 0.36 a 0.170 a 296.52 c 534.78 d 469.88 b 0.20 a 0.65 b 8.01 c 7.90 c BGH 7626 61.75 a 50.63 b 56.41 b 0.70 a 0.32 a 0.150 a 395.18 c 675.69 c 607.21 a 0.20 a 0.63 b 8.67 c 8.42 c BGH 7627 61.25 a 51.53 b 59.28 b 0.72 a 0.32 a 0.150 a 326.21 c 641.07 c 652.23 a 0.20 a 0.66 b 9.13 b 9.00 b
CV (%) 3.24 4.11 5.65 8.81 11.20 13.34 18.48 14.84 16.95 54.87 5.22 9.55 10.31
486 Nelson Licínio Campos de Oliveira et al.
Rev. Ceres, Viçosa, v. 65, n.6, p. 481-490, nov/dez, 2018
2nd PHASE - 87 to 114 DAP: end of bulb differentiation and beginning of bulb filling
In this phase, no difference was found between the accessions for RDM, which ranged from 0.12 to 0.35 g/ plant, but there were differences for the SPAD index (Table 2), LN, LA, LDM, PDM, BDM, and WPDM (Table 3). The accession BGH 7616 stood out for the characteristics LN, LA, LDM, PDM, BDM, and WPDM; the accessions BGH 5934, 6394, 7618, 762, and 7622 stood out for LN and BDM; accessions BGH 7614 and 5939 had the lowest LN, LA, LDM, PDM, BDM, and WPDM; accessions BGH 7617, 7620, and 7623 had the largest LN and the smallest LA, LDM, and PDM. The morphological characteristics LN, LA, LDM, PDM, BDM, and WPDM were positively correlated with TY (r = 0.4058, 0.6442, 0.6100, 0.5811, 0.4188. and 0.6309, respectively, p < 0.01).
The accessions BGH 5934, 6394, 7618, and 7621 showed the highest LN and BDM and BGH 7617, 7620, and 7623 the highest LN. All these characteristics also presented significant and positive correlation with TY. By the end of bulb differentiation, the accession BGH 7616 continued to keep high values for the characteristics LN, LA, LDM, PDM, BDM, and WPDM, which correlated significantly and positively with TY.
The highest SPAD indices were recorded for the accessions BGH 4899, 5939, 5940, 5941, 6394, 7619, 7624, and 7625 (Table 2). The SPAD index showed the same behavior as in the 1st phase, where plants with the lowest vegetative growth had the highest readings (concen-tration effect). The correlation between SPAD and TY was negative (r = -0.4089; p < 0.01), demonstrating that lower SPAD values are related to higher TY. Again, BGH 7616 had lower SPAD, despite a higher LA, while the accessions BGH 5939 and 6394 had higher SPAD and lower LA. The accessions BGH 5934, 7614, 7616, 7617, 7618, 7620, 7621, and 7623, belonging to the most productive group, had the lowest SPAD. This type of response demonstrates the effect of chlorophyll dilution in the leaf blade due to the higher growth rate. Among the characteristics, the accessions BGH 5934, 6394, 7618, and 7621 had the highest LN and LDM and BGH 7617, 7620, and 7623 the highest LN; all these characteristics showed significant and positive correlation with TY.
Accessions BGH 5939, 7617, and 7623, specifically in this evaluation, had the lowest LA, LDM, PDM, BDM, and WPDM. It was found that the accession BGH 7614, until this evaluation, had not presented morphological characteristics in terms of shoot dry mass to explain its clustering in the group of the highest bulb yields. In this phase, BGH 7618 and 7620 had already shown morphological characteristics such as LN and BDM with positive and significant correlation with TY.
The access BGH 7616 showed the greatest leaf area duration (LAD) and, therefore, it was able to perform the greatest photosynthetic activity because of the largest leaf area over time. LAD also showed positive correlation with TY (r = 0.6789; p < 0.01), evidencing a possible reason for the bulb potential of this accession. According to Richards (2000), crop growth duration and solar radiation interception are the two components that contributed the most to biomass increase and total photosynthesis and, consequently, the crop yield.
Between 87 and 114 DAP, there was no difference between the accessions for PRGR, BGR, PNAR, BNAR, LAR and BAR. Values varied, respectively, from: 0.15 to 0.31 g g-1 week-1; 0.28 to 0.61 g g-1 week-1; 0.29 to 0.56 g dm -2 week-1; from 0.08 to 0.17 dm-2 week-1; from 0.52 to 0.66 dm -2 g-1, and from 3.44 to 8.55 dm-2 g-1. In this period, LAD of
accession BGH 7616 stood out from the others and the correlation between LAD and TY was 0.7263 (p < 0.01), which was the greatest correlation over all growth stages. However, the other characteristics of growth index did not correlate with TY; thus, LAD proves to be a funda-mental characteristic for the production of plant dry mass.
3rd PHASE - 114 to 136 DAP: bulb filling
In this phase, there was no significant difference between the accessions for LN and RDM, which varied from 9.75 to 11.50 ud/plant and 0.10 to 0.75 g/plant, respectively. However, differences were observed between accessions for LA, LDM, PDM, BDM and WPDM (Table 3). The accession BGH 7616 again stood out for the characteristics LA, LDM, PDM, BDM and WPDM, providing larger plant size, photosynthetic area, and bulb mass. The accessions BGH 5934, 6394, 7617, and 7623 had the highest LA, LDM and PDM and BGH 7620 the highest LA and LDM, indicating greater photosynthetic area.
In this evaluation, the characteristics LA, LDM, PDM, BDM and WPDM showed significant and positive correlation with TY (r = 0.6654, 0.6082, 0.5736, 0.3966, and 0.6146, respectively; p < 0.01), although the accessions BGH 5939, 7614, 7618, and 7621 are clustered into the group of accessions with the lowest values for these characte-ristics. BGH 7614 showed the lowest LA, LDM, PDM, BDM and WPDM, indicating that until the beginning of bulb filling (114 DAP), it had not presented morphological characteristics to explain its clustering in the group of the highest TY and CY. On the other hand, in this evaluation, the accessions BGH 7618 and 7620 showed morphological characteristics with a significant and positive correlation that justified the participation in the group of accessions with the highest TY and CY.
487
Growth and yield of ‘Amarante’ garlic accessions
Rev
. Ceres,
V
içosa, v
. 65, n.6, p. 481-490, nov/dez, 2018
Accession LN LA LDM BDM PDM WPDM
(ud) (dm2pl-1) (g plant-1) (g plant-1) (g plant-1) (g plant-1)
87 59 87 114 59 87 114 87 114 156 59 87 114 156 59 87 114 156
BGH 4899 7.50 b 0.72 b 2.39 c 2.77 c 0.85 b 2.17 c 3.25 b 0.47 b 2.35 c 10.10 b 0.27 b 0.57 c 2.00 b 1.50 b 1.42 b 3.42 c 7.70 c 13.87 b BGH 5934 8.00 a 1.28 a 3.98 b 4.56 a 1.32 a 3.42 b 5.42 a 0.72 a 3.82 b 13.22 a 0.37 a 1.17 b 4.37 a 3.22 a 2.05 a 5.60 b 13.95 b 19.75 a BGH 5939 7.75 a 1.40 a 3.54 b 4.00 b 1.42 a 2.82 b 4.37 b 0.52 b 2.72 c 14.67 a 0.32 b 0.75 c 3.27 b 3.27 a 2.12 a 4.35 c 10.60 c 21.55 a BGH 5940 7.25 b 0.90 b 2.85 c 3.58 b 1.05 b 2.27 c 3.75 b 0.32 b 3.12 b 13.30 a 0.35 b 0.55 c 3.32 b 3.22 a 1.85 a 3.35 c 10.47 c 19.92 a BGH 5941 8.00 a 0.91 b 3.18 c 3.69 b 1.00 b 2.52 c 4.17 b 0.55 b 3.30 b 11.02 b 0.32 b 0.75 c 3.02 b 2.82 a 1.67 b 4.05 c 10.77 c 16.27 b BGH 6394 8.25 a 1.09 a 3.96 b 5.11 a 1.17 a 3.15 b 5.35 a 0.70 a 3.30 b 13.12 a 0.35 b 0.90 c 4.20 a 3.67 a 1.90 a 5.10 b 13.15 b 20.35 a BGH 7614 7.00 b 0.83 b 2.81 c 3.88 b 0.95 b 2.22 c 3.57 b 0.52 b 2.10 c 16.20 a 0.32 b 0.65 c 2.75 b 3.00 a 1.55 b 3.60 c 8.70 c 22.57 a BGH 7615 7.00 b 1.03 b 2.80 c 3.62 b 1.20 a 2.30 c 3.92 b 0.42 b 2.57 c 10.30b 0.47 a 0.77 c 3.52 b 3.22 a 2.05 a 3.70 c 10.42 c 16.30 b BGH 7616 9.00 a 1.32 a 5.49 a 5.65 a 1.32 a 4.65 a 5.87 a 0.97 a 5.32 a 19.47 a 0.42 a 1.62 a 5.77 a 3.45 a 2.15 a 7.57 a 17.72 a 26.92 a BGH 7617 8.00 a 1.43 a 4.19 b 4.99 a 1.50 a 3.22 b 4.97 a 0.47 b 3.55 b 14.32 a 0.42 a 1.17 b 5.15 a 4.10 a 2.25 a 5.22 b 14.07 b 22.17 a BGH 7618 8.00 a 0.98 b 4.17 b 4.07 b 1.00 b 3.42 b 4.10 b 0.62 a 2.25 c 12.30 b 0.30 b 1.02 b 3.37 b 3.80 a 1.65 b 5.37 b 10.02 c 19.47 a BGH 7619 7.00 b 0.56 b 2.10 c 2.43 c 0.62 b 1.87 c 2.82 b 0.40 b 1.77 c 8.47 b 0.22 b 0.60 c 2.00 b 1.95 b 1.15 b 3.05 c 6.80 c 12.57 b BGH 7620 8.00 a 0.82 b 3.77 b 4.59 a 1.00 b 2.95 b 4.67 a 0.57 b 2.70 c 13.65 a 0.35 b 1.02 b 3.42 b 3.35 a 1.72 b 4.85 b 11.07 c 20.47 a BGH 7621 8.25 a 1.17 a 4.26 b 4.10 b 1.22 a 3.37 b 4.10 b 0.77 a 2.92 c 11.77 b 0.42 a 1.25 b 3.75 b 4.15 a 1.97 a 5.62 b 10.92 c 19.25 a BGH 7622 8.00 a 0.90 b 4.04 b 3.71 b 0.95 b 3.15 b 3.75 b 0.77 a 2.27 c 13.10 a 0.32 b 1.10 b 3.05 b 3.05 a 1.62 b 5.25 b 9.32 c 19.05 a BGH 7623 7.75 a 1.50 a 3.86 b 5.70 a 1.45 a 3.10 b 5.67 a 0.35 b 2.97 c 12.40 b 0.40 a 0.97 b 5.20 a 3.37 a 2.20 a 4.65 b 14.20 b 18.52 a BGH 7624 7.50 b 0.89 b 2.99 c 3.10 c 1.02 b 2.47 c 3.40 b 0.40 b 2.80 c 14.70 a 0.32 b 0.75 c 2.90 b 3.35 a 1.72 b 3.82 c 9.22 c 21.40 a BGH 7625 7.25 b 0.69 b 2.33 c 3.32 c 0.87 b 1.97 c 2.95 b 0.42 b 1.55 c 9.80 b 0.22 b 0.50 c 2.20 b 2.67 a 1.45 b 3.02 c 6.80 c 14.95 b BGH 7626 7.50 b 0.89 b 3.13 c 4.01 b 0.95 b 2.42 c 3.85 b 0.40 b 2.30 c 11.87 b 0.27 b 0.67 c 3.05 b 3.35 a 1.52 b 3.80 c 9.57 c 18.65 a BGH 7627 6.75 b 0.76 b 2.56 c 4.21 b 0.87 b 1.87 c 3.97 b 0.27 b 2.27 c 11.80 b 0.22 b 0.57 c 3.40 b 3.12 a 1.37 b 2.87 c 10.00 c 17.85 a CV (%) 10.06 25.33 20.57 18.60 23.36 20.67 21.44 46.13 34.47 22.56 27.63 30.47 27.12 25.72 19.97 21.70 20.45 22.10
488 Nelson Licínio Campos de Oliveira et al.
Rev. Ceres, Viçosa, v. 65, n.6, p. 481-490, nov/dez, 2018 highest LA, LDM, and TY. BGH 5939 had high SPAD index, but low LA. Muro et al. (2000) argued that during the crop cycle, LA is very important for garlic, because the reduction in the bulb yield was proportional to the reduction in leaf area imposed at the beginning of bulb formation.
In this phase, it was also verified a negative correlation between SPAD and TY (r = -0.2389; p < 0.01) and no difference was found between the accessions for LN, LA, LDM, BDM, RDM, and WPDM. These characteristics varied from 11.50 to 13.25 ud/plant; 2.59 to 4.25 dm2/plant;
3.05 to 4.82 g/plant; 6.30 to 10.25 g/plant; 0.40 to 0.65 g/ plant, and 12.90 to 21.22 g/plant, respectively.
The highest PDM values were obtained for the accessions BGH 5934, 5939, 5914, 7614, 7615, 7616, 7617, 7618, 7621, 7622, 7623, 7624, 7626, and 7627, ranging from 4.25 to 5.77 g/plant. In this phase, only this morphological characteristic showed significant difference between accessions. BGH 5939, 7616, 7617, 7621, 7634, 7618, 7614, and 7623 with the highest PDM values also had the highest TY and positive correlation with TY (r = 0.4635; p < 0.01). These results show the importance of PDM and demonstrate that plants accumulate photoassimilates in the pseudostem for later translocation to the bulb, as noted by Haque et al. (2002).
In the period between 114 and 136 DAP, there was no difference between the accessions for BGR, PNAR, BNAR, and LAR, with values ranging, respectively, from 0.19 to 0.45 g g-1 week-1; 0.08 to 0.86 g dm-2 week-1; 0.25 to 0.59 dm -2 week-1, and 0.73 to 1.28 dm-2 g-1. However, there were
differences between accessions for PRGR, LAR, and LAD (Table 2). Among the characteristics evaluated, in this phase, the correlations between LAD and PRGR with TY were, respectively, 0.6188 (p < 0.01) and -0.2184 (p < 0.05). The significant and negative correlation of PRGR with TY indicates the lower growth rate of the plant with the increase in the translocation of photoassimilates from shoot to bulb.
BGH 7614 showed the highest PRGR and LAR, which justifies its clustering into the group with the highest bulb yields (TY and CY), since in the two previous phases, it showed significantly lower values of LA, LDM and PDM. The accessions BGH 5934, 7616, and 7617 had the highest LAD; BGH 7618 and 7621 had the highest PRGR, LAR, and LAD; BGH 5939, 6394, 7620, and 7623 had the highest LAR and LAD. Except for BGH 7614, all other accessions had already presented, in previous phases, characteristics that expressed greater leafing intensity.
At the end of the first phase of bulb filling 136 (DAP), there was no significant difference between the accessions for LN, LA, LDM, BDM, RDM, WPDM, SPAD, and LAD. Accessions BGH 5934, 5939, 7614, 7616, 7617, 7618, 7621, and 7623 had the highest PDM and BGH 6394 and 7620 had the lowest PDM.
4th PHASE - 136 to 156 DAP: end of bulb filling
and maturation
In this phase, no difference was found between the accessions for LN, LA, LDM, RDM, and SPAD. These characteristics varied, respectively, from 11.00 to 12.50 ud/plant; 0.90 to 2.03 dm2/plant; 1.82 to 3.60 g/plant; 0.20
to 0.47 g/plant; and 58.25 to 64.97 g/plant. Difference between accessions were found for the characteristics PDM, WPDM, BDM and HI, with the highest values highlighted in Tables 2 and 3.
LDM, PDM, WPDM, and BDM showed positive correlation with TY (r = 0.4165, 0.4845, 0.5575, and 0.5308, respectively, p < 0.01). Therefore, accessions that had higher PDM and WPDM showed higher TY and CY, indicating that the accumulation of dry mass in the pseudostem and in the whole plant are important for the final bulb production.
At the end of this evaluation (156 DAP), no difference was found between the accessions for PRGR, BGR, PNAR, BNAR, BAR and LAD. These characteristics varied, respectively, from: 0.04 to 0.09 g g-1 week-1; 0.07 to 0.25 g -1 week-1; 0.25 to 0.76 dm-2 week-1; 0.09 to 0.57 dm-2 week-1;
0.22 to 0.36 dm-2 g-1 and 254.52 to 410.26 dm2 week-1.
Accessions BGH 5939, 6394, 7614, 7618, 7621, and 7623 maintained high RAFP values, as in the period from 114 to 136 DAP. Among the growth index characteristics, LAD showed positive correlation only with TY (r = 0.4297; p < 0.01). At the end of the bulb filling, the accessions BGH 5934, 5939, 6394, 7614, 7616, 7617, 7618, 7620, 762, and 7623 had morphological characteristics that resulted in higher TY.
The evaluations carried out during the crop cycle showed that the accessions with the highest bulb yields (TY and CY) behaved differently over the four phases. At the end of the bulb filling phase (136 DAP), PDM was the only morphological characteristic that showed a significant difference between the accessions, indicating the importance of the accumulation of photoassimilates in the pseudostem for later translocation to the bulbils.
The leaf area should be photosynthetically active. The green leaf intensity assessed by the SPAD index has been used as an indirect measure of the relative chlorophyll content (Pôrto et al., 2011).
In the nutritional aspect, the adequate nutrient supply to the plant is directly related to the concentration of this nutrient in the tissue. However, in the present work, the correlation between SPAD and TY was negative in the two initial phases and no correlation was found in the others. There is a situation in which applying a certain nutrient promotes an increase in the dry matter of the plant; however, after analyzing the concentration of this element in some or all of the plant tissues, it is lower than that of the control. What occurs is that there is increase of the element in the total accumulation, an increase in yield, but decrease of the concentration in the tissue, indicating that the plant growth was faster than the nutrient accumulation, which may have occurred in relation to the lowest SPAD in more productive garlic accessions. On the other hand, LAD was fundamental for the accessions that achieved the highest bulb yields, in all cycle phases, with the greatest importance for the second phase, from 87 to 114 DAP. The highest LAD value indicates the largest total photosynthetic area of the plant for the longest time, consequently the greatest potential to produce photoassimilates.
Stahlschmidt & Cavagnaro (1997) pointed out that yield of a garlic cultivar is directly related to the leaf area grown by the plant, the leaf area duration, and the dry mass allocation pattern in the plant organs. In the accessions evaluated, besides LA and LAD, the importance of the pseudostem dry mass at the end of the bulb filling stage (136 DAP) is also confirmed.
In this study, the accessions were not significantly different in relation to the physiological components PNAR and BNAR, in all phases evaluated. Therefore, the increase in dry mass of bulbs at the harvest of accessions that had the highest yields is explained by the translocation of photoassimilates and not by the greatest BNAR.
CONCLUSIONS
The 20 accessions of ‘Amarante’ garlic showed different morphophysiological characteristics.
The accession BGH 7616 stood out for the highest values of leaf area, leaf area duration, and dry mass of leaf, bulb, pseudostem, and whole plant, resulting in the highest harvest indices and total and commercial yields of bulb.
The morphophysiological characteristics leaf area at 87 DAP and leaf area duration from 87 to 114 DAP correlated with bulb production with r = 0.6442 (p < 0.01) and r = 0.7263 (p < 0.01), respectively, were those that most influenced the yield of ‘Amarante’ garlic.
ACKNOWLEDGEMENTS
The authors want to thank the Instituto Federal de Educação, Ciência e Tecnologia do Norte de Minas Ge-rais (IFNMG - Campus Januária) for allowing the first author’s leave from work to carry out the doctoral degree and FAPEMIG for the support to the research.
REFERENCES
Agrianual (2017) Anuário da Agricultura Brasileira. São Paulo, IEG/FNP. 432p.
Albuquerque JRA, Monteiro HNB, Bezerra AAC, Matos Filho CHA, Lopes ACA & Gomes RLF (2017) Agromorphological performance of garlic landraces in Piauí, Brazil. Ciência Rural, 47:e20160017.
Backes C, Bôas RLV, Lima CP, Godoy LJG, Büll LT & Santos AJM (2010) Estado nutricional em nitrogênio da grama esmeralda avaliado por meio do teor foliar, clorofilômetro e imagem digi-tal, em área adubada com lodo de esgoto. Bragantia 69:661-668.
El-Sharkawy MA (2006a) International research on cassava photosynthesis, productivity, ecophysiology, and responses to environmental stresses in the tropics. Photosynthetica, 44:481-512.
El-Sharkawy MA (2006b) Utility of basic research in plant/crop physiology in relation to crop improvement: a review and a personal account. Brazilian Journal of Plant Physiology, 18:419-446.
Haque MS, Sattar MA & Pramanik MHR (2002) Dry matter accumulation and partitioning and growth of garlic as influenced by land configuration and cultivars. Pakistan Journal of Biological Sciences, 10:1028-1031.
Kim S, Jeong JH & Nackley LL (2013) Photosynthetic and transpiration responses to light, CO2, temperature and leaf senescence in garlic: analysis and modeling. Journal of the American Society for Horticultural Science, 138:149-156. Lopes WAR, Negreiros MZ, Morais PLD, Soares AM, Lucena
RRM, Silva OMP &Grangeiro LC (2016a) Caracterização físi-co-química de bulbos de alho submetido a períodos de vernalização e épocas de plantio. Horticultura Brasileira, 34:231-238.
Lopes WAR, Negreiros MZ, Resende FV, Lucena RRM, Soares AM, Silva OMP & Medeiros JF (2016b) Produção de alho sub-metido a períodos de vernalização e épocas de plantio em re-gião de clima semiárido. Horticultura Brasileira, 34:249-256. Marcelis LFM, Heuvelinkb E & Goudriaanc J (1998) Modelling
biomass production and yield of horticultural crops: a review. Scientia Horticulturae, 74:83-111.
Muro J, Irigoyen I, Lamsfus C & Militino AF (2000) Effect of defoliation on garlic yield. Scientia Horticulturae, 86:161-167. Oliveira FL, Doria H, Teodoro RB & Resende FV (2010) Caracte-rísticas agronômicas de cultivares de alho em Diamantina. Horticultura Brasileira, 28:355-359.
Pôrto ML, Puiatti M, Fontes PCR, Cecon PR, Alves JC & Arruda JA (2011) Índice SPAD para o diagnóstico do estado de nitrogê-nio na cultura da abobrinha. Horticultura Brasileira, 29:311-315.
490 Nelson Licínio Campos de Oliveira et al.
Rev. Ceres, Viçosa, v. 65, n.6, p. 481-490, nov/dez, 2018
Richards RA (2000) Selectable traits to increase crop photosynthesis and yield of grain crops. Journal of Experimen-tal Botany, 51:447-458.
Silva EC, Souza RJ & Santos VS (2000) Efeitos do tempo de frigorificação em cultivares de alho (Allium sativum L.)
prove-nientes de cultura de meristemas. Ciência e Agrotecnologia, 24:939-946.
Stahlschmidt OM & Cavagnaro JB (1997) Aspectos ecofisiologicos del cultivo de ajo. In: Burba JL (Ed.) 50 Temas sobre produccíon de ajo. Mendoza,La consulta. p.33.