Cláudia Raquel da Silva Nóbrega
Licenciatura em Biologia Molecular e Genética eMestrado em Microbiologia Aplicada
Biochemical and physiological insights into
bacterial cytochrome c peroxidases from
Escherichia coli and Neisseria gonorrhoeae
Dissertação para obtenção do Grau de Doutor em Bioquímica, especialidade em Bioquímica Física
Orientador: Doutora Sofia Rocha Pauleta,
Investigadora Principal da Faculdade de Ciências e Tecnologia
da Universidade Nova de Lisboa
Co-orientador: Doutor Bart Devreese,
Professor da Universidade de Ghent, Bélgica
Júri:
Presidente: Doutora Maria João Lobo dos Reis Madeira Crispim Romão Arguentes: Doutor Arsénio do Carmo Sales Mendes Fialho
Doutor Carlos Alberto Gomes Salgueiro Vogais: Doutor João Paulo dos Santos Gomes
Doutora Maria João Lobo dos Reis Madeira Crispim Romão Doutora Sofia Rocha Pauleta
Escherichia coli
Neisseria gonorrhoeae
Cláudia Raquel da Silva Nóbrega
Licenciatura em Biologia Molecular e Genética eMestrado em Microbiologia Aplicada
Biochemical and physiological insights into
bacterial cytochrome c peroxidases from
Escherichia coli and Neisseria gonorrhoeae
Dissertação para obtenção do Grau de Doutor em Bioquímica, especialidade em Bioquímica Física
Orientador: Doutora Sofia Rocha Pauleta,
Investigadora Principal da Faculdade de Ciências e Tecnologia
da Universidade Nova de Lisboa
Co-orientador: Doutor Bart Devreese,
Professor da Universidade de Ghent, Bélgica.
Júri:
Presidente: Doutora Maria João Lobo dos Reis Madeira Crispim Romão Arguentes: Doutor Arsénio do Carmo Sales Mendes Fialho
Doutor Carlos Alberto Gomes Salgueiro Vogais: Doutor João Paulo dos Santos Gomes
Doutora Maria João Lobo dos Reis Madeira Crispim Romão Doutora Sofia Rocha Pauleta
Biochemical and physiological insights into bacterial cytochrome
c
peroxidases from
Escherichia coli
and
Neisseria gonorrhoeae
Copyright by Cláudia Raquel da Silva Nóbrega, Faculdade de Ciências e Tecnologia da Universidade Nova de Lisboa e Universidade Nova de Lisboa
Setembro 2017
v
Acknowledgments
I would like to express my sincere gratitude to all the people that made this thesis possible. All of them provided a valuable contribution to this journey and I can just hope that I may meet them again, someday.
First of all, I would like to thank my supervisors. To my advisor Doctor Sofia Pauleta I have to thank for the opportunity to work in this project, for all that she taught me, her support, the time spent and much more, throughout all these years. I thank my co-advisor Prof. Bart Devreese for all the help with mass spectrometry analysis and for the uplifting and positive emails he has sent when I needed anything, always kind and available.
I would like to show my appreciation to Prof. Isabel Moura and Prof. José Moura for allowing me to work in their labs and for sharing their knowledge and books.
I thank to my collaborators from the X-Tal group, the crystallography group from UCIBIO, REQUIMTE. To Prof. Maria João Romão, who kindly received me in her lab and for providing new insightful ideas. To Doctor Ana Luísa Carvalho and Lina Juknaite for teaching me and helping me in all the crystallization experiments, but above all for never giving up and encouraging me to keep trying. I would also like to express my gratitude to the rest of the group, which was always available to help me and guide me.
I thank to all my colleagues, the present and the past ones, for their advice, guidance, knowledge, help, inspiring discussions, friendship and innumerous special memories. I would like to express my gratitude especially to Cíntia Carreira, for being my PhD partner and a trusted friend. Words cannot describe how fortunate I am to have met her and how much she inspired me to be a better scientist. I thank Bernardo, my partner in life, for always, always, always, supporting me during my PhD thesis and for not complaining for all the long hours I made him wait before going home or for making him
“wake up too early” to go to the lab.
I am grateful to my brother, who inspired me to pursue a PhD and has always been available whenever I needed him.
Agradeço aos meus pais que sempre me apoiaram, me motivaram a fazer o meu melhor e demonstraram interesse em tudo o que eu faço.
vii
Abstract
Bacteria display an array of enzymes to detoxify reactive oxygen species that cause cell damage and death, such as the bacterial cytochrome c peroxidase (BCCP) that reduces H2O2 to water in the periplasm. The BCCPs studied up-to-date are soluble dihemic enzymes from non-pathogenic bacteria. This thesis focus on the trihemic BCCP from Escherichia coli (YhjA), and the dihemic BCCP from
the obligate human pathogen Neisseriagonorrhoeae (NgBCCP). These two enzymes are membrane
anchored thus, soluble recombinant proteins of their conserved globular domains were produced, purified and characterized biochemically and spectroscopically.
Recombinant NgBCCP, a 38 kDa protein, forms a homodimer in the presence of calcium ions. It
contains a high-potential E heme (+310 mV, pH 7.5) and a low-potential P heme (-190 mV/-300 mV, pH 7.5), the active site, with a unique high-spin EPR signal at low temperatures in the mixed-valence active form. NgBCCP has catalytic activity with ABTS2- (synthetic electron donor) and a
Lipid-modified Azurin (LAz) as electron donors(low KM values 4.0 and 0.4 µM H2O2, respectively) which was dependent on reductive activation and calcium ions, and optimum at physiological pH (7.0) and temperature (37 ºC). LAz, identified as NgBCCP physiological electron donor, was capable of
activating the enzyme. The NgBCCP/LAz electron transfer complex has a low binding affinity
(micromolar range), and the interaction is dynamic and of a hydrophobic nature according to NMR, docking and preliminary calorimetry studies.
The peroxidase activity was inhibited by exogenous ligands bound at the active site, such as azide, cyanide and imidazole, as demonstrated by spectroscopic, kinetic and structural analysis. The structure of NgBCCP was determined for the mixed-valenced and azide-inhibited form, and a
catalytic mechanism for BCCPswas proposed based on the structural analysis of NgBCCP active
site.
The recombinant YhjA, a 50 kDa monomer, has a C-terminal domain homologous to dihemic BCCPs and a N-terminal (NT) domain. This domain was characterized for the first time, demonstrating that NT heme is His63/Met125 coordinated. The reduction potentials of P, NT and E hemes were determined: –170 mV, +133 mV and +210 mV, at pH 7.5, respectively. YhjA has quinol peroxidase activity in vitro (millimolar range KM values) using hydroquinone and menadiol (menaquinol analogue), as electron donors. Calcium ions were needed for maximum activity but not reductive activation, as P heme is always high-spin penta-coordinated. This property allowed to detect the formation of an intermediate radical species upon incubation with H2O2. Real Time PCR data showed that YhjA was expressed under anaerobic conditions, which agrees with the use of menaquinol in those conditions. Hence it was suggested a role in H2O2 detoxification when transitioning from anaerobic to aerobic environments.
Keywords: bacterial peroxidases, oxidative stress response, Neisseria gonorrhoeae, Escherichia coli,
ix
Resumo
As bactérias dispõem de um conjunto de enzimas que removem as espécies reactivas de oxigénio que causam danos e morte celular, tais como a peroxidase de citocromo c bacteriana (BCCP) que
reduz H2O2 a água no periplasma. As BCCPs estudadas até à data são enzimas di-hémicas solúveis de bactérias não patogénicas. Esta tese foca-se na BCCP tri-hémica de Escherichia coli (YhjA), e na
BCCP di-hémica da bactéria patogénica Neisseria gonorrhoeae (NgBCCP). Estas duas enzimas estão
ancoradas à membrana pelo que, proteínas recombinantes solúveis do domínio globular foram produzidas, purificadas e caracterizadas bioquimicamente e espectroscopicamente.
A NgBCCP recombinante, uma proteína de 38 kDa, forma um homodímero na presença de iões de
cálcio. Esta proteína contém o hemo E de alto potencial (+310 mV, pH 7.5) e o hemo P de baixo potencial (-190 mV/-300 mV, pH 7.5), o centro activo, que apresenta um sinal de spin alto único no espectro de EPR da forma de valência mista, a baixas temperaturas. A NgBCCP tem actividade
catalítica com ABTS2- (dador de electrões sintético) e a azurina modificada por lípidos (LAz), como dadores de electrões (valores de KM de 4.0 e 0.4 µM H2O2, respectivamente). A actividade da
NgBCCP é dependente de activação por redução e de iões de cálcio, e é óptima a valores de pH (7.0)
e temperatura (37 ºC) fisiológicos. A LAz, identificada como o dador de electrões fisiológico de
NgBCCP, é capaz de activar esta enzima. O complexo de transferência electrónica NgBCCP/LAz
tem uma afinidade de ligação baixa (na ordem de micromolar) e tem uma interação dinâmica e de
natureza hidrofóbica de acordo com os dados de NMR, “docking” e estudos preliminares de
calorimetria.
A análise espectroscópica, ensaios cinéticos e análise estrutural demonstraram que a actividade da
NgBCCP é inibida pela ligação de ligandos exógenos ao centro activo, tais como a azida, cianeto e
imidazol. A estrutura da NgBCCP foi determinada na forma de valência mista e na forma inibida
com azida, e um mecanismo catalítico para as BCCPs foi proposto com base na análise estrutural do centro activo da NgBCCP.
a utilização do menaquinol nessas condições. Com base nestes dados, foi sugerido um papel na destoxificação do H2O2 durante a transição de ambientes anaeróbios para ambientes aeróbios.
xi
Table of contents
Acknowledgments ... v
Abstract ... vii
Resumo ... ix
Table of contents ... xi
Figure Index ... xv
Table Index ... xxv
List of Abbreviations ... xxvii
1 Introduction ... 3
1.1 Metalloproteins containing heme redox centers – cytochromes ... 3
1.1.1 Cytochromes role in biological systems ... 3
1.1.2 Heme types and properties ... 3
1.1.3 Class classification and properties of c-type cytochromes ... 5
1.1.4 Spectroscopic properties of c-type cytochromes ... 6
1.1.4.1 UV-visible spectroscopy ... 7
1.1.4.2 Electron Paramagnetic Resonance ... 9
1.2 Oxidative stress systems ... 10
1.2.1 Reactive oxygen species and bacterial defense mechanisms ... 10
1.2.2 Oxidative stress regulators – OxyR, PerR and SoxRS ... 12
1.2.3 Superoxide dismutases ... 13
1.2.4 Catalases ... 14
1.2.5 Reduction of hydrogen peroxide ... 16
1.2.5.1 Thiol-based peroxidases ... 16
1.2.5.2 Rubrerythrin ... 18
1.2.5.3 Bacterial cytochrome c peroxidases ... 19
1.3 Bacterial Cytochrome c Peroxidases ... 20
1.3.1 Gene distribution, regulation and peroxidase location ... 20
1.3.2 Physiological role of bacterial peroxidases ... 22
1.3.3 Bacterial cytochrome c peroxidase phylogenetic groups ... 23
1.3.4 Classical bacterial peroxidases - Characterization of c-typehemes ... 24
1.3.5 The activation mechanism ... 25
1.3.5.1 The calcium binding site ... 26
1.3.5.2 Spectroscopic and structural changes in the activation mechanism ... 28
1.3.6 The catalytic mechanism ... 30
1.3.7 Electron donors – small redox proteins ... 33
1.4 Objectives ... 34
2 Materials and Methods ... 37
2.1 Chemicals and solutions ... 37
2.2 Bioinformatic analysis ... 37
2.2.1 Sequence analysis ... 37
2.2.2 Protein structure and surface analysis ... 37
2.3 Cloning and protein production ... 38
2.3.1 N. gonorrhoeae cytochrome c peroxidase ... 38
2.3.2 N. gonorrhoeae Lipid-modified azurin ... 39
2.3.3 E. coli YhjA and its domains ... 39
2.3.4 TEV protease production ... 40
2.4 Protein purification ... 41
2.4.1 Purification of recombinant NgBCCP ... 41
2.4.2 Purification of recombinant LAz ... 41
2.4.3 Purification of recombinant YhjA and subdomains ... 42
2.4.4 TEV protease purification ... 43
2.5 Digestion of YhjA Strep-Tag using TEV protease ... 44
2.6 Biochemical characterization ... 45
2.6.1 Molecular mass determination ... 45
2.6.2 Spectroscopic characterization ... 45
2.6.2.1 UV-visible spectroscopy ... 45
2.6.2.2 EPR spectroscopy ... 47
2.6.3 Protein quantification – modified Lowry ... 47
2.6.4 Heme and copper quantification – determination of molar extinction coefficients . 47 2.6.5 Differential scanning calorimetry ... 48
2.6.6 Potentiometric redox titrations ... 48
2.7 Steady-state kinetics ... 50
2.7.1 NgBCCP kinetic assays with ABTS2- ... 50
2.7.2 NgBCCP kinetics assays with LAz ... 52
2.7.3 YhjA kinetic assays with ABTS2- and quinol electron donors ... 54
2.8 NgBCCP crystallographic structure ... 55
2.8.1 Crystallization of NgBCCP in the mixed-valence state ... 55
2.8.2 Data collection and processing ... 56
2.9 LAz/NgBCCP interaction studies ... 57
2.9.1 Isothermal titration calorimetry ... 57
xiii
2.9.3 Two-dimensional NMR titration ... 57
2.9.4 Dipole moment calculations ... 58
2.9.5 LAz-NgBCCP molecular docking simulation and complex evaluation ... 58
2.10 Analysis of yhjA relative gene expression ... 59
2.10.1 E. coli K-12 strains and growth conditions ... 59
2.10.2 RNA extraction and reverse transcriptase reaction ... 59
2.10.3 Quantitative Real Time PCR - Quantification using Standard curves ... 60
2.11 Physiological role of YhjA in E. coli K-12 ... 61
2.11.1 Killing assays ... 61
2.11.2 Disc diffusion method ... 62
2.11.3 Membrane fraction peroxidase activity ... 62
3 Biochemical and Structural Characterization of Bacterial Cytochrome c Peroxidase from the Human Pathogen Neisseria gonorrhoeae ... 65
3.1 Introduction ... 65
3.2 Results and Discussion ... 68
3.2.1 Primary Sequence Analysis ... 68
3.2.2 Heterologous production of Neisseria gonorrhoeae BCCP ... 70
3.2.3 The monomer-dimer equilibrium ... 70
3.2.4 Spectroscopic characterization – UV-visible and EPR spectroscopies ... 73
3.2.5 Redox titration ... 78
3.2.6 Steady-state kinetics with ABTS2-... 79
3.2.7 Inhibition Studies - Binding and Steady-state Kinetics ... 83
3.2.8 X-ray structures of the active and azide-inhibited NgBCCP ... 88
3.2.8.1 Crystallization conditions ... 88
3.2.8.2 Structure analysis of the active NgBCCP ... 90
3.2.8.3 The dimer interface ... 94
3.2.8.4 The active site... 96
3.2.8.5 The azide-inhibited NgBCCP ... 98
3.3 Conclusions ... 101
4 LAz, a lipid-modified azurin –NgBCCP electron donor ... 105
4.1 Introduction ... 105
4.2 Results and discussion ... 110
4.2.1 Biochemical characterization of Neisseria gonorrhoeae LAz ... 110
4.2.2 NgBCCP steady-state kinetics with LAz as electron donor ... 112
4.2.3 Inhibition of the NgBCCP catalytic activity with LAz as electron donor ... 116
4.2.4 Preliminary calorimetric studies –NgBCCP and LAz interaction ... 117
4.2.5.1 Heteronuclear NMR titration and surface analysis ... 120
4.2.5.2 Molecular Docking simulation of LAz/NgBCCP complex – Two strategies ... 125
4.3 Conclusions ... 132
5 Biochemical characterization of YhjA, a trihemic enzyme with quinol peroxidase activity in vitro from Escherichia coli ... 135
5.1 Introduction ... 135
5.2 Results and Discussion ... 138
5.2.1 Heterologous production and characterization of recombinant YhjA and subdomains ... 138
5.2.2 Biochemical characterization – Solution states of YhjA and its domains ... 140
5.2.3 Spectroscopic characterization of the N-terminal domain... 142
5.2.4 Spectroscopic characterization of YhjA ... 143
5.2.5 Redox titration – Reduction potential of YhjA hemes ... 149
5.2.6 Catalytic mechanism – Steady-state kinetics... 151
5.2.7 yhjA gene expression and regulation ... 155
5.2.8 YhjA physiological role ... 159
5.3 Conclusions ... 163
6 Conclusions and Future Perspectives ... 167
6.1 Conclusions ... 167
6.2 Future Perspectives ... 169
References ... 173
xv
Figure Index
Figure 1.1– Chemical structures of heme b (protoheme IX) and a, c and d1 (protoheme derivatives). Adapted
from Reedy and Gibney 2. ... 4
Figure 1.2 –Example of class I c-type cytochrome. X-ray structure of Rhodobacter capsulatus cytochrome c2
colored according to secondary structure. It has the typical five α-helices with a histidine and methionine as axial ligands (in black) coordinating the iron center (red sphere) from the c-type heme (in grey). This structure
was retrieved from PDB (ID:1C2R) and rendered in Discovery Studio Visualizer. ... 6
Figure 1.3 –Electrons distributed in the 3d orbitals in an octahedral geometry, like the one observed for heme iron: Fe3+ (A) and Fe2+ (B). ... 7
Figure 1.4 –Absorption spectra of horse heart cytochrome c in the ferric state (solid line) and in the ferrous
state (dotted line). ... 8
Figure 1.5 – Stepwise reduction by one-electron transfer of molecular oxygen to superoxide, hydrogen peroxide, hydroxyl radical and water. The reduction potentials indicated are for pH 7.0. Scheme adapted from Mishra and Imlay 45. ... 11
Figure 1.6 – Schematic representation of the reduction/oxidation mechanism of the OxyR transcription
regulator in E. coli. The reduced inactive form is oxidized by hydrogen peroxide forming disulphide bonds
between the cysteines. This active oxidized form induces the expression of several genes of the OxyR regulon, many involved in ROS detoxification. The oxidized form is reduced by the glutathione reductase/glutaredoxin system. Scheme adapted from Chiang and Schellhorn 53. ... 12
Figure 1.7– Molecular structure of E. coli superoxide dismutases: (A) MnSOD, (B) FeSOD and (C) CuZnSOD.
The dimeric form of each structure is represented except for CuZnSOD where the assymetric unit comprised only one of the subunits. Figure prepared with PDB IDs: 3K9S, 1ISA and 1ESO, respectively. ... 14
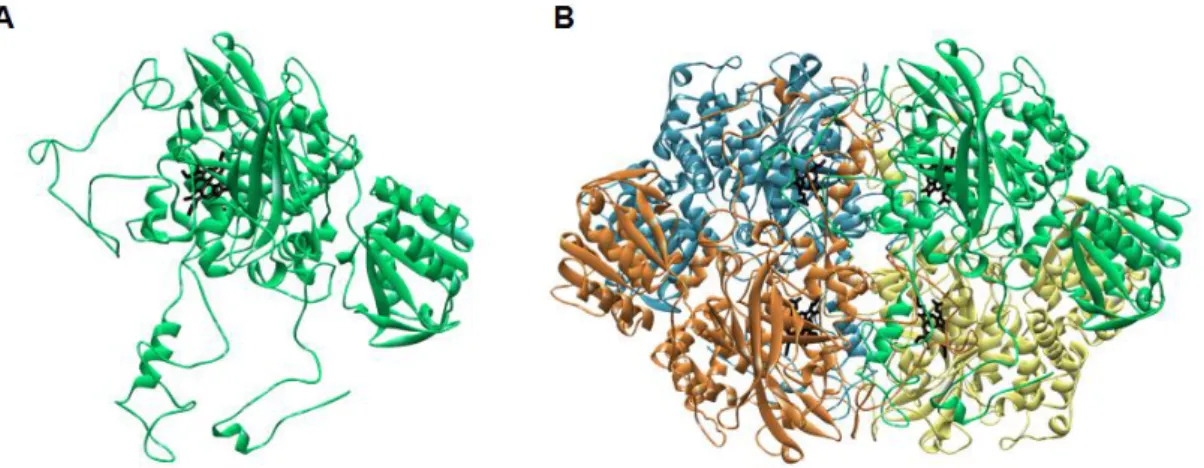
Figure 1.8– Molecular structure of E. coli KatE (A) monomer and (B) tetramer. The structure is colored by
chain, each one with a single d-type heme (black). Figure prepared with PDB ID:4BFL. ... 16
Figure 1.9– Proposed mechanism for the thiol-based reductases (Prx): BCP, Tpx and Gpx. These enzymes use thioredoxin (Trx) and thioredoxin reductase (TrxR) as electron donors, to reduce peroxides (ROOH). Adapted from Mishra and Imlay 45. ... 17
Figure 1.10– Proposed electron transfer mechanism to rubrerythrin (Rbr) to reduce hydrogen peroxide. The NADH:rubredoxin oxidoreductase (NROR) reduces rubredoxin (Rd) which reduces Rbr. Adapted from Mishra and Imlay 45. ... 18
Figure 1.11– Molecular structure of the co-crystallized S. cerevisiae CCP and cytochrome c. This structure
allowed to determine the primary interface region of this redox pair and the electron transfer pathway 110. The
b-type hemes are colored by atom color. Figure prepared with PDB ID: 2PCB. ... 19
Figure 1.12– Nucleotide sequence of the promoter region of (A) N. gonorrhoeae ccp gene 119 and (B) E. coli
yhjA gene 123. The putative FNR and OxyR binding sites are underlined and the nucleotides in bold match their
consensus sequences. ... 20
Figure 1.13– Schematic representation of the oxidative stress responses in a Gram-negative bacteria. The proteins and reactions represented might not occur at the same time in one single organism. BCCP is the only enzyme with peroxidase activity in the periplasm. SOD – Superoxide dismutases; Kat – Catalases; Ahp – Alkylhydroperoxide reductase; Prx – thiol-based peroxidases (BCP, Tpx, Gpx); Trx – thioredoxin; Rbr – rubrerythrin; Rd – Rubredoxin; OM – Outer membrane; IM – Inner membrane. ... 22
Figure 1.14– Schematic representation of the BCCPs primary sequence (A-D) and of their respective location in the periplasm (E). (A) The P. aeruginosa BCCP is soluble in the periplasm and has two c-type heme binding
a transmembrane helix that anchors the enzyme to the inner membrane (IM). (C) The N. gonorrhoeae BCCP
is bound to the outer membrane (OM) by a lipid-modified cysteine and has a linker region (named H.8 epitope)
that confers flexibility within the periplasm. (D) The E. coli BCCP has three heme binding domains, two of
them homologous to the other BCCPs and an extra N-terminal heme binding domain. Similar to D. radiodurans
it has a transmembrane helix that anchors the enzyme to the IM. (E) The putative structure of each BCCP type is represented by the various heme domains (orange circles) with respective heme (yellow bars). ... 23 Figure 1.15 – Activation mechanism of BCCPs. (A) The as-isolated BCCP has a His/Met hexa-coordinated E heme in a high/low-spin (6cHS/LS) equilibrium at room temperature (RT) due to a loosely bound methionine residue (dashed line). The low potential P heme is hexa-coordinated and low-spin (6cLS) with two axial histidine ligands. Typically it is in a monomer-dimer equilibrium and becomes fully dimeric in the presence of calcium ions. (B) When E heme is reduced by a small redox protein or a reducing agent, such as sodium ascorbate, if there are calcium ions, the P heme becomes penta-coordinated, high spin (5cHS), and this is the mixed-valence active form (C) Removal of calcium ions by a calcium chelator such as EGTA, induces monomerization of BCCP. In the mixed-valence state the P heme continues to be 6cLS and the enzyme is inactive. ... 26
Figure 1.16 – (A) Crystallographic structure of P. aeruginosa BCCP in the mixed-valence state. The
asymmetric unit is a homodimer. Each monomer has two hemes, E heme and P heme, a calcium atom (green sphere) between the two heme domains and the conserved tryptophan (purple). (B) The calcium binding site is coordinated by four water molecules and the oxygens from carboxyl group from Thr256 and Pro258, and from the side chain of Asn79. Two of the waters are coordinated by the propionate group A from E heme. Figure prepared with PDB ID: 2VHD. ... 27
Figure 1.17– Molecular structure of (A) E heme and (B) P heme in the oxidized (Ox) state and (C) P heme in
mixed-valence (MV) state in P. pantrotrophus BCCP. The heme axial ligands are shown in purple. Figure
prepared with PDB ID: 2C1U and 2C1V for the oxidized and mixed-valence structures, respectively. ... 28
Figure 1.18 – Dimer interface of P. aeruginosa BCCP. A π-stacking interaction between the tryptophan
(Trp73) and the glycine (Gly72) of the opposite monomer stabilizes the loop that carries the P heme histidine distal ligand (His71). The surfaces of chain A and B are colored in blue and red, respectively. Figure prepared with PDB ID: 2VHD. ... 29
Figure 1.19– Schematic representation of the bacterial cytochrome c peroxidases (BCCPs) E and P hemes
redox state, axial ligands and the intermediary species formed during its catalytic cycle. For ease of representation only one monomer of the BCCP is represented. (A) The as-isolated BCCP is fully oxidized and inactive. (B) The electrons are delivered by a small redox protein to E heme, which becomes reduced leading to conformational changes that remove the distal histidine ligand in P heme. (C) E heme transfers one electron to P heme, the active site, which reduces hydrogen peroxide, releasing a water molecule and one oxygen
remains bound, forming a Fe4+-oxo intermediary species (compound I). (D) One electron from the electron
donor and one proton forms the Fe3+-OH (compound II) and (E) addition of another proton releases a second
water molecule. If there is reductive power the cycle continues to (B), otherwise it slowly reverts to (A). The dashed methionine bond in the as-isolated state is representative of the E heme high/low-spin equilibrium at room temperature. Adapted from Pettigrew et al. 180. ... 30
Figure 1.20– The P heme cavity of P. pantotrophus BCCP has five highly conserved residues: Phe107, Gln118,
Pro122, Glu128 and Met129. Two of these residues, Gln118 and Glu128, are within hydrogen bond distance from the water molecule coordinating the P heme (dashed lines). Figure prepared with PDB ID: 2C1V. ... 31
Figure 2.1 – SDS-PAGE of the intermediate purification fractions and the purified NgBCCP in a 12.5 %
Tris-Tricine gel stained by (A) Coomassie blue and (B) and heme stained. (Lane 1 - Protein Marker; Lane 2 –
periplasmatic extract; Lane 3 – HisTrap final fraction; Lane 4 - purified NgBCCP). (C) Coomassie blue stained PAGE of purified NgBCCP in a 10 % Tris-Tricine gel. ... 41
xvii
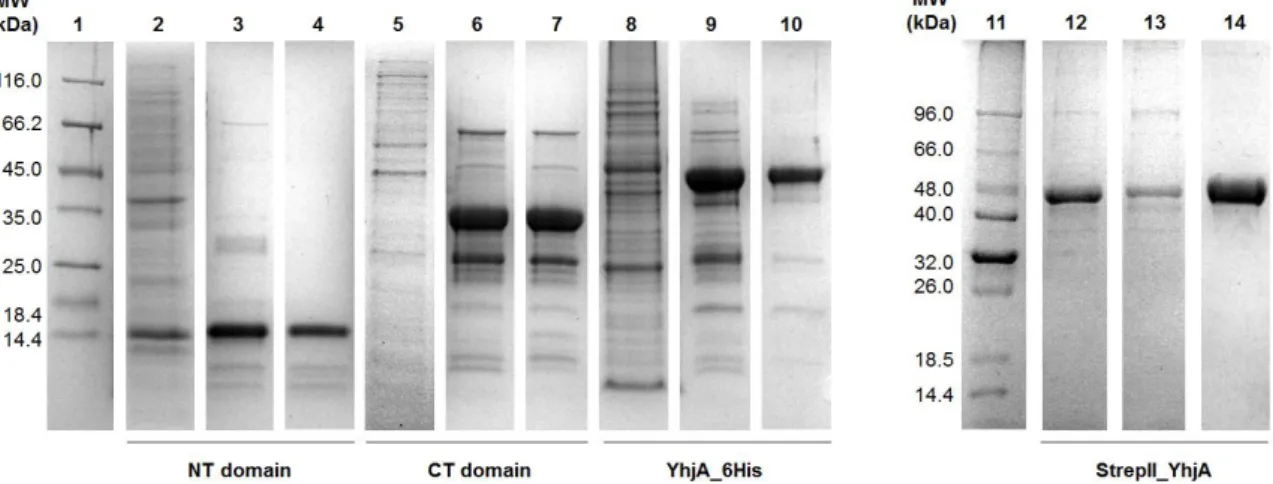
Figure 2.3–Coomassie blue stained SDS-PAGE of the intermediate purification fractions and the purified protein samples of the NT domain (2-4), CT domain (5-7), YhjA_6His (8-9) and StrepII_YhjA (12-14) in a 12.5 % Tris-Tricine gel (Lanes 1 and 11 - Protein Markers; Lanes 2, 5, 8 and 12 – periplasmatic extracts; Lanes 3, 6 and 9 – HisTrap final fractions; Lane 13 – StrepTrap final fraction; Lanes 4, 7, 10, 14 - purified proteins). ... 43
Figure 2.4– Coomassie blue stained SDS PAGE of purified TEV (29 kDa) in a 12.5 % Tris-Tricine gel. (Lane 1 - Protein Marker; Lane 2 – purified TEV). ... 44
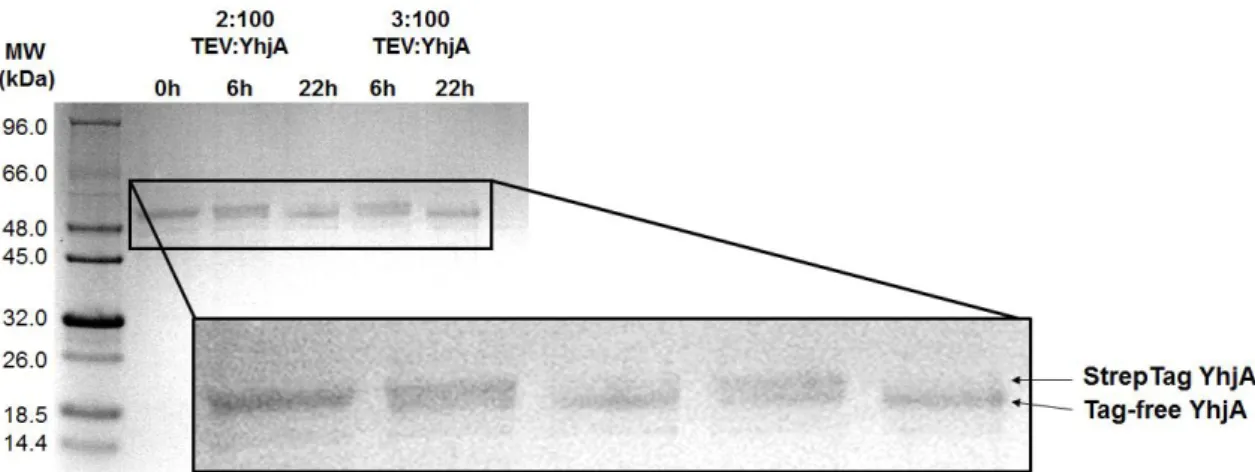
Figure 2.5– Digestion test with different ratios of TEV:YhjA and incubations times at 4 ºC (6 h and 22 h). The result was assessed in a 12.5 % tricine SDS-PAGE stained with Coomassie Blue. The Tag-free YhjA has a slightly lower molecular weight. Digestion was mostly complete in a ratio of 3:100 (mg/mg). Final ratio was 1:20 TEV:YhjA (mg/mg) to guarantee full digestion. ... 44
Figure 2.6 –Model of the potentiometric titration of a protein with three independent redox centers that are either oxidized (open circles) or reduced (closed circles). This scheme shows all the possible redox states (Pn)
and the reduction potential (Ei) of each redox center i. . ... 49
Figure 2.7– Kinetic trace of peroxidatic activity of the pre-activated NgBCCP using 3 mM ABTS2- as electron
donor and 100 μM H2O2 in 10 mM HEPES, pH 7.5, 10 mM NaCl, 1 mM CaCl2, at 25 ºC. ... 51
Figure 2.8– Kinetic trace of peroxidatic activity of the pre-activated NgBCCP using 10 μM LAz as electron
donor and 100 μM H2O2 in 10 mM MES, pH 6.0, 10 mM NaCl, 1 mM CaCl2, at 25 ºC. ... 53
Figure 2.9 –UV-visible absorption spectra of (A) benzoquinone, (B) duroquinone and (C) menadione in 10
mM HEPES pH 7.5, 10 mM NaCl and 1 mM CaCl2. The concentrations used for benzaquinone were 125, 67.5
and 31.25 µM, while for duroquinone and menadione solutions with 40, 20, 10 and 5 µM were prepared. .. 54
Figure 2.10–qPCR data for yhjA gene expression in anaerobiosis. (A) PCR efficiency is approximately 1.0
with a slope of -3.2 for the DNA standard curve (closed circles) which is consistent with DNA duplicating after each cycle. (B) Melting curves show that there is one single amplicon for both DNA and cDNA samples. .. 61
Figure 3.1– Schematic representation of the oxidative stress responses in N. gonorrhoeae. NgBCCP is located
in the periplasm, anchored to the outer membrane. Other enzymes are located in the cytoplasm with the exception of MsrAB (methionine sulfoxide reductase) that is inserted in the outer membrane and encoded by
msrAB gene, which expression increases when cells are exposed to H2O2. In the cytoplasm, peroxiredoxin
(Prx) oxidizes the reduced glutathione (GSH) and reduces H2O2, forming GSSG, which is reduced by the
glutathione reductase (Gor). Bacterioferritin binds free Fe2+ avoiding Fenton reactions. This bacterium has one
superoxide dismutase (SodB) and one catalase (KatA). IM – Inner membrane; OM – Outer membrane. ... 66
Figure 3.2 – Multiple sequence alignment of bacterial cytochrome c peroxidases primary sequence. N. gonorrhoeae FA 1090 (Ng; GI: 59802088), M. capsulatus (Mc; GI:53756268), S. oneidensis
(So; GI:24373735), P. aeruginosa (Psa; GI:15599783), N. europaea (Ne; GI: 30180613),
M. hydrocarbonoclasticus (Mah; GI:56541647), P. pantotrophus (Pap; GI:916812477), R. capsulatus (Rc;
GI:940625801) and G. sulfurreducens (Gs; GI:259090277). The coloring is in accordance with percentage of
identity at each position, from darker color box (100 % identity) to white box (≤ 20 % identity). The sequences are sorted by pairwise identity to NgBCCP. The outlined grey box marks the NgBCCP peptidase II cutting site
and the black box the low complexity region with imperfect sequence repeats, only present in Neisseria species
BCCPs. The loops and flexible regions involved in reductive activation are outlined by dashed black boxes. Some residues are marked, such as: (●) axial ligands, (*) calcium binding residues (▲) tryptophan at the dimer interface and (■) tryptophan bridging electron transfer between the two hemes. ... 69 Figure 3.3 – Molecular size exclusion chromatography of as-isolated NgBCCP (45 kDa, red line), at high ionic
strength (44 kDa black line), with 2 mM CaCl2 (68 kDa, blue line), and with 2 mM EGTA (43 kDa, green line).
In grey are the elution profiles of standards proteins used to estimate the apparent molecular weight: Ferritin (Fer, 440 kDa), Aldolase (Ald, 158 kDa), Conalbumin (Con, 75 kDa), Ovalbumin (Ov, 44 kDa) and
Ribonuclease A (Rib, 13.7 kDa). Concentration of NgBCCP injected was 140 μM. Experimental conditions
Figure 3.4– Differential scanning calorimetry of NgBCCP in different redox conditions and effect of calcium
ions. NgBCCP (20 µM) equilibrated in 10 mM HEPES pH 7.5 (dash-dot line), 10 mM HEPES pH 7.5 and
2 mM CaCl2 (solid line), 10 mM HEPES pH 7.5 and 2 mM EGTA (dotted line), and 10 mM HEPES pH 7.5,
2 mM CaCl2, 1 mM sodium ascorbate and 5 μM DAD (dashed line). The thermograms were baseline corrected
and normalized for concentration. The simulations fitting the data are represented as blue lines. ... 72
Figure 3.5 – UV-visible absorption spectra of NgBCCP, in 10 mM HEPES pH 7.5. The spectrum of the
as-isolated NgBCCP is displayed as a solid line, the dashed and dotted lines are the spectra of the
mixed-valence and mixed-mixed-valence incubated with calcium for 10 min, respectively. The inset shows the high-spin band in the visible spectra. ... 73
Figure 3.6– Schematic representation of NgBCCP indicating the spin-state and coordination sphere of both
heme in the as-isolated fully oxidized form (A), mixed valence form without calcium ions in solution (B) and with additional calcium ions in solution (C). (A) In the fully oxidized state, ferric E heme is in a 6cHS/LS equilibrium at room temperature and the ferric P heme is 6cLS. (B) In the mixed valence form, E heme is reduced and becomes low-spin. If the calcium binding site is occupied, the reduction of E heme causes conformational changes that result in the removal of the P heme axial histidine ligand, which becomes 5cHS (active form) and HS/LS at low temperatures. In both redox states there is a monomer/dimer equilibrium due to a fraction of unoccupied calcium binding sites. Addition of calcium ions (C) promotes full dimerization and simplification of solutions states, with P heme being as 5cHS, and with some HS/LS being observed at low temperatures. 5c – penta-coordinated; 6c – hexa-coordinate; HS – high-spin; LS – low-spin. ... 74
Figure 3.7–Difference absorption spectra of NgBCCP in the mixed-valence state (3 µM), in 10 mM HEPES
pH 7.5, at 25 ºC, (A) upon addition of 1 mM EGTA as calcium ions are removed, and (B) after titrating calcium
ions into solution, reverting the changes in NgBCCP. The inset shows differences at the high-spin region of
the visible spectra. Arrows indicate the direction of changes in the spectra that were acquired over time (up to 20 min) for calcium ions removal with EGTA (A), or over sequential additions of calcium ions (B). (C) The
ratio of protein bound to Ca2+ was calculated from the absorption change at 401 nm (P heme), 10 min after
each addition of 100 mM CaCl2. Free Ca2+ was calculated considering the EGTA binding affinity at this pH
value, ionic strength and temperature (KD = 21 nM). The data was fitted considering a single calcium binding
site with a KD = 8.5 ± 0.5 nM. ... 75
Figure 3.8– X-band EPR spectra of 0.2 mM NgBCCP and respective simulations below, in the oxidized form
(A), after 1 min incubation with sodium ascorbate (B), after 30 min incubation with sodium ascorbate (C) and
after 30 min incubation with 2 mM CaCl2 after reduction with sodium ascorbate (D). The asterisk (*) marks
the signal of free iron and the cardinal (#) is a cavity contaminant. ... 76
Figure 3.9 – Effect of calcium ions in the potentiometric titrations of NgBCCP at pH 7.5. The reduction
potentials were determined (A) in the presence of excess of calcium ions, (B) without added calcium ions and (C) in its absence, in the presence of EGTA. The reductive titration is represented by open circles and the oxidative titration by closed circles. The lines represent the simulation of the potentiometric curve using the reduction potentials listed in Table 3.2. ... 78
Figure 3.10– Kinetic traces of peroxidatic activity of the (A) pre-activated NgBCCP using ABTS2- as electron
donor in the presence (solid line) of 1 mM CaCl2 during the pre-activation and kinetic assay, and of the
as-isolated NgBCCP with 1 mM CaCl2 in the kinetic assay (dashed-line). (B) Kinetic traces of pre-activated
NgBCCP with 1 mM CaCl2 during pre-activation and the kinetic assay (solid line) and with 1 mM CaCl2 only
in the kinetic assay (dashed-line). The assays were performed in 10 mM HEPES, 10 mM NaCl at pH 7.0 and 25 ºC with 100 µM H2O2. Time zero was adjusted to the time NgBCCP was added. The initial rates determined
for the pre-activated NgBCCP are 0.79 ± 0.05 ABTS2-.s-1 in the presence of calcium ions. The as-isolated NgBCCP initial rate is 0.019 ± 0.002 ABTS2-.s-1 in the presence of calcium ions. The presence or absence of
calcium ions in the pre-activation results in similar initial rates of 0.70 ± 0.01 ABTS2-.s-1 and 0.68 ± 0.01
ABTS2-.s-1, respectively. ... 80
Figure 3.11– Steady-state kinetics using ABTS2- as electron donor. Catalytic activity of NgBCCP without (A)
and with pre-activation (B). pH effect on pre-activated NgBCCP catalytic activity (C) and, for each pH, the
xix
lines represent the simulated data using Michaelis-Menten, and Equations 2.8 and 2.9 in Chapter 2 (Materials and Methods, Section 2.7.1). The parameters used in the simulation are the ones stated in the main text. ... 81
Figure 3.12– Arrhenius plot (A) and Eyring plot (B) plot for NgBCCP activity with ABTS2- as electron donor,
in 10 mM HEPES, 10 mM NaCl and 2 mM CaCl2, at pH 7.0, as a function of temperature. At temperatures
above 40 ºC the plots are no longer linear due to enzyme denaturation, reason why these data were not included in the slope determination. The correlation coefficients are 0.95 and 0.91 for (A) and (B), respectively. ... 82
Figure 3.13 – UV-visible spectra of mixed-valence NgBCCP, at pH 7.5 binding increasing amounts of cyanide
(A), azide (C) and imidazole (E). The arrows indicate direction of changes in the spectra from the light grey (no inhibitor) to dark grey (maximum inhibitor concentration). The absorption difference at specific wavelengths was plotted as a function of inhibitor concentration in solution (B, cyanide; D, azide; F, imidazole). The dashed line (B, D) simulates the binding of cyanide and azide to one single binding site with a kappof 4 µM
and 26 mM, respectively (see equation 2.3 in Chapter 2, Section 2.6.2). ... 84
Figure 3.14– Determination of the mixed inhibition constants according to scheme in Figure 3.15 for (A, B) cyanide, (C, D) azide and (E, F) imidazole at pH 7.5. ki’ and ki estimates are given by the intercept value in
plots of S/v (Dixon: A, C, E) or 1/v (Cornish-Bowden: B, D, F) respectively, against i at three different substrate concentrations (● 0.1 µM, ■ 25 µM and ▲ 100 µM H2O2). The error bars are represented for the average of
duplicate measurements... 86
Figure 3.15– Kinetic diagram of NgBCCP activity with H2O2 as substrate and H2O as final product (protons
and electrons in this reaction were omitted for simplicity, see Chapter 1, Section 1.3.6 for a detailed catalytic cycle). In the presence of inhibitor (I) there is mixed-inhibition, where ki is the competitive inhibition constant
and ki’ the uncompetitive inhibition constant. These two constants are related by a constant α, ki’ = α.ki. ... 87
Figure 3.16– Crystals of NgBCCP obtained by the vapour diffusion (hanging-drop) method at 4 ºC in 0.1 M
MES pH 5.5, Jeffamine SD2001 (25-27 %) and 0.1 M sodium malonate, 2 mM CaCl2 without additives (A)
and with addition of 0.01 M hexammine cobalt(III) trichloride (B). ... 89
Figure 3.17– (A) Crystals of NgBCCP obtained by the vapor diffusion (sitting-drop) method at 30 ºC in 0.1 M
MES pH 6.0, 30 % 5/4 PO/OH, 2 mM CaCl2, 10 mM sodium ascorbate and 0.2 mM FMN, in a Coy Lab
anaerobic chamber (2 % hydrogen, 98 % argon atmosphere). (B) Crystals grow to a maximum size of 0.6 mm after 7 days. ... 90
Figure 3.18– (A) Structure of mixed-valence NgBCCP, homodimer which comprises the asymmetric unit of
the crystal and (B) its electrostatic surface potential represented from -5 to 5 KT/e (colored from negative red surface to positive blue surface). ... 91
Figure 3.19– Structure of mixed-valence NgBCCP with the calcium binding site located between the two
hemes, a His/Met coordinated E heme and the P heme with a proximal histidine ligand and the distal water molecule (small red sphere). Although the two hemes have a Fe-Fe distance of 20.9 Å, electron transfer is possible due to the tryptophan residue located between their propionate groups. (B) Structure of the calcium binding site, with calcium ion (green sphere) coordinated by the oxygen of four water molecules (small red spheres) and three conserved amino acid residues (Asn83, Thr261 and Pro263). It is in close proximity to the carboxylate group of propionate A from the E heme, which forms hydrogen bonds with two of the waters that coordinate the calcium ion. ... 91
Figure 3.20 –Structure comparison of NgBCCP mixed-valence (MV) form with PsaBCCP MV and oxidized
(Ox) form. In red is highlighted the structural differences between MV forms, in green the differences between oxidation states. ... 93
Figure 3.21– Surface of the mixed-valence tridimensional structures of one monomer of (A) NgBCCP, (B) P. aeruginosa BCCP and (C) S. oneidensis BCCP colored from non-hydrophobic residues (green) through
white, to hydrophobic (magenta). The surface in the dashed black box is the dimer interface region. Figures prepared with PDB ID:2VHD and 3O5C of P. aeruginosa and S. oneidensis BCCPs, respectively. ... 94
Figure 3.22 –Dimer interface of NgBCCP. The residues involved in the interface according to PDBePISA are
hydrogen bonds Asn51-Met69 and Ala62-Leu318 (zoom view of these residues in orange). Although the C-terminus is along one side of the P domain surface, only these two close interactions involve residues of this domain, the one with larger interface surface. ... 95
Figure 3.23 – Structure of the P heme active site in (A) chain A and (B) in chain B. There are two water molecules, w1 and w2 (small red spheres representing their oxygen atoms), in the active site coordinated by the conserved Gln108 and Glu118 side-chains. ... 96
Figure 3.24– Proposed catalytic mechanism of bacterial peroxidases. (1.) P heme is penta-coordinated and in the presence of hydrogen peroxide (2.), there is formation of a peroxide-bound complex. Glu118 forms a hydrogen bond with one of the oxygens (blue O). (3.) This form, named Compound 0, is followed by the cleavage of O-O bond, releasing one water and forming Compound I (4.). This species is stabilized and can receive protons from Gln108 forming Compound II (5.). Transfer of an additional proton releases a second water molecule (6.). ... 97
Figure 3.25– Structure comparison of the NgBCCP active (blue) and azide inhibited (pink) forms. Overall
protein structure is conserved (A) as well as the residues in the active site (B). (C) In the the inhibited form there is an azide molecule, coordinated by the conserved Gln108 and Glu118. ... 99
Figure 4.1 – Molecular structures of small type 1 copper proteins such as (A) P. aeruginosa azurin, (B)
P. pantotrophus pseudoazurin, (C) Paracoccus denitrificans amicyanin and (D) spinach plastocyanin.
Structures are colored according to secondary structure and the copper atom is represented by an orange sphere. Figures were prepared with PDB IDS: 4AZU, 3ERX, 2RAC and 1AG6, respectively. ... 105
Figure 4.2– LAz primary sequence. The grey sequence consists of the signal peptide recognized and removed by the signal peptidase II (underlined) and the five AAEAP imperfect repeats. The remaining sequence constitutes the globular domain with the five copper binding residues identified (bold and underlined). ... 107
Figure 4.3– Schematic representation of the electron transfer in N. gonorrhoeae and the role of LAz and other
electron donors/acceptors. The arrows represent electron transfer. Solid arrows are proven and dashed arrows are proposed electron transfers. The electron transfer between LAz and NgBCCP as a blue arrow, will be
characterized in this chapter. OM – Outer membrane; IM – Inner membrane. ... 108
Figure 4.4– (A) LAz soluble structure determined by NMR and (B) detailed structure of the copper center.
The ensemble of ten NMR structures is colored by secondary structure with an elongated β-barrel formed by
eight β-strands (in blue) that compose two antiparallel β-sheets, and one main alpha helix (red). The type 1 copper center responsible for its spectroscopic properties, comprises a copper atom (orange sphere) coordinated by the side chains of His49, Cys113, His118, Met122 and the oxygen of the peptide bond from Gly48. Figures prepared with PDB ID: 2N0M. ... 108
Figure 4.5– (A) SDS-PAGE of the purified of LAz (lane 2) in a 15 % Tris-Tricine gel stained with Coomassie Blue. Lane 1 is the protein marker. (B) UV-visible absorption spectra of LAz, in 20 mM phosphate buffer pH 7.0, as-isolated (solid line), fully oxidized with potassium ferricyanide (dashed line) and fully reduced with sodium dithionite (dotted line). ... 110
Figure 4.6– Molecular size-exclusion chromatography of LAz in 50 mM Tris-HCl pH 7.6 and 150 mM NaCl (21 kDa, blue line). In grey are the elution profiles of standards proteins used to estimate the apparent molecular weight: Albumin (Alb, 65 kDa), Ovalbumin (Ov, 44 kDa), Carbonic Anhydrase (CA, 29 kDa) and Ribonuclease A (Rib, 13.7 kDa). ... 111 Figure 4.7 – Kinetic traces of the periplasmic extract of E. coli/pEC86/pET22 NgBCCP with 10 µM reduced
LAz (A) or horse heart cytochrome c (B) as electron donors, after addition of 100 µM H2O2 (time 0 s), in
10 mM MES pH 6.0, 10 mM NaCl and 1 mM CaCl2. The oxidation rates were estimated in the presence of
0.02 µg protein (solid line) and 0.004 µg protein (dashed line). A control with a periplasmic extract of
E. coli/pEC86/pET22b (not producing enzyme) was performed with 0.02 µg protein and LAz (dotted line).
... 112
Figure 4.8– (A) NgBCCP activation by incubation with fully reduced 9 µM LAz over time . (B) The kinetic
xxi
condition NgBCCP was added after H2O2) and 10 min (black circles). Without any previous activation (0 min)
the turnover rate is 10 ± 3 s-1 and it reaches maximum activity after a 10 min incubation (23 ± 1 s-1). ... 113
Figure 4.9– The kinetic traces of NgBCCP activity with 10 µM LAz and 100 µM H2O2 in 10 mM MES pH
6.0. LAz oxidation was followed at A625nm in the presence (black circles) and absence (grey circles) of 2 mM
CaCl2in the assay. The initial rates determined were 0.329 ± 0.004 μM LAz.s-1and 0.085 ± 0.003 μM LAz.s 1,
respectively. Time zero was adjusted to the time pre-activated NgBCCP was added. ... 113
Figure 4.10 – Steady-state kinetics using LAz as electron donor. Catalytic activity of pre-activated NgBCCP
as a function of substrate concentration (A), pH (B), temperature (C) and ionic strengh (D). The open circles in (C) are experimental points where the reaction is not complete due to protein denaturation. The dashed lines represent the simulated data using the equations in Chapter 2, Materials and Methods (see Section 2.6.2). 114
Figure 4.11 – Kinetic traces of 10 µM LAz oxidation by NgBCCP in the presence of 100 µM H2O2 at (A) pH
6.0 and (B) pH 7.5, with incresasing concentrations of sodium azide (A: 0, 0.2, 0.5, 1 and 2.5 mM azide; B: 0, 5, 10, 20, 30 and 40 mM azide). As sodium azide concentrations increase, there is a decrease in LAz oxidation rates. Addition of potassium ferrycyanide at the end of the assay fully oxidizes LAz showing that the copper center was not lost. Time was adjusted to the addition of pre-activated NgBCCP, as time 0 s. ... 117
Figure 4.12– (A) Isothermal titration calorimetry of the binding of LAz to NgBCCP equilibrated in 10 mM
MES pH 6.0, 2 mM CaCl2. i) A 1.4 mM LAz solution was titrated into a 30 µM NgBCCP solution. Controls
for the heat of dilution were performed: ii) LAz solution titrated into the equilibration buffer and iii)
equilibration buffer titrated into the final mixture of LAz and NgBCCP. (B) The heat change of the results
obtained in panel (A) for experiment i). The best fit is represented by the black dashed-line that was corrected for the heat of dilution. ... 118
Figure 4.13– Chemical shift variation of LAz resonances upon NgBCCP binding in a 1:1 (A) and 1:2 (B) ratio.
The shifts were categorized into three groups: ΔδHN≥ 0.025 ppm, in red; ΔδHN between 0.015-0.025 ppm in
pink; ΔδHN between 0.005-0.015 ppm in grey. LAz has four proline residues which do not appear in the HSQC
spectra... 120
Figure 4.14– Overlay of the spectral region of the 1H-15N heteronuclear NMR spectra of free LAz (black) and
after addition of one (blue) or two (red) equivalents of NgBCCP. The NH resonance of three of the residues
that experience the high chemical shifts are present in this region. ... 121
Figure 4.15– Mapping of the chemical shifts in Figure 4.13 onto the surface of LAz according to the same color code: ΔδHN≥ 0.025 ppm, in red; ΔδHN between 0.015-0.025 ppm in pink; ΔδHN between 0.005-0.015 ppm
in grey. Proline residues are colored in black. The surface and respective structure are represented from a “side view” of LAz β-barrel with the copper center (orange sphere) on top, and a “top view” facing the copper atom. The residues with larger shifts are distributed along a loop region and a β-strand (β5), highlighted in green in the LAz structure. ... 122
Figure 4.16–Electrostatic and hydrophobic surface of LAz represented from a: (A) “back”, (B) “front” and (C) “top view”. From left to right: the ribbon structural representation of the proteins, the NMR chemical shift mapping, electrostatic surface and hydrophobic surface. The electrostatic surface potential is represented from -5 to 5 KT/e (colored from negative red surface to positive blue surface). The black circle in LAz “top view”(C) indicates the exit site of the dipole moment vector by Met122, which coordinates the copper atom. The hydrophobic surface is colored from non-hydrophobic residues (green) to hydrophobic residues (mangenta). These images were prepared in Discovery Studio except the electrostatic surface, which was rendered in Chimera. ... 123
Figure 4.17– Electrostatic and hydrophobic surface of NgBCCP dimer (A) and monomer in the mixed-valence
Figure 4.18– Docking of LAz in NgBCCP dimer using ZDOCK algorithm. (A) The top 100 solutions are
represented by LAz’s copper atom position (orange/red spheres). The copper atoms within a distance of 20 Å from the E heme iron center are in red. (B) It is presented the distribution of these solutions in each monomer (chain A and B). ... 126
Figure 4.19 – The five docking solutions with highest score obtained by ZDOCK. Only the monomer is represented and the hemes and copper atom are represented as large black and orange spheres, respectively. ... 126
Figure 4.20– Docking of LAz in NgBCCP dimer using BiGGER algorithm. The top 500 solutions according
to (A) global and (B) hydrophobic scores are represented by LAz’s copper atom position (orange/red spheres). In (B) the copper atoms within a distance of 20 Å from the E heme iron center (148 solutions) are in red. (C) It is presented the distribution of these top 148 solutions surrounding each monomer (chain A and B). ... 127
Figure 4.21 – The six docking solutions using BiGGER algorithm, representing clusters of high global and hydrophobic scores. The hemes and copper atom are represented as large black and orange spheres, respectively. ... 128
Figure 4.22– Protein-protein interface surface in the docking models and comparison to the NMR data. (A) Several residues slightly shifted in the NMR spectrum (in green) are located at the proposed protein-protein interface and might be involved in hydrogen bonds across the interface. The residues with larger chemical shifts are located in the loop region (in red) and one, Tyr74, is also at the interface. (B) The protein-protein
interface surface of LAz and NgBCCP was colored according to the frequency of the surface residue in the top
eleven models previously described (>75% models, red; 50 - 75% models, orange; 25 - 50% models, yellow). Comparison with the NMR surface map shows that the “top side” of LAz matching the docking surface, is affected with Tyr74 close to its center, while the loop region is away from the interface surface. ... 130
Figure 4.23– The electron transfer pathway, based on the docking models, starts in the copper atom, passes through His118 and then Gly117 in LAz (purple), directly to the E heme in NgBCCP (blue). ... 131
Figure 5.1 – Molecular structures of quinones that can be found in E. coli cell membranes. Ubiquinone belongs
to the benzoquinone family and it is the major quinone under aerobic conditions. Menaquinone and demethylmenaquinone belong to the naphtoquinone family and are mainly present in the membranes under anaerobic conditions. ... 136
Figure 5.2– Multiple primary sequence alignment of trihemic and dihemic bacterial cytochrome c peroxidases
and secondary structure consensus prediction of YhjA using Jpred 4 (H - helix, B - β-sheet). E. coli (Eco; GI:
586681), A. actinomycetemcomitans (Aga; GI: 122703614), S. enterica (Sae; GI: 380465268), Y. pestis (Yep;
GI: 913031110), Z. mobilis (Zym; GI: 395396769), P. pantotrophus (Pap; GI: 916812477) and N. europaea
(Nie; GI: 30180613). The coloring is in accordance with percentage of identity at each position, from darker color box (100 % identity) to white box (≤ 20 % identity). The sequences are sorted by pairwise identity to
YhjA from E. coli. The underlined residues are the transmembrane helix. Some residues are marked as: (#) the
first residue in the soluble recombinant YhjA, (●) axial ligands of E and P heme (the latest a histidine only
present in dihemic BCCP), (*) calcium binding residues, (■) tryptophan residue between heme domains and (▲) the proposed axial ligands for N heme. ... 139 Figure 5.3 –(A) Elution profile of the size-exclusion chromatography of YhjA (orange line), CT domain (blue line) and NT domain (green line). In grey are the elution profiles of the standard proteins used to estimate the apparent molecular weight of the proteins: Ferritin (Fer, 440 kDa), Aldolase (Ald, 158 kDa), Conalbumin (Con, 75 kDa), Ovalbumin (Ov, 44 kDa), Carbonic Anhydrase (CA, 29 kDa), Ribonuclease A (Rib, 13.7 kDa) and Aprotinin (Apr, 6.5 kDa). (B) Differential scanning calorimetry of YhjA at pH 7.5 in the presence of calcium ions (black line). The thermograms were baseline corrected and normalized for protein concentration. The simulation fitting the data is represented by a blue solid line which is the sum of the two independent models (blue dashed-lines). ... 141
xxiii
Figure 5.5 –Spectroscopic properties of NT domain. (A) UV-visible absorption spectra of NT domain in the as-isolated state (solid line) and dithionite reduced (grey line), in 10 mM HEPES, pH 7.5. The inset shows the
550-750 nm region of the visible spectra. (B) 1H NMR spectrum of reduced NT domain, showing the methyl
of methionine heme ligand down shifted to high field. Spectrum was acquired on a 600 MHz Avance III NMR spectrometer equipped with a cryoprobe, at 298 K in 20 mM phosphate buffer, pH 7.0. (C) X-band EPR spectrum of 0.2 mM as-isolated NT domain in 10 mM HEPES pH 7.5. The asterisk marks a paramagnetic contaminant from the cavity. All spectroscopic features agree with a methionine residue as axial ligand. .. 143
Figure 5.6 –UV-visible absorption spectra of YhjA, in 10 mM HEPES pH 7.5, as-isolated (solid line), in the mixed-valence state (dashed line) and in the mixed-valence state incubated with calcium for 10 min (dotted line). The inset shows the high-spin region of the visible spectra. ... 144
Figure 5.7 –Difference absorption spectra of YhjA in the mixed-valence state, in 10 mM HEPES pH 7.5, upon addition of 1 mM EGTA. The inset shows difference at the high-spin region of the visible spectra. Arrows indicate the direction of changes in the spectra that were acquired over time (0.5, 1.5, 2.5, 5.0, 7.5, 10 and 15 min), as calcium ions were being chelated by EGTA. ... 145
Figure 5.8– UV-visible absorption spectra of the as-isolated YhjA in the presence of six equivalents of H2O2,
in 10 mM HEPES pH 7.5. It is observed a shift of the Soret band from 407 to 410 nm and a decrease in the high-spin absorption bands at 360 nm and 620 nm as shown in the inset. The spectra were recorded at 0, 1, 3, 5 and 10 min after addition of H2O2. ... 145
Figure 5.9– X-band EPR spectra of YhjA and respective simulated data below, in different oxidation states and effect of calcium ions. (A) 0.3 mM YhjA in the oxidized form, (B) after 1 min incubation with Asc/DAD,
(C) after 60 min incubation with Asc/DAD and (D) after 30 min incubation with 2 mM CaCl2 after reduction
with Asc/DAD. The asterisk (*) marks a radical signal the double asterisk (**) a signal that was not assigned, both present in all spectra. The low-spin region of the spectra was amplified 3 times... 147
Figure 5.10 – Potentiometric titration of (A) YhjA and (B) NT at pH 7.5 in the presence of 2 mM CaCl2. The
reductive titration is represented by open circles and the oxidative titration by closed circles. The lines represent the simulation of the potentiometric curve using the reduction potentials listed in Table 5.2 for YhjA and with a reduction potential of + 55 ± 10 mV for the NT domain. ... 150 Figure 5.11 – Kinetic traces of re-oxidation of ABTS2- in the presence of 1 mM H2O2 upon addition of YhjA
in the mixed-valence state (full line) and in as-isolated state (dashed line), in 10 mM HEPES, 10 mM NaCl,
1 mM CaCl2 at pH 7.5 and 25 ºC. In the assays using the as-isolated YhjA without calcium being present in
the assay buffer, the initial rates decrease (solid grey line). Mixed-valence YhjA was prepared by incubating a
stock solution of as-isolated enzyme in 10 mM HEPES pH 7.5, 10 mM NaCl, 2 mM CaCl2, 0.2 mM sodium
ascorbate and 5 µM DAD for 60 min at room temperature. Time zero was adjusted to the time YhjA was added. ... 151
Figure 5.12– Chemical structures of the quinols used in this work: hydroquinone and duroquinol, from the benzoquinone family and menadiol, from the naphtoquinone family. ... 152
Figure 5.13– Steady-state kinetics of YhjA peroxidase activity using ABTS2- (A, open circles), hydroquinone
(A, closed circles), menadiol (B, open squares) and duroquinol (B, closed squares). The pH effect on YhjA catalytic activity was assessed with hydroquinone (C). The dashed lines represent the simulated data using the equations 2.7 and 2.16 from Chapter 2. The results are represented as mean of three replicates and the parameters used in the simulation are the ones listed in the text and in Table 5.3. YhjA used in the kinetic assays was in the as-isolated state. ... 152
Figure 5.14 – Kinetic traces of re-oxidation of different quinols in the presence of 1 mM hydrogen peroxide upon addition of as-isolated YhjA. Electron donors: hydroquinone (solid line), menadiol (dashed line) and duroquinol (dotted line). The traces were corrected for the autoxidation rates of the respective quinol. Assays
were performed in 10 mM HEPES pH 7.5, 10 mM NaCl, 1 mM CaCl2, at 25ºC. Time zero was adjusted to the
Figure 5.15 –Growth curves of E. coli K-12 grown in modified M9 media (A) under anaerobic conditions
supplemented with fumarate (open circles) or nitrate (closed circles) as final electron acceptors and (B) under aerobic (closed circles) or microaerophilic conditions (open circles). The grey areas correspond to the growth stages analyzed by qPCR: 1 – Mid exponential; 2 – Late exponential; 3 – Early stationary; 4 – Stationary (24
h) and 5 – Stationary (32 h). This is an average representation of the growth curves of three biological replicates and the error bars are the standard deviation. ... 155
Figure 5.16–Relative gene expression fold increase in E. coli K-12 under (A) anaerobic growth (fumarate as
electron acceptor) versus aerobic growth, (B) anaerobic growth versus microaerophilic growth, and (C)
microaerophilic growth versus aerobic growth. Data is shown as the ratio of the mean relative expressions,
based on three biological replicates. In (A) and (B) the major differences observed between growth stages for
yhjA are due to variation of the normalized gene expression value in aerobic and microaerophilic conditions
(1.4-6.6) while in anaerobiosis the value is more constant (on average 35). ... 156
Figure 5.17– Relative gene expression of oxidative stress related genes in E. coli K-12 during growth under
anaerobic conditions with either fumarate (A) or nitrate (B) as electron acceptor. (C) Fold change of gene
expression between anaerobic growths with fumarate versus nitrate, as terminal electron acceptor. The gene
expression of each gene was normalized to the 16SrRNA to account for variations in each point taken from
each growth. Data is shown as the mean relative expression based on three biological replicates. ... 157
Figure 5.18 –Decreased survival of E. coli K-12 wild type (WT) and the yhjAnull mutant (ΔyhjA) strains after
30 min of oxidative stress imposed by (A) hydrogen peroxide, (B) tert-butyl peroxide (25 mM in dark grey, 50 mM in light grey bars) or (C) 1 mM cumene hydroperoxide (white bars). Survival is expressed as the percentage of c.f.u. obtained for a non-treated control. The error bars are the standard deviation of three independent experiments. ... 160
Figure 5.19 –Comparison ofinhibition zone diamater of E. coli K-12 wild type (closed circles) and ΔyhjA
(open circles) strains when exposed to various concentrations of cumene hydroperoxide in aerobic or anaerobic environment. The error bars represent the standard deviation for three independent assays. ... 160
Figure 5.20 –Peroxidase activity of 10 µg of cell membranes from E. coli K-12 wild-type (closed circles) and
ΔyhjA knockout mutant (open circles) cells, grown anaerobically and collected in the stationary phase (16 h).
The assay was performed in 100 mM Tris-HCl, pH 7.6 and 2 mM CaCl2 in the presence (A) or absence (B) of
100 µM hydroquinone. The error bars represent the standard deviation of three replicates. ... 161
Figure 5.21 – Proposed model for YhjA role in E. coli when transitioning from an anaerobic to an aerobic
environment. (A) Under anaerobic conditions flavoenzymes, such as aspartate oxidase (NadB, oxidizes aspartate, Asp, to iminosuccinate, Isucc) and fumarate reductase (Frd) reduce fumarate (Fum) to succinate (Succ). Frd, YhjA and other membrane associated reductases, use the reductive power of the quinol pool which is regenerated by dehydrogenases (Dhs). (B) When cells are first exposed to low oxygen tensions, as the fumarate levels decrease, Frd and NadB become significant sources of H2O2. The autoxidation of the
menaquinol (MQH2) also contributes to the increase of ROS. This effect is reduced by cytochrome terminal
oxidases, such as cytochrome bd (Cyd) that act as electron sinks as it reduces O2 to H2O. As anaerobically
expressed enzymes, KatG and YhjA are the first hydrogen peroxide scavengers. Other significant H2O2 sources
upon aeration are still not well characterized.. ... 162
Figure A1.1 – Biochemical characterization of YhjA_6His (data not shown in Chapter 5). (A) Elution profile of the size-exclusion chromatography of YhjA_6His (45 kDa; black line). In grey are the elution profiles of the standard proteins. (B) UV-visible spectra of YhjA_6His in the as-isolated state (solid line) and in the mixed-valence state, reduced with Asc/DAD (dashed line). (C) EPR spectrum of the as-isolated enzyme acquired as described in Chapter 2, Section 2.6.2.2. (D) Steady-state kinetics of YhjA_6His peroxidase activity using 3
mM ABTS2- as electron donor. The data was simulated with a Michaelis-Menten (dashed line) as described in
Chapter 2, Section 2.7 with a KM of 17 mM H2O2 of and Vmax of 0.55 µM ABTS2-.s-1... 191
xxv
Table Index
Table 1.1– Summary of the biochemical properties of BCCPs studied up-to-date... 21
Table 2.1– Sequence of oligonucleotides used for cloning. The restriction sites are underlined, the StrepII-tag sequence is in the grey box and the sequence of the TEV cleavage site in bold. The His-tag sequence is included in the pET22b (+) vector. ... 40
Table 2.2– Statistics of data collection and processing. ... 56
Table 2.3– Sequence of oligonucleotides used in qPCR. ... 60
Table 3.1– Relative amount of spin signal calculated by integration of the simulated high/low-spin signals of each acquired spectrum. ... 77
Table 3.2– Reduction potential of each NgBCCP heme in the reductive and oxidative direction in the presence
of excess, without added (as-isolated) and in the absence of calcium ions (+ EGTA), at pH 7.5. ... 79
Table 3.3– Steady-state kinetics parameters determined for each concentration of cyanide (CN-), azide (N3-)
and imidazole (Im). ... 85
Table 3.4- Comparison of BCCP structures in the oxidized (Ox) and mixed-valence (MV) forms. RMSD was determined for the aligned Cα atoms of the superimposed structures in SuperPose 62. ... 92
Table 4.1 – Examples of type 1 copper proteins, their proposed redox partners, wavelength of maximum absorption (λmax), respective molar extinction coefficient (ɛ) and reduction potentials of the copper centers.
... 106
Table 4.2– Dipole moments for LAz and other type 1 copper proteins. ... 124
Table 4.3– Geometrical and physicochemical characteristics of the top five and six models for ZDOCK and BiGGER docking algorithms, respectively. ... 129
Table 5.1 –Relative amount of spin signal calculated by integration of the simulated high/low-spin signals of each acquired spectrum. ... 148
Table 5.2 –Reduction potential of each YhjA heme in the reductive and oxidative titration, at pH 7.5 in the presence of 2 mM CaCl2. ... 150
xxvii
List of Abbreviations
5c – penta-coordinated 6c – hexa-coordinated
ABTS – 2,2'-azino-bis(3-ethylbenzothiazoline-6-sulphonic acid) ASA – Accessible surface area
Asc – Sodium ascorbate
BCCP – Bacterial cytochrome c peroxidase
BSA – Bovine serum albumin CCP – Cytochrome c peroxidase
c.f.u. – colony-forming unit CT – C-terminal
DAD – Diaminodurol
DSC – Differential scanning calorimetry DTT – Dithiothreitol
Eo′ – Standard reduction potential at specified pH value ED – Electron donor
EDTA – 2,2',2'',2'''-(Ethane-1,2-diyldinitrilo)-tetraacetic acid
EGTA – Ethylene glycol-bis(2-aminoethylether)-N,N,N’,N’-tetraacetic acid EPR – Electron paramagnetic resonance
ET – Electron transfer
FMN – Flavin mononucleotide HALS – Highly axial low-spin
HEPES –4-(2-hydroxyethyl)-1-piperazineethanesulfonic acid HS – High-spin
IR – Infrared
ITC – Isothermal titration calorimetry LAz – Lipid-modified Azurin
LB – Luria-Bertani LS – Low-spin
MCD – Magnetic circular dichroism
MES – 2-(N-morpholino)ethanesulfonic acid
NgBCCP –Neisseria gonorrhoeae bacterial cytochrome c peroxidase
NIR – Near infrared
PCR – Polymerase chain reaction
qPCR – Quantitative real time polymerase chain reaction
QPO – Quinol peroxidase
RMSD – Root mean square deviation ROS – Reactive oxygen species SHE – Standard hydrogen electrode SOD – Superoxide dismutase UV – Ultraviolet
WT – Wild type