Variations in Medical Practices
Identification, Causes and Consequences
Doctoral Programme of Public Health
Specialization in Health Economics
Maria Inês Rodrigues dos Santos Joaquim
Variations in Medical Practices
Identification, Causes and Consequences
This thesis is presented as part of the requirements for the Degree of Doctor of
Public Health, under supervision of Prof. Céu Mateus and Prof. Carla Nunes
i
Tutorial Commission
Prof. Céu Mateus
Division of Health Research, Lancaster University
Prof. Carla Nunes
Escola Nacional de Saúde Pública, Universidade Nova de Lisboa
Prof. Luís Nobre Pereira
iii
Agradecimentos
Não há como não agradecer em primeiro lugar à Prof. Céu Mateus. A minha gratidão vai além da orientação desta tese de doutoramento, uma gratidão que nunca lhe expressei. O convite para trabalhar na Escola Nacional de Saúde Pública, em Novembro de 2010 surgiu num dos momentos mais infelizes pelos quais passei, com toda a carga emocional que representou. Com esta mudança, viria a perspectiva de trabalhar na área que mais me entusiasmava, a área da saúde, viria a perspectiva de realizar o doutoramento e viria um dos períodos de maior crescimento pessoal. A Prof. Céu Mateus foi a responsável pelo muito que aprendi sobre economia da saúde neste período, proporcionando-me o contacto com economistas da saúde de outras instituições internacionais no projecto ECHO, proporcionando a minha participação em diversas Conferências de Economia da Saúde Nacionais e Internacionais e dando-me o privilégio de aprender directamente com ela. Para além da economia da saúde, transmitiu-me os valores de um trabalho bem feito (seja ele em que área), a responsabilidade, o brio e a resiliência necessárias para vingar. Foi, sem dúvida, essencial para que esta tese fosse realizada. Orientou, desafiou, fez a tese acontecer. Quem eu sou hoje, devo em parte à Prof. Céu Mateus.
Em segundo lugar, não posso deixar de agradecer à minha orientadora Prof. Carla Nunes. Mesmo que a ordem dos acontecimentos não ma trouxesse como orientadora “oficial”, a Prof. Carla Nunes era já minha orientadora “oficiosa”. Fazendo parte da equipa portuguesa do projecto ECHO esteve sempre presente no desenvolvimento dos trabalhos da tese. A Prof. Carla Nunes foi o motor para que esta tese chegasse ao fim, comprometendo-me, responsabilizando-me, mas acima de tudo, nunca desistindo de mim e dando sempre um pouco de si para compreender os dias menos bons. Desistir nunca foi opção mas a sua paciência infinita, a compreensão e o carinho demonstrados fizeram a diferença quando o que mais apetecia era fazer parar o processo.
This PhD thesis was integrated in the European Collaboration for Health Optimization (ECHO) project funded by the European Commission's Seventh Framework Programme (FP7/2007-2013) under grant agreement n°242189. ECHO project was also the promoter of the international database that was used in this PhD thesis and without this database this PhD thesis would not be possible. To all ECHO colleagues, it was a privilege to meet you, to take part of the discussions and to learn with your experience: Anne-Marie Yazbeck, Carla Nunes, Céu Mateus, Enrique Bernal-Delgado, Jeni Bremner, Jörg Munck, Karen Bloor, Lau Thygesen, Nils Gutacker, Olivia Dix, Paul Giepmens, Ramón Launa-Garcés, Richard Cookson, Sandra Garcia-Armesto and Terkel Christiansen.
iv Um agradecimento também ao Prof. Pedro Pita Barros pelos comentários detalhados ao trabalho “The impact of hospital characteristics on the avoidable c-sections”.
Um estudante de doutoramento nunca está só e nunca não tem nada para fazer, a tese é uma presença constante. Amigos, colegas e familiares convivem não apenas com o estudante de doutoramento mas também com a sua tese e por isso, há várias pessoas que não tendo tido uma contribuição directa para a tese de doutoramento fizeram a diferença neste processo e a quem eu quero agradecer.
À minha grande mestre Mónica Inês que acreditou sempre que eu poderia ter um lugar na Economia da Saúde em Portugal, que me proporcionou muitas gargalhadas e boa disposição e nunca deixou de me motivar.
Aos meus colegas de doutoramento, Hugo Lopes e Vanessa Ribeiro e às minhas colegas da Escola Nacional de Saúde Pública, Joana Alves, Klára Dimitrovová, Cláudia Furtado, Patrícia Marques e Carolina Santos. São possivelmente as pessoas que melhor compreendem o processo, seja porque o estavam a viver em simultâneo, seja porque já o tinham vivido. A partilha de experiências e o seu apoio foi fundamental.
A todos os colegas da Medtronic que vendo-me a fazer serão sempre exprimiram uma palavra de incentivo e que sempre me motivaram a terminar o doutoramento, Inês Lucena, Joana Albuquerque, Margarida Noronha, Paulo Almeida e Susana Pereira. Um especial agradecimento ao Luís Pereira que foi não só um motivador e um conselheiro mas também criou uma competição saudável entre nós que me fez avançar nos trabalhos.
À minha família do coração por estarem lá quando é preciso, Ana Freitas, Clara Duarte, Cláudia Canedo, Filipe Abreu, Inês Almeida, Liliana Elsig, Rita Silva e Tânia Barquinha.
Devo também um agradecimento especial à minha colega e amiga Joana Alves. O que diga vai ser sempre pouco para expressar a gratidão que tenho para com ela. A Joana tornou-se mais do que minha colega de gabinete. Foi amiga, foi confidente, foi apoio moral e foi o meu mais prestável recurso para resposta a perguntas que me levariam bastante tempo a ser respondidas. Mas a Joana foi, e é, sobretudo, um grande exemplo para mim, tanto a nível pessoal como a nível profissional. Obrigada por tudo!
Aos meus pais, que me ensinaram o privilégio de estudar, e aos meus irmãos, agradeço toda a educação e conselhos que me deram ao longo da vida, a compreensão pelas ausências, o apoio e a paciência nos dias menos bons. São eles o meu maior exemplo de amor incondicional.
v
Abstract
Background: Unwarranted variations in healthcare are thought to describe healthcare provision beyond what is clinically necessary and without additional clinical benefits raising concerns on quality, equity and efficiency of healthcare systems. This thesis aims to 1) identify geographical variations in Portugal and research on the potential of identification of geographical variations to optimize care; 2) understand how hospital characteristics affect provision of healthcare; 3) use stochastic frontier analysis to estimate innefficiencies resulting from non-optimal care and compare hospitals.
Methods: Firstly, nine healthcare activities performed in Portuguese National Health Service hospitals between 2002 and 2009 were analyzed according to area of residence of patients. Secondly, low-risk c-sections geographical variation and excess consumption was compared between five European countries. Thirdly, avoidable c-section rates are computed for Portuguese hospitals and hospital characteristics are studied to understand how they affect those rates. Fourthly, advantages and drawbacks of stochastic frontier analysis method for healthcare efficiency measurement are studied. Fifthly, stochastic frontier analysis is applied to healthcare activity of four European countries to compare hospital efficiency levels within and between countries.
Results: Variations in medical practice exist in Portugal but their magnitude and evolution varies with the procedure in analysis. Portugal’s performance on international comparisons depend on the scope of the procedure. Availability of resources affect medical practice in a modest extent. SFA is a good analytical tool to compare hospital’s efficiency levels. Efficiency levels of Portuguese hospitals are not homogenous even though inefficiencies can be attributed to random shocks out of hospital control.
Conclusions: The identification of variations in medical practice provides signals on where clinical harmonization is required while international comparisons provide benchmarking that flags improvement opportunities. Resources affect medical practice in a modest extent and so, policies on resource affection may result in modest results. Policies on medical incentives towards an objective may be more effective than common policies on resource reduction. More than looking towards an optimal threshold of care we shall guarantee that care is provided to who can benefit from it and look towards clinical outcomes optimization.
vii
Resumo
Contexto: Identificar variações não desejadas da prática médica é identificar cuidados de saúde prestados além do que é clinicamente necessário e sem benefício clínico adicional, com implicações ao nível da qualidade, equidade e eficiência do sistema de saúde. Esta tese tem como objectivos: 1) identificar variações geográficas da prática médica em Portugal e potenciar essa identificação para optimização dos cuidados prestados; 2) compreender como é que as características dos hospitais afectam os cuidados prestados; 3) utilizar a análise de fronteira estocástica no cálculo da ineficiência gerada pela não-optimização dos cuidados e comparar hospitais.
Métodos: Primeiro foram analisados nove procedimentos realizados nos hospitais do Serviço Nacional de Saúde entre 2002 e 2009 tendo em consideração o local de residência dos doentes. De seguida, considerando apenas as cesarianas de baixo risco foi analisado para além das variações geográficas, a realização em excesso deste tipo de procedimentos e comparados os resultados de cinco países europeus. Seguiu-se uma análise às taxas de cesarianas evitáveis e de que forma as características dos hospitais se relacionam com estas. Por fim, foram estudadas as vantagens e limitações da análise de fronteira estocástica no cálculo da eficiência hospitalar e aplicou-se este método no cálculo da eficiência dos hospitais de quatro países europeus.
Resultados: Em Portugal, existem variações da prática médica embora a sua magnitude e evolução varie conforme o procedimento em análise. O desempenho de Portugal em comparação com outros países europeus também depende do procedimento e da própria definição do âmbito do procedimento. A disponibilidade de recursos afecta a prática médica de forma modesta. A análise de fronteira estocástica é uma boa ferramenta para estimar e comparar níveis de eficiência dos hospitais. Em Portugal, os níveis de eficiência não são homogéneos entre hospitais embora as ineficiências possam ser atribuídas a factores externos e aleatórios fora do controlo dos hospitais.
Conclusões: A identificação das variações da prática médica indica as áreas onde algum tipo de harmonização clínica é necessária e as comparações internacionais identificam áreas com potencial de melhoria. A disponibilidade de recursos afecta a prática médica de forma modesta pelo que políticas de saúde de redução de recursos poderão, também elas, ter resultados modestos. Políticas de saúde com incentivos dirigidos aos médicos poderão ser mais eficientes na homogeneização da prática médica. Mais do que definir um nível de actividade óptimo urge garantir que os cuidados de saúde são dirigidos a quem beneficia deles optimizando os resultados clínicos.
ix
Contents
Tutorial Commission ... i
Agradecimentos ... iii
Abstract ... v
Resumo ... vii
Contents ... ix
List of Tables ... xi
List of Figures ... xiii
List of Acronyms ... xv
1. Introduction ... 1
2. Background ... 5
2.1. Small Area Variations ... 5
2.1.1. Methods to analyze SAV ... 8
2.1.2. Main Findings on SAV ... 12
2.1.3. Supply-induced demand ... 15
2.1.4. Addressing geographical variations... 21
2.2. Efficiency ... 22
2.2.1. Methods to estimate technical efficiency ... 24
2.2.2. Measuring outputs and inputs ... 29
3. Objectives ... 31
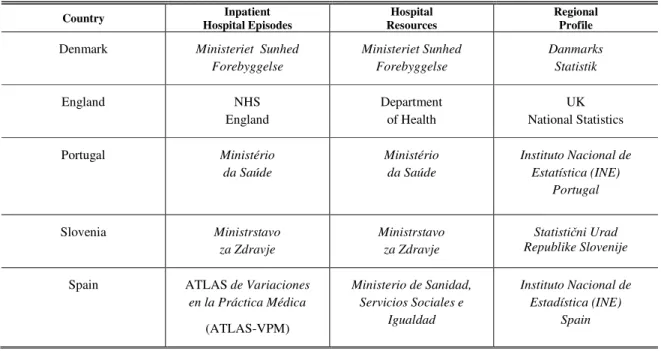
4. Data Sources ... 33
4.1. Sources and data availability ... 33
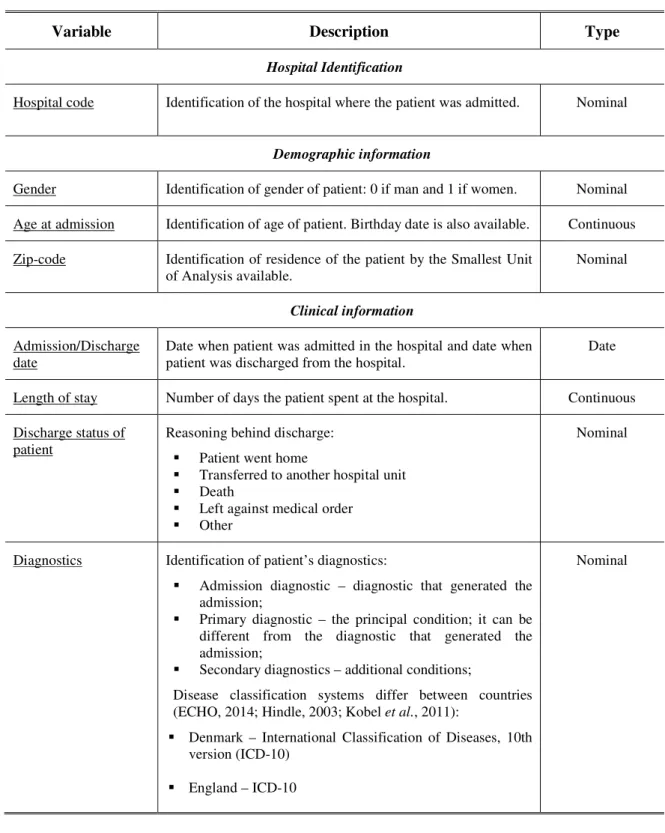
4.2. Inpatient hospital episodes ... 34
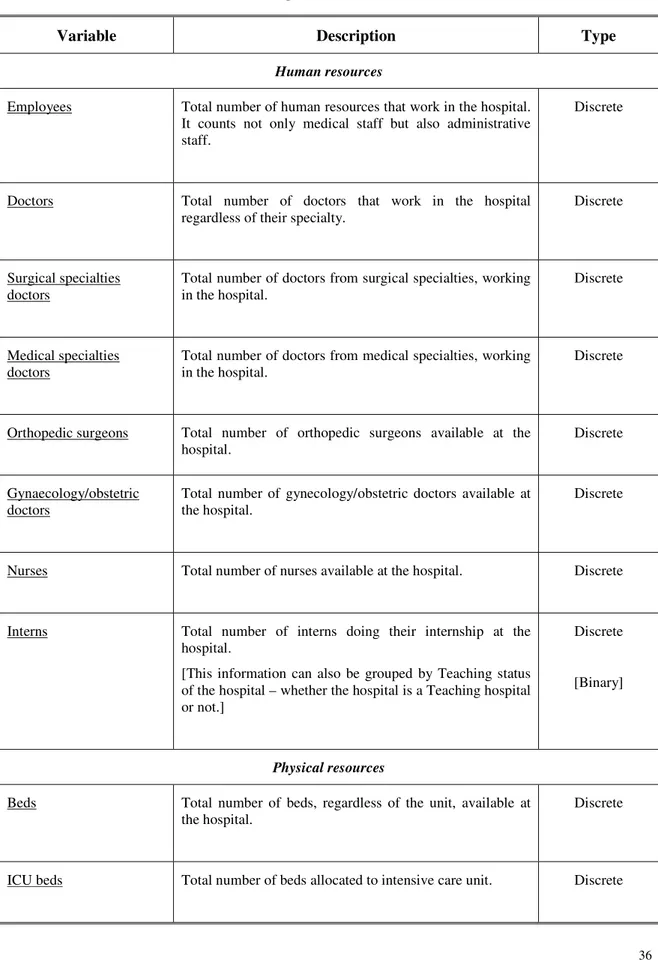
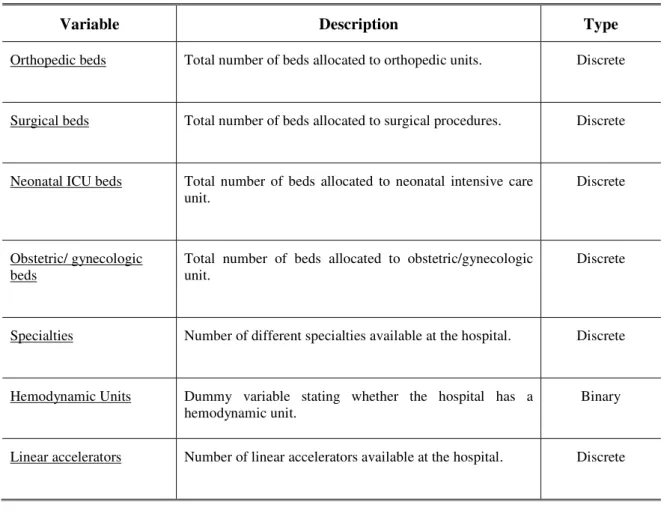
4.3. Hospital resources ... 35
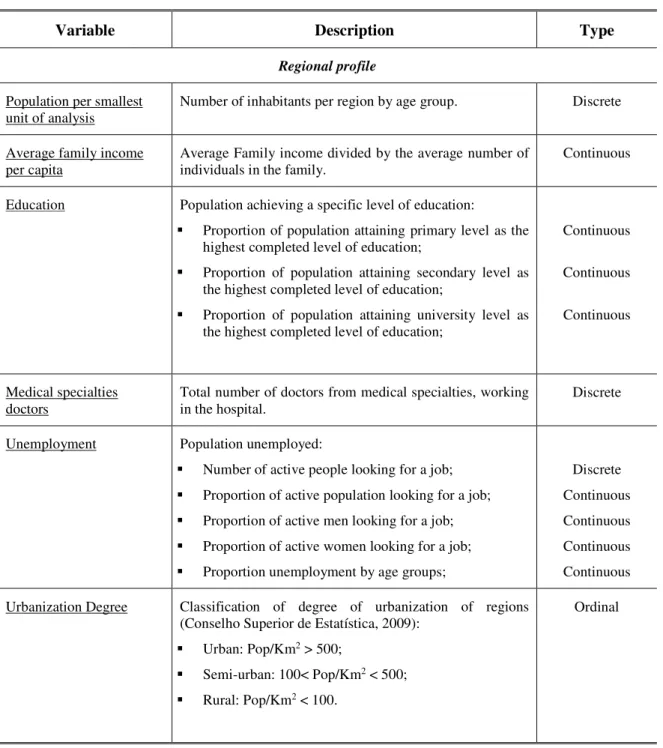
4.4. Regional profile ... 37
4.5. Structure of data ... 38
5. Results ... 41
Portugal: Geographic variations in health care (Work 1) ... 43
x
Hospital characteristics and Avoidable C-sections: a decade analysis (Work 3) ... 81
What have we learnt on measuring hospital efficiency when stochastic frontier analysis is used – Lessons from previous studies (Work 4) ... 99
Measuring hospital efficiency – comparing four European countries (Work 5) ... 125
6. Discussion ... 135
7. Conclusions ... 149
xi
List of Tables
Table 1: Research work corresponding to each objective ... 32
Table 2: Sources of data ... 33
Table 3: Inpatient hospital episodes data details ... 34
Table 4: Hospital resources data details ... 36
Table 5: Smallest Units of Analysis in ECHO database ... 37
xiii
List of Figures
Figure 1: Structure of the thesis ... 3
Figure 2: Graphic representation of Income-Leisure trade-off ... 16
Figure 3: Graphic representation of Income-Inducement trade-off ... 17
Figure 4: Technical and Allocative Efficiency ... 25
Figure 5: Estimation of inefficiency ... 26
xv
List of Acronyms
ACHI Australian Classification for Health Interventions
A-CS Avoidable C-section
A-CSR Avoidable C-section rate
AP-DRG All-Patient Diagnostic Related Groups
APR-DRG All-Patient Refined Diagnostic Related Groups AR-DRG Australian Refined Diagnostic Related Groups ATLAS-VPM Atlas de Variaciones en la Práctica Médica CABG Coronary Artery Bypass Grafting
C-Sections Caesarean Section
CSR C-section rate
CV Coefficient of Variation
DEA Data Envelopment Analysis
Dk NordDRG Danish patient classification system
DRG Diagnostic Related Groups
EB Empirical Bayes
ECHO European Collaboration for Health Optimization
EuroHOPE European Healthcare Optimization, Performance and Efficiency
HRG Healthcare Resource Groups
ICD-10 International Classification of Diseases, 10th version
ICD-10-CM International Classification of Diseases, 10th version, Australian Modification
ICD-9-CM International Classification of Diseases, 9th version, Clinical Modification
ICU Intensive Care Unit
INE Instituto Nacional de Estatística
NCSP NOMESCO Classification of Surgical Procedures
NHS National Health Services
NICE National Institute for Health and Care Excellence NOMESCO Nordic Medico-Statistical Committee
NTSV Nulliparous, Term, Singleton, Vertex
xvi OPCS Office of Population Censuses and Surveys
PID Physician-Induced Demand
PROMs Patient Reported Outcomes Measures
PTCA Percutaneous Transluminal Coronary Angioplasty
SAV Small Area Variations
SCV Systematic Component of Variation SFA Stochastic Frontier Analysis
SID Supply-Induced Demand
UK United Kingdom
VR Variation Ratio
W1 Work 1
W2 Work 2
W3 Work 3
W4 Work 4
W5 Work 5
1
1.
Introduction
Jack Worm, 63 years-old lives in Strawberry Fields in Fruitland. In another city of Fruitland, Plum Mountain, lives John Bug also 63 years-old. In a rainy day, after the Great Harvest Festival, the most important holiday in Fruitland, both are hospitalized for an acute ischemic stroke (AMI), Jack Worm in Hospital of Strawberries and John Bug in Saint Plum’s Hospital. Although it was expected the same treatment for both Jack and John, treatments, length of stay and outcomes differed without any apparent reason apart from medical decision.
Differences in medical treatment were first noticed by Glover (1938) but it was in the 70s that this topic has started to boom (Glover, 1938; Wennberg, 2014). After the work of Wennberg & Gittelsohn (1973) which identified a great variation of tonsillectomies across the State of Vermont, a large number of other studies have found identic differences in several procedures (Corallo et al., 2014; Srivastava et al., 2014; Wennberg e Gittelsohn, 1973; Wennberg, 2014). For the last 40 years researchers have tried to explain the phenomena nominated unwarranted variations – variations that are not desired – in healthcare provision both geographically and hospital based creating a vast literature and a specific literature topic called Small Area Variations (SAV).
These unwarranted variations are thought to describe healthcare provision beyond what is clinically necessary – and without additional clinical benefits – raising concerns on the quality, equity and efficiency of healthcare systems (Peiró e Maynard, 2015; Srivastava et al., 2014).
The studies evolved from the identification of variations in specific procedures to the identification of variations on overall healthcare services and the study of underlying differences in populations as well as the causes of SAV.
Reasoning behind SAV is not consensual because while some researchers state that geographical variations are a matter of population differences others find that even controlling for differences in population, much variation remains to be explained.
2 If, in fact, the underlying factors affecting geographic variations have less to do with populations’ characteristics and more with supply factors such as clinical practice, then policies should focus not on the demand side but on the supply side. Understanding the causes for geographical variations is essential to design effective policies on the reduction of these variations.
While the assessment of geographical variations was first studied to understand the differences in healthcare services provision, these studies proved to be a tool to understand whether there is inappropriate care that is source of inefficiency and waste. Providing value for the money invested is essential when scarcity of resources and the need to become even more efficient are the focus of decision-makers.
SAV studies have revealed that some geographical areas are over or under treating their populations inducing welfare losses. Although both under and overuse induce welfare losses, the fast growth of the health expenditure of developed countries suggest that overuse is playing a greater role in resource wasting. In fact, in the last decades, spending in healthcare sector has been increasing without better results or improved quality in the services provided. Estimates suggest that about 30% of all healthcare spending derive from services that could have been avoided (Berwick e Hackbarth, 2012).
Geographical variations, if not justified by population characteristics, generate inefficiencies in healthcare institutions and healthcare systems as a whole (Pauly, 1980). Comparing similar geographies, institutions and healthcare systems provide some tools to address the efficiency or inefficiency compared to peers.
Although international comparisons on efficiency of healthcare systems have been developed since some decades on a macro level (Oxley e MacFarlen, 1994), the lack of comparable patient-level data has limited the development of international comparisons of efficiency of healthcare systems at a micro-level. Different approaches have been used trying to overcome these limitations, namely through research projects based on international datasets. As examples, two European projects are here referred: European Collaboration for Health Optimization (ECHO) and European Health Care Optimization, Performance and Efficiency (EuroHOPE). These two projects worked on the development of international patient-level databases with comparable data (ECHO, EuroHOPE; Peiró & Maynard, 2015; Sund & Häkkinen, 2016).
This thesis aims to fill in two gaps in the literature of geographical variations: 1) to estimate geographical variations in healthcare in Portugal; 2) to produce international comparisons on procedures rates and efficiency that were limited until now. To fulfill these objectives the international database developed by ECHO is used.
3 Identification framework recognizes the issue; whether there are variations or not and measures the magnitude of variations. Studying the causes helps to understand the reasoning behind the variations, what the incentives are and what is driving the variations. Finally, consequences of variations in medical practice are studied in the form of efficiency measures.
The study of these three elements resulted in five works (W) that provide an integrated view of the variations in medical practice (Figure 1). For the identification section there is a work that identifies geographical variations in Portugal (W1) and research on the potential of identification of geographical variations to optimize care (W2). A work on the impact of hospital characteristics on avoidable C-sections (W3) contributes to the question on the causes for geographic variation. Finally, two works on Stochastic Frontier Analysis (SFA) have been developed to estimate the consequences of geographic variations. A more theoretical work (W4) studies this methodology for efficiency estimation and then this methodology is applied to compare hospitals from 4 countries (W5).
Figure 1: Structure of the thesis
VARIATIONS IN MEDICAL PRACTICE
IDENTIFICATION Identifying the issue and measuring it to establish objectives on its reduction.
CAUSES
Understanding what is driving variations in medical practice as a tool to manage it.
CONSEQUENCES Measuring innefficiency arising from medical practice variations.
W1: Portugal: Geographic variations in health care
W2: Potential of geographical variation analysis for realigning providers to value-based care.
W3: The impact of hospital
characteristics on avoidable C-sections
W4: Estimating hospital efficiency using SFA – Lessons from previous studies
5
2.
Background
This chapter is organized in two different sections: Small Area Variations (SAV) and Efficiency.
In the first section, an introduction to the history of SAV research is provided as well as methodologies and the main findings on the topic. Supply-induced demand is also explored and a section on different approaches to reduce SAV concludes the topic.
The second section defines efficiency and identifies its different approaches. The section continues with methodologies to estimate efficiency and to compare healthcare units and how outputs and inputs can be estimated.
2.1.
Small Area Variations
Theory on SAV has been developing since the 70s with assessment of variations in resource input, utilization of services and expenditures between neighbor communities. The work of Glover (1938) on rates of tonsillectomy in England had already identified wide variations that were not justified by population or ill-defined characteristics but instead seemed to be based on medical opinions and practices. But it was the work of Wennberg & Gittelsohn (1973) that launched the basis for the development of SAV as research topic in the last forty years (Chandra, Cutler e Song, 2011; Glover, 1938; Peiró e Maynard, 2015; Srivastava et al., 2014; Sundmacher e Busse, 2014; Wennberg e Gittelsohn, 1973).
In the words of Wennberg (2014), the uncovering of variations found in the State of Vermont led him to think that the problems of the healthcare systems were more deep than the barriers to the diffusion of technologies and innovations. In fact, there was much variation that could not be explained by illness, patient’s preferences or medical science. Researchers named these variations – unwarranted variations (Wennberg e Fowler, 1977; Wennberg e Gittelsohn, 1973).
A contribution to the expansion of this topic was the creation of The Dartmouth Atlas of Health Care as a strategy to create awareness on the topics of geographical variation (Peiró e Maynard, 2015; Wennberg e Cooper, 1996; Wennberg, 2014). The works developed intended to characterize and measure the variations and to improve the understanding of the causes and consequences of variation in the delivery of healthcare. Additionally, works on the topic would expand policy research on how to address these variations, namely, through the development of theory of supply-induced demand (Peiró e Maynard, 2015; Wennberg, 2014).
6 Australia, New Zealand and Canada have also analyzed practice variations as well as European countries such as Spain, England and Germany which have created their own Atlases1 during the last decade (OECD, 2014; Peiró e Maynard, 2015; Wennberg, 2014). The Organization for Economic Cooperation and Development (OECD) has also studied and compiled information on 13 countries in a recent report (OECD, 2014).
A common effort of several European countries through the project ECHO has given a step further by combining national hospital databases in order to move from a national perspective to a cross-country perspective enabling international comparisons of healthcare (Bernal-Delgado et al., 2015; ECHO, 2014; Peiró e Maynard, 2015).
In Portugal, studies on this topic have been inexistent until the emergence of the two projects mentioned above in which Portugal was involved (Bernal-Delgado et al., 2015; ECHO, 2014; Mateus et al., 2014).
Variations in medical practice are not, in most of the cases, desirable. Variations usually express differences in clinical practice, successful increase of healthcare provision that may not be necessary or inequity in access to healthcare generating concerns on the equity and efficiency of healthcare systems (Cylus, Papanicolas e Smith, 2016; Srivastava et al., 2014). In any case, variations may indicate that inappropriate care is being delivered (Cylus et al., 2016; Folland, Goodman e Stano, 2013).
Healthcare systems evaluation – effectiveness, quality, efficiency and equity, though, is usually done through aggregate indicators which undermine the correct evaluation of public health policies and difficult the identification of areas or providers that may be generating this inappropriate care (Baicker e Chandra, 2004; Chandra et al., 2011; Fisher et al., 2003; Ridao-López et al., 2012). Analysis of SAV disentangles these aggregate indicators and identifies individually the results of healthcare policies generating important information for policies evaluation that cannot be correctly assessed by analysis of aggregate indicators (Ridao-López et al., 2012). If ineffective care is not correctly identified, determined and measured information is not correctly telling whether the investment is worthy (Ridao-López et al., 2012).
These analyses are relevant in a context where healthcare systems are more and more pursuing value for money and making sure their investments are producing valuable outcomes for patients and populations.
1 “Atlas de variaciones en la práctica médica en el Sistema Nacional de Salud, 2006 [The Atlas of Medical
Practice Variation in the Spanish National Health System]”
7 If variations in healthcare are indicative of inappropriate care then these variations are a signal of poor quality patient care with implications on safety and public health (Peiró e Maynard, 2015).
From the point of view of public health, inappropriate care might mean that some populations are being exposed to excess healthcare without clear benefits and potential risks or, on the other hand, populations are being undertreated and lacking healthcare services they need. In any of the cases, losses are being incurred: populations are not receiving the healthcare they need or valuable resources are being wasted or could be better allocated (Cylus e Pearson, 2016; Sirovich et al., 2006; Wennberg, 2002). Additionally, geography, only, should not be the determinant of healthcare utilization. Given the concern with the health of the community as a whole, it is of public health interest that all populations are served similarly – given the populations characteristics – at an optimal point.
From a health economics point of view, identifying regional variations in medical practice is to recognize that there are unwarranted variations and health spending that may not be translating into additional outcomes and are inducing welfare losses (Peiró e Maynard, 2015). These non-optimal practices are a source of waste and inefficiencies. The reduction of these unwarranted variations could potentially reduce healthcare spending by eliminating healthcare provision that is not necessary (without affecting patient’s health), redirect these resources to beneficially treat other patients and improving the quality of care (Colla et al., 2014; Folland et al., 2013; Peiró e Maynard, 2015; Srivastava et al., 2014).
Studies on SAV account for measures of variation across geographical units or providers but this research topic has tried to understand the reasoning behind these variations. Analyses focus on the geography of patients or the institutions they are treated in and look for reasons for the differences in practice, resources availability, reimbursement and financial incentives, factors that differ more than differences in patient population, differences in medical need or differences in patients’ own socioeconomic conditions (Ridao-López et al., 2012; Wennberg e Fowler, 1977; Wennberg e Gittelsohn, 1973). While some variation can be expected given case-mix and patient’s preferences, SAV studies have the potential to address differences that depend solely on factors other than demand itself (Chandra et al., 2011; Wennberg, Freeman e Culp, 1987; Wennberg e Gittelsohn, 1982).
8 part of variation whether it is in utilization rates or healthcare spending (Ridao-López et al., 2012).
SAV studies enable not only the measurement of the variations across regions but also the identification of these geographical areas, or providers, that consistently and systematically provide care above the expected (Bernal-Delgado, García-Armesto e Peiró, 2014; Colla et al., 2014; Ridao-López et al., 2012). This is especially relevant when talking about procedures that do not bring additional benefit and may be inputting additional costs on the healthcare systems systematically. Corrective policies can be designed when a problem is correctly identified and this information is of major importance to policies’ evaluation (Bernal-Delgado et al., 2014; Colla et al., 2014; Ridao-López et al., 2012).
Some caution on the interpretation of these differences shall be taken, especially when considering that clinical practice and physicians’ decision depend solely on their beliefs (Chandra et al., 2011). Green & Becker (1994), for example, found that variations between geographic areas were not supply-related but instead due to patient’s choice on the use of hospital emergency room (Green e Becker, 1994). This finding encloses an important limitation of these studies, SAV may not necessarily mean variation in supply-related factors but instead that other differences in population-related characteristics are not being controlled by standardization and effectively excluded (Folland et al., 2013; Green e Becker, 1994; Ridao-López et al., 2012).
2.1.1. Methods to analyze SAV
According to Volinn, Diehr, Ciol, & Loeser (1994), seven questions should be addresses when assessing variations in medical practice in order to provide useful and relevant information to physicians and policy makers working in this area: 1) What events are to be analysed? 2) What geographic units are to be analysed? 3) How good is the data? 4) Are differences in rates due to chance alone? 5) Are high rates too high? 6) How is a geographic variation to be explained? 7) What is the role of presentation style in explaining geographic variation?
9 In the case of geographical perspective, the choice of geographic units is not indifferent in the assessment of variations (Srivastava et al., 2014). Analyzing variations in larger areas will result in less variation than when analyzing smaller areas. This happens because, statistically, larger areas utilization rates will be closer to national average than utilization rates of smaller geographical areas (Baicker et al., 2004; Chandra et al., 2011; Fisher et al., 2003; Srivastava et al., 2014) resulting in the smoothing of variations. The choice of the geographical unit shall take this statistical issue in consideration as well as the meaningful geographical unit that is intended to study (Ridao-López et al., 2012).
A limitation from geographic perspective is the possibility that patients receive healthcare in a different geographical area other than that of residence. In these cases, healthcare utilization rate is not truly linked to the place of residence and in many cases it cannot be disentangled in the data and information is lost (Srivastava et al., 2014).
The second step in the analysis is to define which healthcare provision is going to be studied.
Variations of medical practice are less noticeable in interventions with clear reasons to be performed. Some interventions are prone to subjective judgment and thus derive into variations between regions, hospitals, schools of thought, etc. This is called the gray area of medicine (Chandra et al., 2011; Phelps e Mooney, 1993). According to Chandra et al., 2011 there are three attributes for this gray area: scarcity of clinical guidelines, the small probability of harm to patients and idiosyncrasy of clinical benefit.
10 From these defined frameworks, lessons on the importance of clinical evidence for the reductions of variations are learned. Procedures and activities with good clinical evidence affect clinical practice by harmonizing them and thus reducing variations (Srivastava et al., 2014). Researchers may choose to select a list of procedures and compare them in terms of variability or focus on a specific category of healthcare.
Having defined the point of view of the analysis (population/geographic vs hospital/provider specific) and which procedures to study, the last step on the analysis of unwarranted variations is to define how to quantify variations.
The first common step is the standardization of utilization rates of different geographical areas to accommodate for the differences in population structures and characteristics that may affect crude utilization rates, i.e., if the scope of analysis is a procedure that is more common in women than in men and there is a population with a bigger proportion of women it is expected that the rates of the procedure in that population are greater than in the population with lower proportion of women. Age and sex are the characteristics more commonly used. In the standardization process, corrections on these differences are performed and rates are standardized to assume a similar population structure between geographic areas.
Standardization can be done by two processes: direct or indirect standardization.
Direct standardization computes the expected rates of geographic areas had this specific area had the structure of the overall population (sum of the population of all geographic areas considered) (Atlas de Variaciones en la Práctica Médica; Curtin e Klein, 1995; Pan-American Health Organization, 2002). This method defines what the rate would be if the distribution of the geographic area was like the national distribution (or the distribution of the sum of all geographic areas).
If standardizing for age group ( ) and sex ( ), mathematically, direct standardization for each geographic area is given by:
, × ,
,
Sources: Curtin and Klein 1995; “Standardization: A Classic Epidemiological Method for the Comparison of Rates.” 2002; Atlas de Variaciones en la Práctica Médica, n.d.
11 overall population considered (sum of all geographic units) (Atlas de Variaciones en la Práctica Médica, [s.d.]; Curtin e Klein, 1995; Pan-American Health Organization, 2002).
Mathematically, indirect standardization for each geographic unit is given by:
. ℎ ℎ , × .. ,
,
Sources: Curtin and Klein 1995; “Standardization: A Classic Epidemiological Method for the Comparison of Rates.” 2002; Atlas de Variaciones en la Práctica Médica, n.d.
Having the utilization rates standardized for the population characteristics, researchers have commonly used the Coefficient of Variation (CV), the Variation Ratio (VR) or more sophisticated techniques such as Systematic Component of Variation (SCV) or the Empirical Bayes (EB) to measure SAV (Folland et al., 2013; Phelps e Mooney, 1993; Ridao-López et al., 2012).
CV, computed as the ratio between standard deviation and the mean, will adjust utilization rates to their relative sizes, i.e., when comparing utilization rates of different procedures, variation in the utilization rates of these procedures can now be compared (Folland et al., 2013; Phelps e Mooney, 1993). When using this method, low variation is set between 0,1 and 0,15 while high variation is defined as a CV around 0,5 or above (Phelps e Mooney, 1993). Excess use of a procedure is estimated as the difference between the utilization rate at a specific geographic unit in study and the average (Phelps e Mooney, 1993).
The VR, used for example in Ridao-López et al. (2012), is computed as the ratio between utilization rates of 95%-5%, 75%-25% percentiles or any other percentiles of interest for the researchers. Excess procedures are then computed as the difference between utilization rates of geographic units and the 5% or 25% percentiles (Ridao-López et al., 2012).
12 SCV method by giving some weight to the observed rate of the different areas. It results in a weighted average where areas with more reliable observed rates – areas with more observations – have greater weights (McPherson et al., 1982; Shwartz et al., 1994).
If is the observed rate for geographic unit , and the expected rate given population characteristics, and k is the number of geographic units in analysis, the SCV is given by:
!"# = % − '
(
) −
*, 1
)
,
Sources: McPherson et al. 1982; Shwartz et al. 1994
The EB estimation is then given by:
- =* ./
01231 31 4
5 6 01
731859:1 ;
1<=
*;1<=:1 and > = * (.?@601 3159 ,
Sources: McPherson et al. 1982; Shwartz et al. 1994
The rationale of these indicators is that values that do not differ from 0 reveal small systematic variation and thus variations are random and given by chance. However how much variation is too much is still subjective. More important is the measurement of excess practice or poor-quality practice that can be avoided and consequently reduce costs.
Poor quality practice has been measured through the identification of failures of care delivery such as adverse events and worse clinical outcomes. Excess practice or overtreatment can be measured by identifying an optimal level of practice given the populations characteristics and measure the difference between this optimal level and the observed level of healthcare provision as in Ridao-López et al. (2012). This leads to the possibility of estimating how much money can be saved or better allocated.
2.1.2. Main Findings on SAV
13 In 1977, Wennberg & Fowler results showed that variations across geographic units could not be explained by population preferences and behaviors (Wennberg e Fowler, 1977), while in 1984, Wennberg presented a work that pointed out the great disparity in the rates of medical treatments, diagnostic tests and surgical procedures in Hospital markets (Wennberg, 1984).
In 1993, non-surgical hospital admissions were identified by Phelps & Mooney as having higher variability than other healthcare services suggesting that there are healthcare services more prone to variability than others (Phelps e Mooney, 1993). The same work revealed that differences in disease incidence and socioeconomic factors were shown to not explain more than a small fraction of the variability found between regions (Phelps e Mooney, 1993).
In 1998, Skinner & Wennberg give a step further by addressing not procedure rates but healthcare spending and clinical outcomes. In this research, regional survival rates were not correlated with more intensive healthcare spending (Skinner, J e Wennberg, 1998).
This study is complemented by the fact that patients tend to prefer less intensive treatments, i.e., not only are healthcare systems increasing healthcare spending without clinical benefits but also physician’s choice of treatment is not matching patients’ preferences (Skinner, J e Wennberg, 1998).
Again on consumer behavior, Yasaitis, Bynum, & Skinner (2013) identify some differences driven by health status and race but these factors appeared to explain very little of the differences between frequency of office visits (Yasaitis et al., 2013).
In 2015, a work by Ralston, Harrison, Wasserman, & Goodman showed that even after taking medical complexity in account patterns of utilization in children healthcare presented wide variations suggesting that promotion of guidelines and best practices is a need (Ralston et al., 2015).
14 Nevertheless, the extended work of OECD on 13 countries revealed that geographic variation in healthcare use persists after considering differences in demographic structure of the regions showing that this is a phenomenon common across countries (Srivastava et al., 2014).
Broadly speaking research on this topic has revealed that some variations are too large and cannot be explained alone by illness severity or patient preferences (Anthony et al., 2009; Appleby et al., 2011; Baicker et al., 2004; Chandra et al., 2011; Corallo et al., 2014; Hart e Holmstrom, 2010; IOM, 2013; Peiró e Maynard, 2015; Sundmacher e Busse, 2014; Wennberg, 2002). There is evidence that populations exposed to higher rates of use of services do not have longer life expectancy (Peiró e Maynard, 2015; Sirovich et al., 2006; Wennberg, 2002), on the opposite, it seems that overusing health services is not producing better results but instead wasting resources that could be better allocated (Peiró e Maynard, 2015; Sirovich et al., 2006; Srivastava et al., 2014; Wennberg, 2002).
Several researchers have tried to address the reasoning behind these geographic variations other than population-based, focusing on market and supply factors mainly.
Regarding healthcare market, in the last decades there has been significant changes with the modification of morbidity patterns towards chronic conditions and the rapid adoption of technological innovation (Peiró e Maynard, 2015). But it is the misuse of new technologies that are, probably, promoting the over and underuse of healthcare services increasing geographic variations (Peiró e Maynard, 2015).
This is corroborated by the works of several authors that report that technological diffusion, availability of specialists, local training framework that differ across regions are contribution to variations in clinical practice (Birkmeyer et al., 2013). In fact, this is expected when physicians themselves are not consistent on their opinions on the value or need of a therapy (Wennberg e Fowler, 1977). Wennberg (1984) suggests that variations are related to the uncertainty of clinical benefits of therapies that creates disparities in clinical practices (Folland et al., 2013; Wennberg, Barnes e Zubkoff, 1982; Wennberg, 1984). Another underlying factor is the uncertainty of the diagnosis. While not sure on the diagnosis, physicians’ practice may also vary perpetuating different clinical practices along the years (Barros, 2009; Grytten, Monkerud e Sorensen, 2012; Wennberg et al., 1982).
15 Healthcare services’ use constraints are usually applicable to consumers though co-payments or other usage limitation. However, according to the evidence found, these policies may not be the most effective, since a great deal of variability and overuse lies in the supply side (Wennberg e Fowler, 1977).
2.1.3. Supply-induced demand
If physicians are, in fact, able to promote healthcare use beyond clinical needs then SAV introduces the notion that there are geographic variations that persist even after standardization of physicians training and that physicians can have different clinical practices whether they are justified for different beliefs or lack of clinical evidence that generate different treatment patterns. What if those differences are generated not on the best interest of patients? i.e. What if physicians could choose not optimally clinical treatment in their own favor? (Chandra et al., 2011; Fisher et al., 2003; Johnson, 2014).
Physicians’ influence on demand arises from asymmetric information, a well-known market failure. This generates the concept of agency i.e., having more information than patients on the treatments and quantities of those treatments, physicians act in the best interest of patients as patients would act if they have themselves the complete information (Chandra et al., 2011; Folland et al., 2013; Johnson, 2014). But as physicians work as agents for patients this means that while they are expected to act in the best interest of patients, physicians could also neglect patient’s best interest for their own profit or not (Folland et al., 2013).
These hypothesis have originated the theories of Physician-Induced Demand (PID) or Supply-Induced Demand (SID). Evans (1974) hypothesized physicians, having more information than patients, could influence the demand for their own services (Evans, 1974). The definition of this concept is provided by T. McGuire (2000): Physician-induced demand exists when the physician influences a patient’s demand for care against the physician’s interpretation of the best interests of the patient (McGuire, T., 2000). T. McGuire (2000) goes further by explaining that economic incentives, such as quantity rewarding payment schemes, reduction of fees or increased supply may lead physicians to influence patient’s demand curve accommodating physicians own interests (McGuire, T., 2000).
16 SID theory has been used as one of the justifications for the increase in health expenditure which explains the importance given to this topic (Cromwell e Mitchell, 1986; Evans, 1974; McGuire, A., Henderson e Mooney, 1988; Newhouse, 1992; Rice, 1983).
According to SID theory, individuals respond to incentives and physicians are no exception (Folland et al., 2013). Physicians will thus behave in order to maximize their utilities: physicians value net income and leisure and dislike inducing patient demand (Folland et al., 2013; Johnson, 2014; McGuire, T., 2000).
The “solution” of the “problem” lies in the trade-off between income and leisure and in the trade-off between income and inducement (Folland et al., 2013). Considering income-leisure trade-off (Figure 2), for different wage rates there are different budget constraints. Physicians will choose their optimal point in each income line provided the additional income they get for each hour of leisure they give up (Folland et al., 2013; Johnson, 2014; McGuire, T., 2000).
Figure 2: Graphic representation of Income-Leisure trade-off
Source: Folland et al., 2013. p. 303
17 B’, then, according to this model, physician will compensate the lost income by working more (Folland et al., 2013; Johnson, 2014; McGuire, T., 2000).
The next trade-off (Figure 3) considers net income and inducement. It is assumed that physicians dislike inducing demand on patients and each time they induce demand there is a disutility in this action (Folland et al., 2013). Lost utility by inducing demand will need to be compensated by the extra utility net income provides (Folland et al., 2013; Johnson, 2014; McGuire, T., 2000).
In A, physician is not inducing demand, but his utility optimizing behavior will shift his inducement practice to point as this behavior will increment his utility (A ). Supposing his wage rate declines, his net income-inducement curve will get flatter and shift downwards. In this case, his no-inducement point would be B and his optimizing behavior will shift his inducement practice to ( which means a wage rate decrease will increase inducement practice: ( > or by other words, a change in physician fee will affect the quantities physician supply (Folland et al., 2013; Johnson, 2014; McGuire, T., 2000).
Figure 3: Graphic representation of Income-Inducement trade-off
Source: Folland et al., 2013. p. 304
18 Criticism to this theory justifies that theory models are not correct because they do not address patient’s differences nor do they address differences in practice styles, practice environment among other factors (Johnson, 2014). Nevertheless, SAV evidence has demonstrated that demand characteristics and differences in populations are not explaining much of variations in clinical practice across regions and potentially across physicians (Folland et al., 2013; Folland e Stano, 1990).
As for the practice style mentioned, it may be viewed as an incomplete knowledge of physicians on the true value of the treatments and alternatives that is usually corrected with education and monitoring (Folland et al., 2013). While promoting differences in supply, physicians that are not well-informed on the treatments they are providing, may not be intentionally inducing demand (Folland et al., 2013).
But controversies to SID theory are more pronounced when perfect agency or target income hypothesis are considered.
In the first, researchers state that one does not need to assume SID to have an increment in quantity of care following and increment in supply. The traditional supply-demand theory would predict that in a simpler manner (Carlsen e Grytten, 1998; Folland et al., 2013; McGuire, T., 2000). To address this question Reinhardt (1985) has proposed the “fee test” where inducement can only be invoked if physicians’ fees increased to levels above the initial accommodating not only supply increase but also increased demand from SID (Folland et al., 2013; Reinhardt, 1985). Including quality in the model as proposed by Feldman & Sloan (1988) can have the same effect, though. In this case, physicians would react to increased supply with an increase in quality which in turn could mean higher prices excluding once more the SID from potential explanation to increased quantity and prices (Feldman e Sloan, 1988; Folland et al., 2013).
As well, responses to fee reductions may not be attributable to SID as the effects after an imposed price reduction on the traditional supply-demand model are similar (McGuire, T., 2000). In alternative, analyses of income-shocks will differentiate maximizing suppliers from inducers (Johnson, 2014). Studies using informed and non-informed patients can also be used to address differences in physician behavior (Johnson, 2014).
The point is that agency relationship and asymmetry of information may violate the hypothesis assumed by neo-classical theory that supply and demand are independent thus supply-demand theory may not be correctly addressed in these cases (McGuire, T., 2000).
19 (1996) and Rizzo & Zeckhauser (2003) (Rizzo e Blumenthal, 1996; Rizzo e Zeckhauser, 2003).
The literature on inducement is as conflicting as the theory. Counter arguments are especially proliferous because of the difficulty to test SID empirically (Carlsen e Grytten, 1998).
According to Carlsen & Grytten (1998) initial studies on the topic support the SID theory while later studies reject it (Carlsen e Grytten, 1998; Dranove e Wehner, 1994; Escarce, 1992; Evans, 1974; Fuchs, 1978; Redisch, Gabel e Blaxall, 1981; Stano, 1985). The reason behind this may be technical. Initial studies were performed on aggregate data and looked for an availability effect, i.e., that an increase in supply would lead to an increase in the services provided by physicians (Chandra et al., 2011; Cromwell e Mitchell, 1986; Feldman e Sloan, 1988; Fuchs, 1978). Later studies, have addressed the question differently by examining exogenous demand shocks and analyzing changes in utilization after reductions in physicians’ payment (Chandra et al., 2011; Dranove e Wehner, 1994; Gruber e Owings, 1996; Nguyen e Derrick, 1997; Rice, 1983; Rossiter e Wilensky, 1984; Yip, 1998).
There are several studies that show that physicians do respond to economic incentives such as reimbursement schemes especially if they promote quantities (Folland et al., 2013). Initial work of Evans (1974) addressed exactly this question through the analysis of increased demand in Canada and United States. Rice (1983) found as well evidence of SID when finding greater quantities of surgeries and laboratory tests (Rice, 1983).
Physicians paid on a fee-for-service have more incentive to supply more healthcare services than physicians on capitation schemes (Nassiri e Rochaix, 2006; Quast, Sappington e Shenkman, 2008). The study of Iversen (2004) has demonstrated that physicians with shorter lists of patients increase their lists to compensate the reduced income and study by Rizzo & Zeckhauser (2003) suggest that physicians pursue income targets (Iversen, 2004; Rizzo e Zeckhauser, 2003). The work of T. McGuire & Pauly (1991) also concludes that when income-effects are in place, physicians will seek a target income (McGuire, T. e Pauly, 1991). Another study by Ho & Pakes (2011) refers that physicians choose treatment options they have incentives to (Ho e Pakes, 2011).
Regarding changing in fees paid to physicians, Nguyen & Derrick (1997) have shown that when facing reduction in fees, physicians increase volume to generate additional income that was lost (Nguyen e Derrick, 1997). The same evidence is found by Yip (1998) in whose study volumes of Coronary Artery Bypass Grafting (CABG) increased more for physicians whose income reduced more (Yip, 1998).
20 paid services as C-sections (Gruber e Owings, 1996). Fuchs (1978) estimates that a 10 percent increase in the ratio between surgeons and patients will lead to an increase of 3% in per capita utilization showing that increased competition, increase healthcare services volume (Fuchs, 1978). Cromwell & Mitchell (1986) identified areas with more surgeons as areas with higher utilization rates and higher fees (Cromwell e Mitchell, 1986). Carlsen & Grytten (1998) on other side do not find clear evidence than competition reflects SID or if other factors are the justification (Carlsen e Grytten, 1998).
As well, services that are more profitable than others, such as specific surgery settings have evidence to be more used than others (Fuchs, 1978; Plotzke e Courtemanche, 2011). Grytten, Carlsen, & Sørensen (1995) find evidence on inducement for laboratory tests but not for physician visits which may be explained by these differences in profitability (Grytten et al., 1995).
Although Rossiter & Wilensky (1984) find evidence of SID, the magnitude of the effect is considered small and is only significant for optional treatments (Rossiter e Wilensky, 1984).
Several critiques to the studies presented above have proliferated across literature especially on methodological questions. These studies are thought to favor inducement evidence by not excluding accurately several factors such as supply shocks or by using variables that are thought to be endogenous as average coinsurance rates (Gruber e Owings, 1996; Johnson, 2014). Dranove & Wehner (1994) method, for example, has suggested that physicians were influential on the number of births which is something that is certainly not expected and was thought to be caused by a misspecification in the model that had been used before in the work of Cromwell & Mitchell (1986) (Dranove e Wehner, 1994).
But apart from methodological critiques, other authors did not find evidence of SID. This is the case for early study from Feldman & Sloan (1988). While they agree SID may be present for some profitable healthcare services, they state that this behavior is much lower than what was suggested by other authors (Feldman e Sloan, 1988). Carlsen & Grytten (1998) did not find evidence of SID in visits or in laboratory tests either (Carlsen e Grytten, 1998).
21 namely willingness-to-pay. Results suggested that SID did not affect significantly patients’ behavior (Voorde, Van, Doorslaer, Van e Schokkaert, 2001).
2.1.4. Addressing geographical variations
An initial thought on how to solve geographical variations is clearly the need for guidelines. As Folland et al. (2013) suggests, the lack of consensus on the clinical benefits of several medical procedures generates disparities on how patients are treated (Folland et al., 2013). The different beliefs of physicians, patterns of practice, different treatment choices, etc. are justifications for variations in clinical practice especially when there are incentives for these variations. Those variations could be reduced if clinical practice was homogenized with better scientific evidence and clinical guidelines (Birkmeyer et al., 2013; Folland et al., 2013).
Physicians’ training and information programs may also promote better behaviors and influence practice styles (Folland et al., 2013; Wennberg e Fowler, 1977). The work of Wennberg & Fowler (1977) showed that tonsillectomy’s rates have been significantly affected by an informational program that was established in England (Folland et al., 2013; Wennberg e Fowler, 1977). Another information program directed to physicians reduced pelvimetries performed without need (Chassin e McCue, 1986; Folland et al., 2013). In Canada, a review program reduced unjustified hysterectomies (Dyck et al., 1977; Folland et al., 2013).
Wennberg (1984) has suggested that the first step towards correct decisions on resource allocation is the monitorization and information on regional performances (Wennberg, 1984).
Many similar and other policies are identified in the OECD report and can be used to incentivize the correct utilization of healthcare services more than to reduce variations. These were described as soft-touch policies and include: the public reporting of geographical variations as to create awareness of these variations on stakeholders and promote actions; setting targets at the regional levels to promote appropriate use of healthcare services; re-allocation of resources to correct for over or under treatment that is thought to be influenced by supply; implementation of clinical guidelines that homogenizes clinical practice; provider-level reporting and feedback; changes in payment systems to correct of over or under treatment; measurement of health outcomes; utilization of decision aids for patients promoting informed decisions and responsiveness to patients’ preferences (Srivastava et al., 2014).
22 guidelines in the United Kingdom have kept C-section rates at an average level below OECD level with low geographical variability (Alvarez-Bartolomé e Gogorcena-Aoiz, 2014; Farebrother, 2014).
In knee arthroscopy, Patient Reported Outcomes Measures (PROMs) are being developed to determine the benefits of these interventions to patients (Farebrother, 2014).
Although a lot of research work has been done regarding the identification of medical practice variation, there is not much work on the evolution of this phenomenon. The literature review of Groenewegen and Westert (2004) on works analyzing the evolution of medical practice variation concludes that in general, variations in medical practice have been reducing over the years after implementation of guidelines and utilization of data for management of variations and regulation of physician behavior.
2.2.
Efficiency
Efficiency and waste have been major topics of concern along the times but have become hot topics in the last two decades. Scarcity of resources, financial crisis and the necessity to become more and more efficient has increased the focus on these topics on the whole society and on healthcare system as well.
Efficiency has been described in the literature as the best use of resources in production (Hollingsworth, Dawson e Maniadakis, 1999) or the extent to which objectives are achieved in relation to the resources consumed (Jacobs, Smith e Street, 2006). Farrell (1957), one of the reference authors on the topic has defined efficiency as the production of as many possible outputs given an available set of inputs (Farrell, 1957). All these definitions, however, imply the use of available resources in the best possible manner, whether it is more output, better quality output or objectives achievement. Additionally, efficiency definitions can be divided in three types of efficiency: 1) technical, allocative and cost efficiency. While the definition of technical efficiency is virtually consensual – maximization of outputs for a given level of inputs or minimization of inputs for a given level of outputs – the definitions of allocative and cost efficiency differ in some points (Cylus et al., 2016; Farrell, 1957; Street et al., 2011). Street et al. (2011) define allocative efficiency as the choice of the appropriate mix of inputs and outputs to maximize utility and cost efficiency as the minimization of costs for any given output level, Farrell (1957) defines allocative efficiency as the correct choice of inputs, given their prices, to maximize output (Cylus et al., 2016; Farrell, 1957; Street et al., 2011).
23 education; iv) inefficient health system may harm social solidarity and social welfare (Cylus et al., 2016).
Failures of care delivery, failures of care coordination, overtreatment, administrative complexity, pricing failures, fraud and abuse are identified by Berwick & Hackbarth (2012) as sources of waste in healthcare services delivery.
Failures of care delivery are related to poorly executed services or performance of non-best practices, for example, which is intimately related to medical practice variations. This kind of failures leads to patient injuries, adverse events and worse clinical outcomes that incur in not only additional costs for hospitals but also represent patient discomfort, inconvenience and potential loss of income (Bernal-Delgado, Martínez-Lizaga e Ridao-López, 2011; Berwick e Hackbarth, 2012; Jackson et al., 2011).
Methods for identifying these failures often try to assess the occurrence of adverse events and to quantify the excess costs they produce. Ideally, adverse events could be directly identified in the comorbidities of an inpatient stay and thus easily quantified, however, this information is not always available and this lack of information may exclude about 41% of the cases considered failures of care delivery (Jackson et al., 2006).
Bernal-Delgado et al. (2011) measure the excess length of stay driven by the occurrence of thromboembolism after surgery, assuming the increase in the length of stay is a proxy of the excess costs incurred. Different methods such as linear regression, matched controls, cluster effects controls, etc. were used to understand how thromboembolism affects the length of stay. Age, gender, comorbidities, severity and hospital characteristics were also considered.
Limitations on these methods are related to the quality of the data on secondary diagnoses and coding heterogeneity across institutions (Bernal-Delgado et al., 2011). Further difficulties arise on identifying if specific diagnoses codes were already present at hospital admission or if they were hospital-acquired (Jackson et al., 2006, 2011).
Ridao-López et al., (2012) assessed the economic losses incurred by variability in medical practice. Excess number of cases was multiplied by a unitary cost computed per hospital (the current spending of the hospital divided by the total sum of All-Patient Refined Diagnostic Related Groups – APR-DRG – cost weights) and multiplied by the cost-weight associated with each patient APR-DRG.
When variability of medical practice exists, it can be the case that overtreatment is in place. Overtreatment refers to subject patients to care that, according to sound science and the patients’ own preferences cannot possibly help them (Berwick e Hackbarth, 2012).
24 Common to both overtreatment and failures of care delivery are several limitations: i) coding heterogeneity; ii) definition of best practice; iii) definition of geographic areas; iv) and cost measurement, that need to be addressed when assessing variations in medical practice.
Given the need to reduce costs and expenditures, analysis of efficiency may be a powerful tool for helping to create cost-containing policies and to understand where resources are being wasted.
Measuring efficiency is an essential activity when information on how good a specific service is, is required. Measurement isolates the good from the bad according to a specific consensus and should aim to provide relevant information to those being measured (Papanicolas e Smith, 2013; Smith, Mossialos e Papanicolas, 2008).
Considering the definition of technical efficiency – maximization of output for a given level of inputs – and that inefficient treatment potentiate the denial of treatment to other patients that could have benefited, variations in medical practice generate inefficiencies through the delivery of care that: 1) is non-optimal; 2) uses resources that could have been better allocated.
Comparisons between practitioners, institutions and, ultimately, health systems provide information to physicians, healthcare institutions, governments and populations on the state of their health system, how good the medical practice is and how it compares to their direct competitors or peers (García-Altés et al., 2006; Smith et al., 2008). The information provided by efficiency measurement creates the opportunity for improvement and accountability of practice being also a measure to justify decision making (Smith et al., 2008).
2.2.1. Methods to estimate technical efficiency
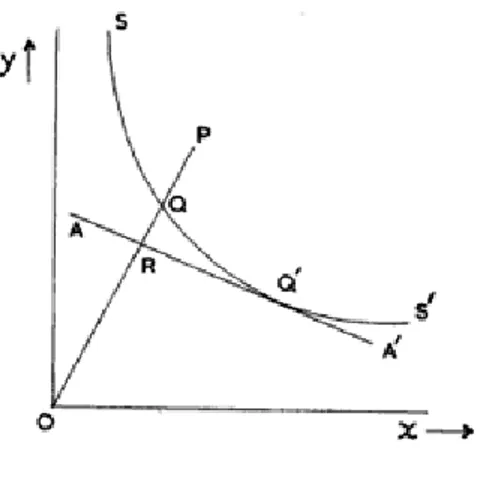
Graphically, technical efficiency means that there is an isoquant in which different combinations of inputs produce the same quantity of output (Figure 4). Above that isoquant combinations of inputs producing the same quantity are being inefficient because they are not minimizing inputs (Farrell, 1957; Franco e Fortuna, 2003).
25 Figure 4: Technical and Allocative Efficiency
Source: Farrell, 1957. p. 256
To estimate inefficiency, Farrell (1957) proposes the estimation of an isoquant indicating the possible input combinations to produce a certain level of output and the comparison of the observed results with the inputs used and the prices of the inputs.
Looking at Figure 5, suppose isoquant SS’ had been estimated. A firm performing at point Q’ would be allocative and technically efficient, point Q would be technically efficient but would show allocative inefficiencies and point P would be neither allocative nor technically efficient.