Mariana Isabel da Silva Guise
Assessment of the thermal environment in
a textile plant for automotive components
Mariana Isabel da Silva Guise
Outubro de 2014 UMinho | 201 4 Assessment of t he t her mal en vir onment in a te
xtile plant for automo
tiv
e com
Outubro de 2014
Dissertação de Mestrado
Ciclo de Estudos Integrados Conducentes ao
Grau de Mestre em Engenharia e Gestão Industrial
Trabalho efetuado sob a orientação do
Professora Isabel Maria Pereira Leite de Freitas Loureiro
Professora Senhorinha de Fátima Capela Fortunas
Teixeira
Mariana Isabel da Silva Guise
Assessment of the thermal environment in
a textile plant for automotive components
iii
Acknowledgments
To professor Isabel Loureiro, for the support and availability throughout this work; for the huge opportunity and incentives. For showing me that to accomplish success it is necessary dedication and work. Without a doubt, the biggest acknowledgment goes to making me see that the human component is extremely important and it is also a part of engineering. Thank you so much!
To professor Senhorinha Teixeira for answer all my questions and doubts with efficiency and for always welcoming me with a smile and open arms, even when the time was not much. Thank you for all the opportunities of integration in the department and for all the knowledge transmitted. It was a great pleasure working with you!
To engineer Hélia Fonseca for being an excellent guide during the internship. For all the support and for never making me wait for an answer. Thank you for helping me in all the steps in the company.
To all that crossed my way in Indústria Têxtil do Ave, S.A., for the best work environment and availability. Thank you also for the experience which made me grow and learn.
To University of Minho for being the stage to the best 5 years of my life until this moment.
To Mário! Thank you for showing up in my life, for being there when it was necessary, for all the exchange thoughts and knowledge. For all that is still to come in our friendship. I wish you all the luck in the world and the best things that you can ever have. You are the best!
To Brochado, for teaching me the creative thought. Thank you for all the support since the beginning. You are one of the most beautiful people I know. I am proud of you! To all my friends and colleagues who made a positive impact in my life.
To my parents, Irene and Albano, for the opportunity given and for the support. For always being there when it is needed.
To my sister, Catarina. Firstly, for teaching me a lot of what I know today; from the ABC, to the multiply accounts and to the engineering thinking . For being with me since I know myself and for being the best sister I have (even if you are the only one!). Thank you sis.
To Rui, for being so present in my life. For putting up with my panic and nervous moments and for knowing how to deal with it. Thank you for your patience.
v
Abstract
KEYWORDS: Industrial plant; Metabolism; Thermal comfort; Thermal environment; Human Thermal Model.
Thermal comfort is a state of mind, which makes it a subjective sensation that is affected by personal differences. Thereby, the same environment will not satisfy everyone. But the main goal is to turn a work environment as comfortable as possible, to avoid work accidents and/or health problems.
The objectives of this work were experimental measurements and calculation of the thermal environmental parameters (air temperature, air velocity, relative humidity and radiant heat), the characterization of the thermal environmental, according to the obtained data and the simulation of the human thermal response to the thermal environment, using a human thermal model. This way, the assessment of the thermal environment of an industrial plant in an experimental way, was achieved and the sensitivity of the human thermal model was tested.
The measures of the environmental variables were made in 29 points in the plant, through appropriate instruments like globe thermometer, thermo anemometer and Data Logger. In order to assess the workers’ sensation, a thermal sensation questionnaire was developed. The calculation of the indexes Wet Bulb Globe Temperature (WBGT) and Predicted Mean Vote and Predicted Percentage of Dissatisfied (PMV/PPD) was performed with the resource of the Malchaire’s model and an Excel sheet.
Regarding the tests to evaluate sensitivity of a human thermal model to environmental variables changes, three points of measures were used; the chosen points had similar environmental variables and different metabolic rate, and vice-versa.
Results showed that the shift with the highest WBGT is the shift from 14h00 to 22h00 which confirms the answers given by workers in the questionnaire. All the workers are uncomfortable with the thermal environmental.
The tests in human thermal model indicated that this can differentiate the thermal behavior of the different body parts, according to their adaptability. It was also possible to conclude that the temperature of the parts that can adapt tend to stabilization.
vii
Resumo
PALAVRAS-CHAVE: Ambiente térmico; conforto térmico; metabolismo; planta industrial; Modelo Térmico Humano
O conforto térmico é um estado da mente, o que o torna uma sensação subjectiva que é afetada pelas diferenças pessoais. Portanto, o mesmo ambiente não consegue satisfazer toda a gente. Mas o objetivo principal é tornar um ambiente de trabalho o mais confortável possivel, de modo a evitar acidentes e/ou problemas de saúde.
Os objetivos deste trabalho foram a medição experimental e cálculo dos parametros térmicos ambientais (temperatura do ar, velocidade do ar, humidade relativa e temperatura radiante), a caracterização do ambiente térmico, de acordo com os dados obtidos e a simulação da resposta térmica humana ao ambinente térmico, com o uso de um modelo térmico humano. Deste modo, a avaliação do ambiente térmico de uma planta industrial de um modo experimental, foi alcançada e a sensibilidade do modelo térmico humano foi testada.
As medições das variavéis ambientais foram feitas em 29 pontos da planta, através de equipamentos apropriados como o termómetro de globo, o termoanemómetro e o Data
Logger. De modo a avaliar a sensação dos trabalhadores, um questionário de sensação
térmica foi desenvolvido. O cálculo dos indíces Wet Bulb Globe Temperature (WBGT) e Predicted Mean Vote and Predicted Percentage of Dissatisfied (PMV/PPD) foi realizado com recurso ao modelo de Malchaire e a uma folha de Excel.
No que concerne aos testes para avaliar a sensibilidade do modelo térmico humano às mudanças das variáveis ambientais, três pointos de medição foram usados; os pontos escolhidos tinham valores similares de variáveis ambientais e diferente metabolismo; e vice-versa.
Os resultados indicam que o turno com maior valor de WBGT é o turno das 14h00 às 22h00, o que confirma as respostas dadas pelos trabalhadores no questionários. Todos os trabalhadores sentiam-se desconfortáveis com o ambiente térmico.
Os testes ao modelo térmico humano indicaram que o mesmo consegue diferenciar o comportamento térmico das diferentes partes do corpo, de acordo com a sua adaptabilidade.
Foi possível concluir que a temperatura das partes que se adaptam, tendem à estabilização.
ix
Table of Contents
Chapter I - Introduction ... 1
1.1 Company presentation ... 3
1.2 Background and Motivation ... 6
1.3 Objectives and Research Questions ... 8
1.4 Dissertation Organization ... 9
Chapter II - Literature Review... 9
2.1 Human interaction with the environment ... 12
2.1.1 Productivity and Health ... 12
2.1.2. Thermoregulation and Heat Balance Equation ... 13
2.1.3 Factors that influence thermoregulation ... 15
2.2 Portuguese Legislation and International Standards ... 16
2.3 Thermal Environment ... 17
2.3.1 Thermal Comfort ... 18
2.3.1.1 Parameters ... 18
2.3.1.2 (Dis) comfort Conditions ... 19
2.3.1.4 Comfort zone diagram ... 22
2.3.2 Thermal Stress ... 23
2.3.2.1 Assessment - WBGT ... 23
2.3.2.2 Effects of hot environments ... 25
2.3.2.3 Heat protection / controlling measures ... 26
2.4 Human Thermal Modeling ... 28
Chapter III – Methodology ... 27
3.1 Selection of an area ... 32
3.1.1 Technological subsystem ... 33
3.1.2 Personnel Subsystem ... 35
3.2. Selection of the measuring points and strategy... 35
3.3 Thermal Sensation Questionnaire (TSQ) ... 36
3.4 Environmental parameters measurements ... 39
3.5 Metabolism ... 40
3.6 PMV/PPD and WBGT ... 40
x
3.7.1 Main equations ... 42
3.7.2 Simulated conditions ... 46
Chapter IV – Results and Discussion ... 35
4.1 TSQ results ... 49
4.2 Metabolism ... 55
4.3 Environmental parameters results ... 57
4.4 PMV/PPD and WBGT results ... 59
4.4 Human Thermal Model results ... 60
Chapter V – Conclusions and Future Work... 61
5.1 Conclusions ... 65
5.2 Future Work ... 66
Bibliography ... 60
Annexes ... 74
Annex A - Values of Accuracy and Factor x ... 76
Annex B – Thermal Sensation Questionnaire ... 80
Annex C – Metabolism ... 84
Annex D – Mean WBGT Results ... 87
Annex E – Mean WBGT Results ... 97
xii
List of Figures
Chapter I
Figure 1.1 – Continental - Indústria Têxtil do Ave, S.A. ... 4
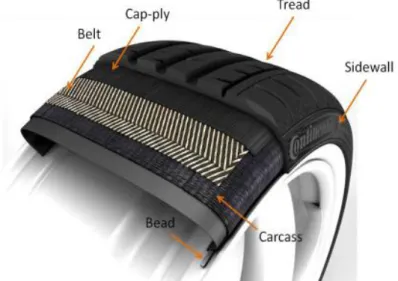
Figure 1.2 – Components of a tire (Santiago, 2013) ... 4
Figure 1.3 – Productive process (adapted from Moutinho, 2013) ... 5
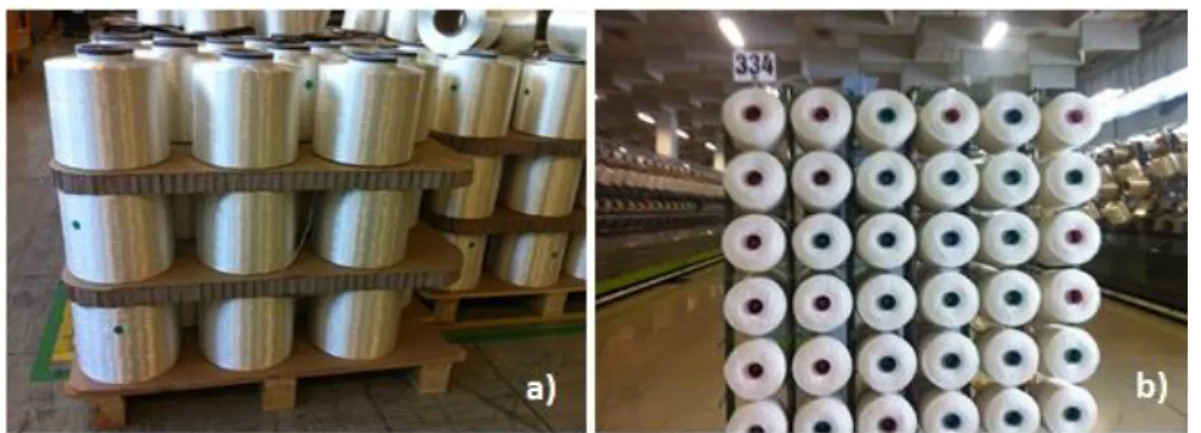
Figure 1.4 – a) Yarn; b) Rope ... 6
Figure 1.5 – Overall perception about thermal environment (adapted from Li, 2010) .... 7
Chapter II Figure 2.1 - Relation between temperature and accident rate (Parsons, 2003) ... 13
Figure 2.2 – Thermal exchange in human body (adapted from Lamberts, 2013) ... 14
Figure 2.3 – Local Thermal Discomfort (INNOVA AirTech Instruments (n.d.)) ... 20
Figure 2.4 – Relationship between PMV and PPD (Djongyang et al., 2010) ... 22
Figure 2.5 – World Meteorological Organization (WMO) Diagram (adapted from Ferreira & Talaia, n.d.) ... 23
Figure 2.6 – Effects of temperature increases (adapted from Grandjean, 1998) ... 26
Chapter III Figure 3.1 – Research Methodology ... 32
Figure 3.2 - Work system model (adapted from Kleiner, 2006) ... 33
Figure 3.3 – ICBT twister ... 34
Figure 3.4 – a) Pallet with bobbins of yarn; b) Car with bobbins of rope ... 34
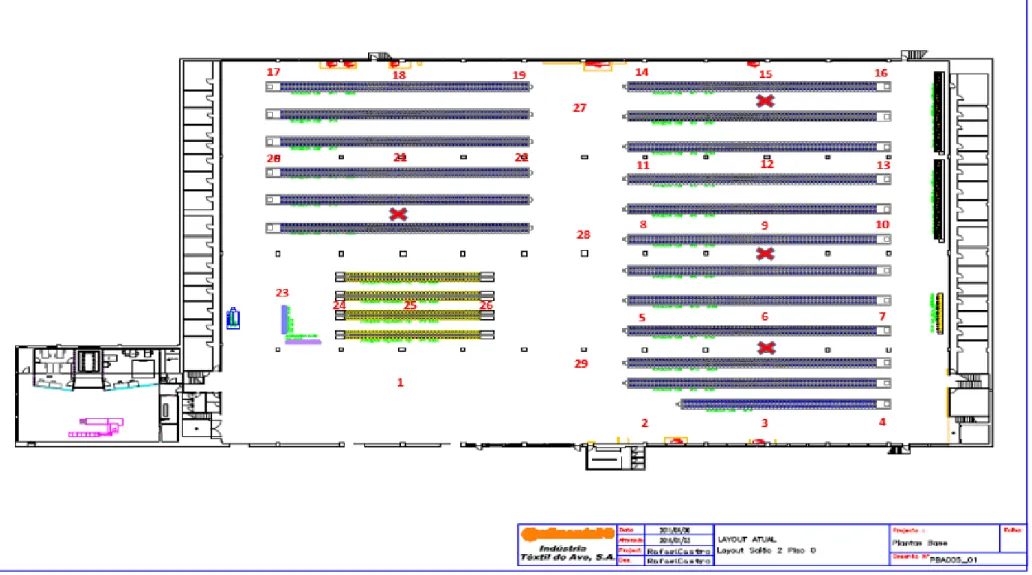
Figure 3.5 – Layout and measurement points ... 37
Figure 3.6 – Instruments ... 39
Figure 3.7 – Data Logger’ graphic example ... 39
Figure 3.8 – Example from Professor Malchaire Excel sheet ... 41
Figure 3.9 – Scheme of nodes division ... 42
Figure 3.10 – Parts of the human body ... 43
Chapter IV Figure 4.1 - Workers’ years of labor ... 49
Figure 4.2 – Developed tasks ... 50
Figure 4.3 – Thermal sensation by shift ... 50
Figure 4.4 – Thermal sensation by season ... 51
xiii
Figure 4.6 – Workers’ thermal feelings ... 52
Figure 4.7 – Workers’ thermal sensations ... 52
Figure 4.8 – Water’s necessities ... 53
Figure 4.9 – Water’s ingestion ... 53
Figure 4.10 – Workers’ clothes ... 54
Figure 4.11 – Comparison of the skin temperature in head ... 61
Figure 4.12 – Comparison of the skin temperature in abdomen ... 62
xv
List of Tables
Chapter II)
Table 2.1 – WBGT reference values (adapted from Araújo, 2010; Parsons, 2006) ... 25
Table 2.2 – Protective measures (Sousa, et al., 2005; Miguel, 2005; Workplace Safety & Health Division, 2007; Araújo, 2010). ... 27
Chapter III) Table 3.1 – Hours of measurements ... 36
Table 3.2 – Values of weight, surface area, volume and temperature to each part ... 45
Chapter IV) Table 4.1 – Comparison between twisting and other tasks ... 55
Table 4.2 – Activities' metabolism ... 57
Table 4.3 – Three level measurements in point 1 ... 57
Table 4.4 – Records of exterior temperature ... 58
Table 4.5 – Physical parameters in 06h00 to 14h00 shift ... 58
Table 4.6 – Physical parameters in 14h00 to 22h00 shift ... 58
Table 4.7 – Physical parameters in 22h00 to 06h00 shift ... 59
Table 4.8 – PMV, PPD and WBGT values regarding to day and night measurements . 60 Table 4.9 – Simulation conditions ... 60
3
Industry it is not only equipment and processes. The human component is important and fundamental but it is not always seen by that perspective. The importance of the study of thermal environment was intensified with the publication of Fanger, “Thermal Comfort”, in 1970, where the author emphasizes the disciplinary character of this study area.
Thermal comfort is a state of mind, which makes it a subjective sensation that is affected by personal differences. Thereby, the same environment will not satisfy everyone. But the main goal is to turn a work environment as comfortable as possible, to avoid work accidents and/or health problems.
A comfortable worker is more willing to work, increasing this way the company productivity.
1.1 Company presentation
Continental AG was founded in 1871, Hanover. It was the first German company producing pneumatic tires for bicycles. In 1990, a joint venture was set up together with the Portuguese company Mabor, for the production of tires. Currently, Continental is located in Africa, Asia, Europe and America and belongs to the group of the largest world producers of tires1.
Vision, Mission and Values
The vision of the company is to develop intelligent technologies for transport and mobility, providing good solutions for customers. The mission of the company is to invent, develop, produce and market technological solutions and generate value. Maintaining the highest of quality standards and providing solutions that benefit the society with faster progress and respect for the environment and protection of life, Continental does its mission efficiently, effectively and innovatively. Mobility and transport become, therefore, safer, more comfortable and more sustainable. The values represent four main goals: Trust, Passion to Win, Freedom to act and For one another. At Continental Group there are two factories that produce textile reinforcements; one is located in the United States of America and the other is Continental – Indústria Têxtil do Ave. S.A. (C-ITA), located in Lousado, Vila Nova de Famalicão, visible in Figure 1.1.
1
Information available in Continental Corporation official site: http://www.continental-corporation.com/www/portal_com_en/themes/continental/history/ (last view 26/11/2013).
4
C-ITA, the local where this work was developed, was founded in 1948 as a consequence of the first tire factory in Portugal, Mabor.
Figure 1.1 – Continental - Indústria Têxtil do Ave, S.A.
C-ITA dedicates its production to textiles for tires, being initially used cotton as a feedstock. In 1958, cotton was replaced by high tenacity rayon and, years later, by synthetic fibers, like polyamide and nylon. These materials provide unique features to the tire, gaining security, comfort and the best direction conditions possible. This is extremely important since the tire (Figure 1.2) is the link between the vehicle and the floor.
Figure 1.2 – Components of a tire (Santiago, 2013)
C-ITA has 172 workers and a total area of 52000 m2, being 30000 m2 covered. With a production of 15000 tons per year, works 24 hours a day, 7 days per week, with various work schedules: normal rotation, fixed rotation and continuous labor. The company is
5
certified with the standards ISO 9001 and ISO 14001. The productive process, visible in Figure 1.3, is divided in three main sections: Twisting, Weaving and Dipping.
Figure 1.3 – Productive process (adapted from Moutinho, 2013)
The winding is realized on the products which do not have the appropriate dimensions to introduce in the twisters. In this stage, the yarn is rewound to obtain the correct dimensions, being then able to follow to the twisting process. In winding process there is also the possibility to remove irregularities that the yarn may contain. The winding process it’s not applied to all products since the majority already presents the correct dimensions.
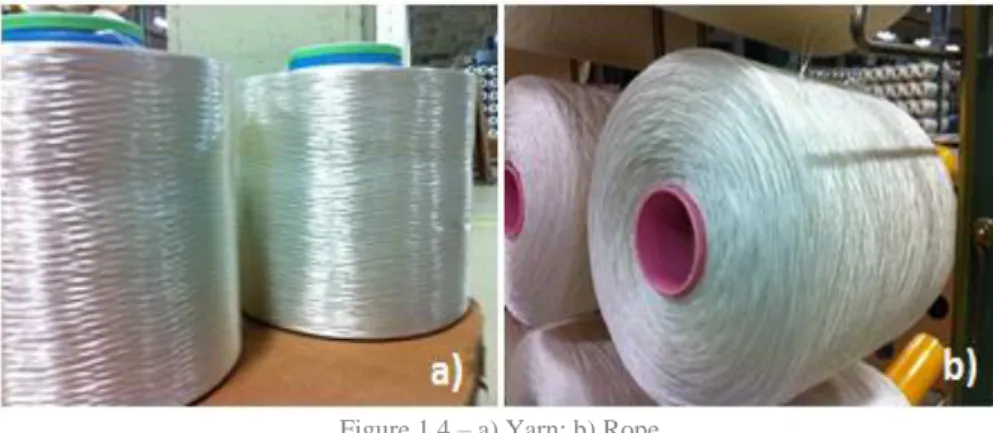
The goal of the twisting process is to twist the yarns in Z or S, in other words, interlace them, clockwise and anti-clockwise, respectively. Thus, the rope is produced which has better properties comparatively to the yarn, such as, higher tenacity and strength. The rope obtained has a cohesive structure, since this operation avoids the slip between fibers. The difference between yarn and rope is visible in Figure 1.4.
6
Figure 1.4 – a) Yarn; b) Rope
In weaving step, the bobbins from twisting process are arranged on looms that interlace the ropes in transverse and longitudinal direction, obtaining the textile fabric. The textile fabric that is obtained is wound on a bobbin of large dimensions that become in a roll. Hence, these rolls are sent to the dipping process. This process can be performed on rope or roll. The impregnation of rope is realized on SingleEnd machines, with DC twisters, and the roll impregnation on ZELL machine. In this step, is given a physical and chemical bath to the fibers to confer them a strong adhesion to the rubber in the tire production. Otherwise, the fibers would not adhere to rubber.
1.2 Background and Motivation
Ergonomics is the science of sociotechnical systems and its study started about 1857 by Jastrzebowski (Hollnagel, 2013). In the year of 2000, the International Ergonomics Association approved the international definition of Ergonomics: “is the scientific discipline concerned with the understanding of interactions among humans and other elements of a system, and the profession that applies theory, principles, data and methods to design in order to optimize human well-being and overall system performance”2
. Fernandez (as cited in Jaffar & Lop, 2011) affirm that ergonomics assure safety, health and well-being of workers and its main goal is “to fit the task to the individual, not the individual to task”. According to Scott, Kogi and McPhee (2010) ergonomics’ aim is to promote health and efficiency in workers by “designing for safe, satisfying and productive work”. Ergonomics is concerned with factors such as, shifts and rest breaks and design of work environments, including lighting and room temperature (Rodrigues, 2007).
7
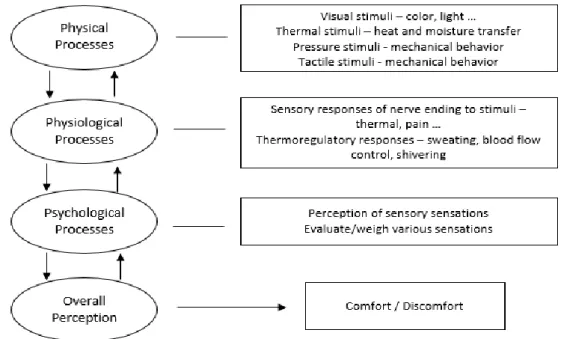
The confirmation about the importance of the study of thermal comfort came in 1970 with the work of Fanger, Thermal Comfort, where the author emphasizes the disciplinary character of this study area. In this book, Fanger established the necessary conditions to thermal comfort and the principles to assess and analyze thermal environments (Broega, 2008). Thermal comfort is a state of mind, which makes it a subjective sensation that is affected by personal differences like culture, genre or age and depends on physical, physiological and psychological processes (Djongyang, Tchinda, & Njomo, 2010; Parsons, 2002). The physical factors determine exchange of body heat to the environment, the physiological relate the response of the organism to the environment where is in and the psychological indicate the differences in perception to sensory stimuli (Ruas, 2002). A person’s perception through the different processes can be seen in Figure 1.5.
Figure 1.5 – Overall perception about thermal environment (adapted from Li, 2010)
Thereby, once the thermal sensation varies with the individual differences, ISO 7730 (2005) and ASHRAE 55 (2010) standards define temperature ranges that ensure a minimum of 80% of satisfied persons in a particular environment. But, even in an environment with thermal neutrality, there are 5% of dissatisfied with the environmental conditions (Olesen & Brager, 2004; Rodrigues, 2009).
The objective of the studies of thermal comfort is to establish the necessary conditions to turn a thermal environment appropriate to human occupancy. According to Nicol (as cited in Taleghani, Tenpierik, Kurvers, & van den Dobbelsteen, 2013)that importance
8
is defined by three reasons: provide satisfaction to people, control the consumption of energy and suggest and set standards. A comfortable environment results in a well-being to the worker and, when knowing the conditions of thermal environment, wastes of cooling or heating systems can be avoided (Ruas, 2002).
The Health and Safety Executive (HSE)3 indicates that the importance of thermal comfort is equally related to the workers behavior, since they can make decisions that jeopardize their safety, for example, stop using personal protective equipment because they feel heat.
Thus, it is possible to understand that the main goal of the study about thermal environment is to assure the best number possible of comfortable workers, in order to avoid work accidents and/or health problems. In this way, their performance and overall productivity will increase.
1.3 Objectives and Research Questions
The main objective of this work is to assess the thermal environment in a plant of a textile industry. This assessment will be made in an experimental and simulated way. To achieve this issue, several steps can be identified:
Experimental measurements
Calculation of the thermal environment parameters;
Characterization of the thermal environment, according to the obtained data;
Simulation of the human thermal response to the thermal environment, using a human thermal model.
To accomplish the purposed objectives, some fundamental research questions emerge: 1) Which are the factors that influence the thermal environment?
2) In which way they influence it?
3) In which way they influence the worker?
4) What are the methods that should be applied to improve, if necessary, the comfort sensation on the worker?
5) Can a human thermal model be used to predict the answer of the worker to the local environmental variables?
9
1.4 Dissertation Organization
The present dissertation is divided in three parts: Foreword, Developed Work and Conclusions. The Part I – Foreword, is presented in terms of Introduction and Literature Review. Here, some theoretical topics, such as, occupational ergonomics, thermal comfort and environment, thermoregulation and human thermal modeling are approached, with the purpose to contextualize the developed work in terms of theoretical framework.
In Part II – Developed Work, the Methodology is presented as well as the Results and Discussion. This part explains the material and proceedings used and the data obtained through the experimental and simulated way. The comparison of the obtained results and discussion is presented. In the last part, Part III, the main Conclusions and Future Work are presented.
12
According to Parsons (2000), ergonomics can be defined as “the application of knowledge of human characteristics to the design of systems. People in systems operate within an environment and environmental ergonomics is concerned with how they interact with the environment from the perspective of ergonomics”. The aim of ergonomics is to provide a safe workplace, increasing the productivity and the benefits to the organization and the workers (Scott, Kogi & McPhee, 2010).
There is a great human component in industry, which makes important the maintenance of good work conditions and, in the improvement of that maintenance, thermal environment has a fundamental job (Miguel, 2005). In discomfort situation, workers can reveal several effects such as mental capacity decreasing and fatigue (Costa, Baptista, Diogo & Magalhães, 2011). Employers should assure comfortable temperatures to promote the welfare and health of the employees since productivity increases about 15% when workers are satisfied with the environment (Lomonaco & Miller, 1997). Thermal comfort has, then, an important influence in the environmental effects on the human body and their relationship (Health and Safety Executive, 1999; Stankovic & Boricic, 2013).
2.1 Human interaction with the environment
2.1.1 Productivity and Health
The environmental ergonomics is, according to Parsons (2000), related with the interactions between Man and the components around: the environment. Those components are the organization (responsibility, work content, satisfaction), the software (directions, symbols), the hardware (equipment, processes) and the physical environment (noise, light, vibrations, temperature, atmosphere and ventilation) (Corlett & Clark, 2009). Corllet and Clark (2009) and Parsons (2003) argue that ergonomics is also related with the effects of the components on the activities, performance and productivity of Man. The activities that Man performs have a degree of achievement of goals, ie, performance. The degree to which the activities provide performance, in terms of organizational objectives, is called productivity (Parsons, 2003).
The effects caused by hot environments can go from the sensation of thirst or heat – leading to less attention or discomfort and decreasing the performance and productivity, to more severe conditions – that can lead to problems in health, such as heatstroke or collapse and even death (Parsons, 2000; Costa, Baptista & Diogo, 2012). Hancher and
13
Abd-Elkhalek (as cited in Zhao, Zhu, & Lu, 2009) described that productivity and enthusiasm for work reduces at hot environments exposure and irritability increase.
Wyon (2001) refer that uncomfortable people lose their motivation and tend to take brakes, reducing productivity. According to Parsons (2003) “there is no doubt that hot, moderate or cold environments can interfere with human activities, affect task performance and influence productivity”.
The World Health Organization defines health as the “state of complete physical, mental and social well-being and not merely the absence of disease or infirmity”4. In discomfort zones, there is thermal stress due to the unfavorable environmental conditions, like heat excess, that can increase the risk of accidents and damage to health (Grandjean, 1998). Several authors such as Farmer et al. (1923), Vernon (1919, 1927) e Wyatt et al. (1926), as cited in Parsons (2003), conducted studies about the relation between temperature and performance and the results show that the accidents’ rate increase with the increasing temperature deviation from the considered acceptable levels.This relation between temperature and rate of accidents is visible in Figure 2.1.
Figure 2.1 - Relation between temperature and accident rate (Parsons, 2003)
As people move away from their thermal comfort zone, states of psychological sickness, with uncomfortable feeling and overload of heart and circulatory system, for example, may appear. A thermal environment can have health consequences in medium and long term (Miguel, 2005).
2.1.2. Thermoregulation and Heat Balance Equation
Humans are homeothermic, which means that their internal body temperature should remain constant, despite the exterior temperature, and near to 37 0C (Araújo, 2012;
14
Parsons, 2003). Homeothermy ensures an optimal operation of the main functions of the organism and in particular of the central nervous system (Araújo, 2010). According to Miguel (2005), homeothermy is assured by the equality between the heat flow produced by the body and the heat loss to the environment. This loss of heat is made through conduction, convection, radiation and evaporation processes. Figure 2.2 shows the different ways of thermal exchanges in the human body.
Figure 2.2 – Thermal exchange in human body (adapted from Lamberts, 2013)
Conduction depends on the heat capacity to conduct with the objects that make contact
with the skin and it’s normally not calculated. Convection depends on the difference between skin temperature and environmental air. Radiation is the transmission of heat through the environment by electromagnetic waves and this change occurs between the body and the wall, other bodies and objects near to it. The heat exchanged is called radiant heat. Evaporation constitutes a heat loss to the body and occurs at respiratory and skin level (Grandjean, 1998; Miguel, 2005). Evaporation is a cooling mechanism exclusively, as opposed to radiation, conduction or convection and the losses through this mode increases at high activity levels (Bradshaw, 2006).
Internal metabolism (M) provides energy that allows the body to do external work (W) and the rest (M–W) is released as heat. Heat transference, as referred previously, can occur by conduction (K), convection (C), radiation (R) and evaporation (E). When combined can occur production or loss of heat (S). For thermal balance, heat storage have to equal zero (S=0). If there is a gain of heat, storage will be positive and body
15
temperature will increase. If there is a loss of heat, storage will be negative and body temperature will decrease. Thermal equilibrium between the body and the environment happens when the body gains heat at the same rate the same rate as it loses heat (Bradshaw, 2006). The heat balance equation (1) , proposed by Fanger (1973), indicates that the heat production or loss depends on the relation between metabolism, external work, heat exchange by radiation, convection and conduction, heat loss by evaporation and heat exchange by respiration (RES).
𝑆 = 𝑀 ± 𝑊 ± 𝑅 ± 𝐶 ± 𝐾 − 𝐸 − 𝑅𝐸𝑆 2.1
2.1.3 Factors that influence thermoregulation
In warm or cold environments, there can be an influence due to different factors such as, for example, gender, degree of acclimatization and age (Epstein & Moran, 2006). The forms of behavioral actions, in other words, adaptation, can also influence the thermoregulation and thus the acceptance of temperature (Djongyang, Tchinda & Njomo, 2010).
Age
Generally, older people (with more than 40 years) prefer higher temperatures comparatively to younger people and that fact is due to their lower metabolic rate (Parsons, 2003). However, studies made by Rohles (1969), Langkilde (1977) or Cena and Spotila (1984, 1986), as cited in Parsons (2003), point that there is not a significant variation of comfort conditions between elderly people and young adults.
Gender
According to several studies over the years, females tend to be more sensitive to deviations of temperature but this difference is statistically irrelevant, around 5%. A study by Hwang et al. (2006), as cited in Araújo (2012), show that the discomfort is more frequent in women but the difference can be due to the lighter cloth of women comparatively to men. So, it seems that there are no significant differences between men and women when exposed to the same temperatures (Parsons, 2003; Islam, 2005; Rodrigues, 2007).
Acclimatization
Acclimatization is the process of physiological adaptation, through blood flow and cardiac rhythm variations, which increase the tolerance of the individual to a thermal environment, for a long period (Talaia, 2013). Compared to a non-acclimatized individual, the acclimatized suffers less physiological alterations, at the same thermal
16
conditions (Águas, 2000-01). According to Miguel (2005) “when the Men is exposed to the heat in repetitive and prolonged way, develops adjustments that helps him support it better” and during the first 15 days of work, the worker should be considered non-acclimatized.
Adaptation
This behavioral phenomenon is related to the actions that the individual can take to feel comfortable. Those actions can be opening a window, adjusting curtains or ventilating systems, modification in the clothes like take off or put on a jacket and modifications in activity levels (Humphreys, 2005; ISO 7730:2005, Araujo, 2012).
2.2 Portuguese Legislation and International Standards
The Decree-Law nº 243/86 of August, 20th has as objective “ensure good hygiene and safety conditions and better quality of the work environment in all locations that develop trade, office and service activities”. The Regulation states that the temperature values should range between 18 0C and 22 0C, reaching 25 0C in certain weather conditions. The humidity of the work atmosphere shall be between 50% and 70%. This Regulation is the only one that indicates values of temperature and humidity for the workplace. The Directives nº 53/71 and nº 987/93 do not indicate values but give some instructions about how to proceed with thermal environment. The directive nº 53/71 state that the conditions of temperature and humidity should be maintained within the convenient limits to avoid damage in workers’ health. When it is not possible to modify the conditions of temperature and humidity, the workers should be protected through technical measures and personal protective equipment. The directive nº 987/93 also indicates that the temperature and humidity should be appropriate to the human organism, taking into account the work methods and the physical constraints imposed to the worker. The temperature and humidity of the common rooms must comply with the specific purposes. The directive also state that, when necessary, it must be placed protections against intense heat radiations caused by heat systems, radiators and other harmful sources of heat.
Despite this orientations, and due to the fact that only the decree-law provide practical values, the guidelines of international standards are the ones followed.
ISO standards for thermal environment assessment are related with hot, moderate and cold environments. To assess hot environments, the available ISO are 7243 – WBGT,
17
7933 – SWreq, 9886 – Physiology and 13732-1 – surfaces; for moderate environments, ISO 7730 – PMV/PPD, 10551 – Subjective, 9886 – Physiology and 13732-2 – surfaces; for cold environments, the available ISO are 11079 – IREQ and WCI, 9886 – Physiology and 13732-3 – surfaces. Beyond these, there are supporting standards, such as 11933 – Principles, 7726 – instruments, 8996 – metabolic rate, 9920 – clothing, 12894 – subject screening and 1371 – vocabulary and units (Parsons, 2006).
ISO 7243 “Hot Environments – Estimation of the Heat Stress on Working Man, based on the WBGT-index (wet bulb globe temperature)” is used to assess hot environments through WBGT index. This standard takes into account the use of clothing and metabolic rate.
ISO 7730 “Ergonomics of the thermal environment – Analytical determination and interpretation of the thermal comfort using calculation of the PMV and PPD indices and local thermal comfort criteria” is based on the application in moderate environments. It is evaluated through the PMV (Predicted Mean Vote) index, that determines the thermal sensation of the body, and PPD (Predicted Percentage of Dissatisfied) index, that provides information about thermal discomfort (ISO 7730:2005). This standard is “applicable to healthy men and women exposed to indoor environments where thermal comfort is desirable” (ISO 7730:2005).
The ASHRAE Standard 55 (2010) that belongs to American Society of Heating, Refrigerating and Air-Conditioning Engineers Organization, “outlines conditions in which a specified fraction of the occupants will find the environment thermally acceptable”. The standard is applicable to healthy adults in indoor spaces designed for occupancy for periods not inferior to 15 minutes (ASHRAE 55:2010).
2.3 Thermal Environment
According to ANSI/ASHRAE Standard 55 (2013) thermal environment is the join of the characteristics of the environment that affect a person’s heat loss. The environment can be neutral, cold or hot. A neutral environment is that where the homeothermy is pleasantly ensured and without risk to the organism; a cold or a hot environment is that where the homeothermy is ensured due to physiological reactions, in different levels (Miguel, 2005).
A combined action between air temperature, relative humidity, air velocity, radiant heat – physical parameters, and clothing and activity – individual parameters, can lead to a
18
thermal stress situation (Parsons, 2013). This work will focus on thermal comfort – neutral environment, and thermal stress by heat, also addressing thermal discomfort.
2.3.1 Thermal Comfort
Thermal comfort can be defined as “that condition of mind which expresses satisfaction with the thermal environment” (Hensen, 1991) or as “that condition of mind that expresses satisfaction with the thermal environment” (ANSI/ASHRAE Standard 55-2013). According to Miguel (2005) a comfortable environment is “a neutral environment for which the physiological parameters that determine the sensation of heat have an optimum value”. Thermal comfort is, therefore, a state of mind, which makes it a subjective sensation. It can be considered, at an equilibrium state, as a lack of discomfort.
2.3.1.1
Parameters
Thermal comfort is affected by six parameters: four environmental and two individual. The environmental parameters are air temperature, radiant temperature, air velocity and humidity; and the two individual parameters are clothing and activity – metabolism (Parsons, 2013).
Air temperature is related to the heat exchanges by convection between Men and environment (Miguel, 2005). Is expressed in centigrade (0C) or Fahrenheit (0F) degrees and it’s usually measured with thermometers (Araújo, 2010). According to Bradshaw (2006) is “the most important determinant of comfort”.
Radiant temperature is measured by a globe thermometer and is expressed equally to air temperature. Its determination can be measured in function of globe temperature, air temperature and air velocity (Araújo, 2010).
Air velocity around the body is another parameter that intervenes in the determination of heat exchange by convection and evaporation in Men (Miguel, 2005). It
r
esults from natural convection and from the occupants’ movements and it can be measured by anemometers and is expressed by meter per seconds (ms-1).Air humidity is related to the determination of heat exchanges by evaporation in Men. The relation between water vapor and dry air mass it’s called absolute humidity (Wa)
and the relation between the partial pressure of water vapor at humid air and saturation pressure of water vapor, at the same temperature, it’s called relative humidity (Wr)
19
(Miguel,2005). It is expressed in percentage (%) and can be measured with a rotary psychrometer (Araújo, 2010).
Clothing can be seen “as a layer or layers of barriers that protect the body against unsuitable physical environments” (Li, 2010). The clothing insulation is characterized by the total thermal resistance of clothing (Icl), and provides a thermal resistance between the skin surface and the environment (Miguel, 2005; Parsons, 2003). It is an important factor in heat loss and comfort changes. The unit Clo corresponds to a clothing insulation of 0.155 K.m-2.W-1. Clothing can reduce energy consumption when used appropriately according to the season and outside weather conditions (Bradshaw, 2006). Researchers normally estimate the clothing insulation values using tables but in detailed studies, it is asked to the occupants to complete a checklist, to select a more precise Clo (Charles, 2003).
Metabolism is expressed in W.m-2 and it is the least heat produced by Men, in rest, at 20oC (Miguel, 2005). It also can be used the Met unit that corresponds to 58.15 W.m-2. It can be determined directly by calorimetry5 or indirect calorimetry but it is normally measured with the resource to tables of estimates of metabolic heat (Parsons, 2003; ISO 7730:2005).
Metabolism is an important indicator of comfort or stress that results of the exposure of a certain thermal environment (ISO 8996:2004; Rodrigues, 2007). When a person performs an activity, whether mental or physical, metabolism increases to provide energy. However, even if the person is not performing any activity but body heat loss increases and internal temperature decreases, metabolism also increases, to stabilize the temperature (Bradshaw, 2006).
2.3.1.2 (Dis) comfort Conditions
Fanger (as cited in Rodrigues, 2007) defined thermal neutrality as “the condition in which a person does not want more heat or cold in the environment around”.
Discomfort can be felt as a whole or by unwanted cooling (or heating) of one part of the body. In this case, is considered local discomfort (Hensen, 1991; ISO 7730:2005). To Miguel (2005) a neutral environment is an environment in which the wastes of sensitive heat, the losses of evaporation heat and the insensitive perspiration, without the fight of the individual against heat or cold, balance the production of metabolic heat.
5
Calorimetry is a method to investigate the chemical reaction and physical transitions that are connected with the generation or consumption of heat. The objective of calorimetry is the measurement of heat (Hohne, Hemminger, & Flammersheim, 2003).
20
Besides the four environmental parameters and the two individual ones, the sweat rate and the mean skin temperature also contribute to the thermal comfort felt by Men (van Hoof, 2008; Parsons, 2000). According to Epstein & Moran (2006), the parameters of thermal comfort in Men can be expressed by measurable terms: body temperature within a range of 36.5 oC to 37.5 oC, skin temperature of 30 oC at extremities and 34 oC– 35 oC at body stem and head, being the body free of sweating. To the same authors, if any of these factors deviate of their limit values, the individual will be uncomfortable. Equally important to establish a thermal comfort situation is the inexistence of local discomfort that is characterized by draught, asymmetrical radiant temperatures, vertical air temperature differences and uncomfortable floor temperature (ISO 7730:2005) (Figure 2.3). Draught causes local convective cooling that is caused by air movement; radiation asymmetry causes cooling or heating of parts of the body; and asymmetrical radiant temperatures are caused by cold windows, cold products, cool or warm machinery, hot or cold walls and ceilings. Concerning to vertical air temperature differences these cause, at the same time, cold feet and warm head and may occur in rooms with ventilation displaced and uncomfortable floor temperature cause hot or cold feet (INNOVA AirTech Instruments, n.d.). The limit values to local thermal discomfort should be less than 10 oC to asymmetrical radiant temperatures from cold vertical surfaces and less than 5 oC to warm ceiling; no more than 3oC to differences between ceiling and floor temperatures should; between 19 oC and 29 oC to surface floor temperature (ASHRAE 55-2013; Araújo 2010).
21
Therefore, to guarantee a situation of thermal comfort in whole-body is necessary that the sweat rate and mean skin temperature have an optimum value (within values), the body is in heat balance, i.e., no storage nor heat loss, and that there is no local thermal discomfort (Parsons, 2003).
2.3.1.3
Predicted Mean Vote and Predicted Percentage of Dissatisfied
The assessment of neutral thermal environments is based on Fanger’s equation. To this assessment, two indices are considered: the PMV and PPD indices (ISO 7730:2005). PMV is an index that predicts the mean vote of a group of people, in a feeling thermal scale that is considered a bipolar phenomenon, varying in a range from “too hot” to “too cold” (Epstein & Moran, 2006; Parsons, 2000). This thermal sensation scale has 7 points of vote, being: (+3) very hot, (+2) hot, (+1) slightly hot, (0) neutral, (-1) slightly cold, (-2) cold and (-3) very cold. So, three positive points correspond to feelings of hot, zero to comfort feeling and three negative points to feelings of cold. Equation II.2 represents PMV: 𝑃𝑀𝑉 = (0.303 𝑒−0,036𝑀+ 0.028) ∗ (𝑀 − 𝑊𝑚) 2.2 −3.05 ∗ 10−3 {5733 − 6.99 (𝑀 − 𝑊𝑚) − 𝑃𝑎} − 0.42 {(𝑀 − 𝑊𝑚) − 58.15} − 1.7 ∗ 10−5 𝑀 (5867 − 𝑃𝑎) − 0.0014 𝑀 (34 − 𝑡𝑎) − 3.96 ∗ 10−8 𝑓 𝑐𝑙 {( 𝑡𝑐𝑙+ 273)4 −(𝑡𝑟+ 273)4} − 𝑓𝑐𝑙ℎ𝑐 (𝑡𝑐𝑙− 𝑡𝑎) Where: 𝑀 – metabolism 𝑊𝑚 – Mechanical work
𝑃𝑎 – Partial pressure of water vapor in the air
𝑡𝑎 – Air temperature
𝑓𝑐𝑙 – Clothing area factor
𝑡𝑐𝑙 – Surface temperature of the skin covered by cloth 𝑡𝑟 – Rectal temperature
ℎ𝑐 – Heat transfer by convection coefficient
PMV, also used to predict the number of persons that feel uncomfortable either by hot or cold excess, can be incorporated in PPD index (Homod, Sahari, Almurib, & Nagi, 2012). This, establish the number of persons that feel thermal uncomfortable, being the
22
ones who voted in the categories: very hot, hot, cold or very cold (Djongyang, Tchinda, & Njomo, 2010). Thermal dissatisfaction it’s determined mathematically, Equation II.3, or graphically, Figure II.4.
𝑃𝑃𝐷 = 100 − 95𝑒−(0.03353𝑃𝑀𝑉4+0.2179𝑃𝑀𝑉2) 2.3
PMV-PPD model is the one used in ISO 7730 (2005) and ASHRAE 55 (2013), the standards most used to assess thermal comfort of neutral environments. According to the standards, thermal environments that are considered comfortable should have a PMV between -0.5 and +0.5 and a PPD inferior to 10%. When PMV equals zero then thermal neutrality occurs (Broega, 2008).
From the analysis of Figure 2.4, it is visible that even in a neutral environment PPD index is never inferior to 5%. It is not possible then to have an environment that completely satisfies all the individuals of a group; different individuals have different thermal sensations (Olesen & Brager, 2004). Another conclusion can be achieved through the curve symmetry that shows that the dissatisfaction with the environment follows the same pattern despite the motive is the hot or cold (Chvatal, 2007).
Figure 2.4 – Relationship between PMV and PPD (Djongyang et al., 2010)
2.3.1.4
Comfort zone diagram
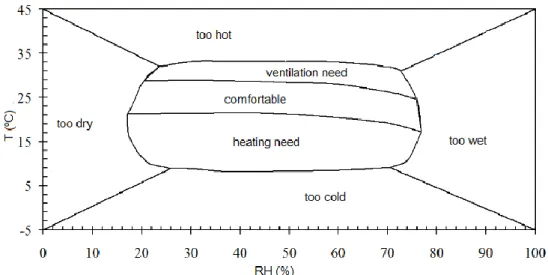
World Meteorological Organization diagram (Figure 2.5) is also used to assess thermal sensation. Its utilization is easy and simple, because only needs the knowledge about relative humidity and temperature, and can be a great tool to choose an intervention to improve environmental conditions (Meles, 2012). This diagram has two entries, temperature and relative humidity, and shows the zones where there are comfort or stress.
23
Through observation it is possible to affirm that the area thermally comfortable is between 20% to 80% of relative humidity and between approximately 8oC to 33 oC of temperature. However, between 8 oC to 20 oC it’s necessary a heated environment and between 26 oC to 33 oC a ventilated environment so there is actually thermal comfort (Souza & Nery, 2011).
Figure 2.5 – World Meteorological Organization (WMO) Diagram (adapted from Ferreira & Talaia, n.d.)
2.3.2 Thermal Stress
To Miguel (2005), thermal stress by heat can occur due to: increase of metabolism related to activity, increase of air temperature, increase of mean radiant temperature and changes in air velocity and/or increase of air humidity. According to the same author (2005), hot thermal environments are those for which the “thermal balance, calculated in the base of heat exchanges by radiation, evaporation and convection, is positive”. Heat stress occurs when a person gains heat faster than loses it and that happens when the environmental and individual factors interact in a way that produces a body temperature increase (Bradshaw, 2006; Araújo, 2010). The goals of the thermal stress assessment are the determination of the factors that cause it and the measurement of its intensity, in terms of effects on health, comfort and performance (Budd, 2001).
2.3.2.1 Assessment - WBGT
The index to assess hot thermal environments, purposed by ISO 7243:1982, is the Wet Bulb Globe Temperature (WBGT). This index was developed by Yaglou and Minard, in 1957 (as cited in Parsons, 2006), with the intuit to control the accidents caused by heat
24
at military training camps of the Army and Marine and is referred by many authors as the most adequate index to industrial application (Budd, 2008; Pourmahabadian, Adelkhah & Azam, 2008).
The index, when analyzed with clothing and metabolism resultant from physical activity, shows if determined hot environment constitutes risk to the worker (Parsons, 2006; 2013). The equations 4 and 5 represent how WBGT can be calculated outdoors and/or indoors, respectively (Lemke & Kjellstrom, 2012).
Outside, in conditions of direct wave radiation
𝑊𝐵𝐺𝑇 = 0.7𝑡𝑛𝑤+ 0.2𝑡𝑔+ 0.1𝑡𝑎 2.4
Inside or outside in conditions of no direct wave radiation
𝑊𝐵𝐺𝑇 = 0.7𝑡𝑛𝑤+ 0.3𝑡𝑔 2.5
Where: 𝑡𝑛𝑤– Natural wet bulb temperature
𝑡𝑔 – Temperature of a 150mm diameter black globe 𝑡𝑎 – Air temperature
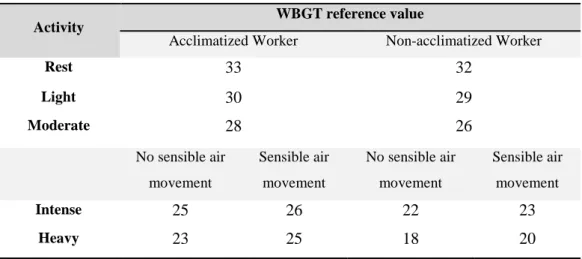
WBGT values depend on the physical and individual parameters. It is necessary to know if the worker is acclimatized or non-acclimatized and the intensity of its activity. Reference values for WBGT are shown in Table 2.1. If these values are exceeded then it is necessary to take certain measures. These measures have a role in trying to reduce heat stress through various methods such as control the environment, the level of activity, the acclimatization or the individual protection.
According to ISO 7726 (1998) an environment can be homogeneous or heterogeneous. A homogeneous environment is that where there are variations, in maximum 5%, in the values of the physical variables around the person. A heterogeneous environment is that that shows variations in the values of the physical variables around the person, superior to 5%.
In case of a heterogeneous environment, WBGT need to be measured at three levels, that represent the head, abdomen and ankles height, in relation to the ground. If the person is sited, than the measurements are done at 0.1 m, 0.6m and 1.1 m of the floor; if the person is standing than the measurements are done at 0.1m, 1.1 m and 1.7 m.
25
𝑊𝐵𝐺𝑇 =𝑊𝐵𝐺𝑇ℎ𝑒𝑎𝑑+ 2𝑥𝑊𝐵𝐺𝑇𝑎𝑏𝑑𝑜𝑚𝑒𝑛+𝑊𝐵𝐺𝑇𝑎𝑛𝑘𝑙𝑒𝑠
4 2.6
Table 2.1 – WBGT reference values (adapted from Araújo, 2010; Parsons, 2006) Activity
WBGT reference value
Acclimatized Worker Non-acclimatized Worker
Rest 33 32 Light 30 29 Moderate 28 26 No sensible air movement Sensible air movement No sensible air movement Sensible air movement Intense 25 26 22 23 Heavy 23 25 18 20
The existence of a homogeneous environment is confirmed by making the calculations suggested by ISO 7726 (1998). The ISO states that an environment can be considered homogeneous “when the deviations between each of these quantities and their mean spatial value calculated as a mean of the locations does not exceed the values obtained by multiplying the required measuring accuracy from table 2 by the corresponding factor X listed in table 4”. These tables, 2 and 4, correspondent to Table A.1, can be seen in Annex A.
2.3.2.2 Effects of hot environments
The effects of heat in Men can be psychological, psychophysiological and pathological. Psychological effects concern to discomfort and malaise, psychophysiological to an increased workload of the heart and respiratory system and pathological to aggravation of diseases. The psychological discomfort can range from a feeling of annoyance to a reduction in the efficiency of manual tasks; the decrease of the work capacity is also at risk and workload of the heart and imbalance in body water balance can occur. It is possible to have a heat stroke when heat stress and workload are high and the risk of this situation increases when the worker is not acclimatized. Exhaustion occurs when there is a deficiency of water or sweat on the body. Nausea, fatigue, irritability or fainting are other signs of the effect of heat.
26
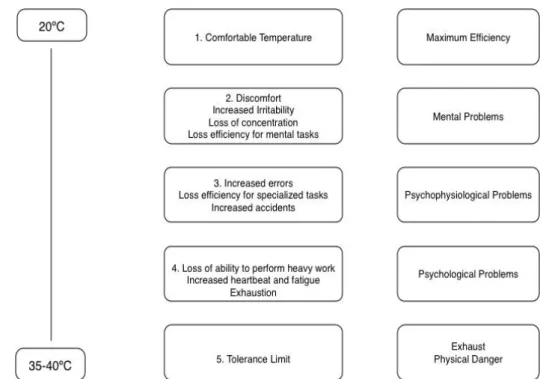
Heat exposure also affects emotion and motivation at work, which can lead to decreased performance and ability to execute, that are reflected in absenteeism and productivity. Figure 2.6 shows the effects on the Men of the temperature increases, in a range from 20
o
C, comfortable temperature, to 35-40 oC, the limit that a worker can tolerate. The efficiency that depends on the temperature, as mentioned, is also shown; at the comfortable temperature it is in its maximum and in the limit does not exist, giving place to exhaustion.
Figure 2.6 – Effects of temperature increases (adapted from Grandjean, 1998)
2.3.2.3 Heat protection / controlling measures
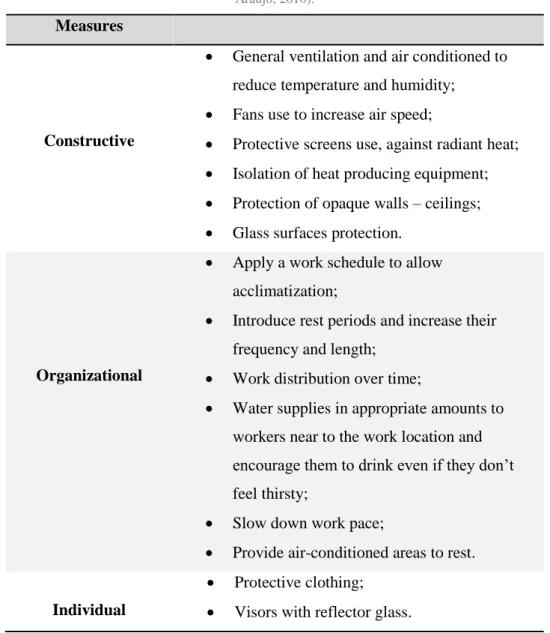
Thermal environment can be controlled or improved by constructive, organizational and/or individual protection measures. These measures can be applied in any work local and are shown in Table 2.26.
Constructive, or engineering, measures are those that aim to decrease or cancel the risk. Organizational, or administrative, measures predict the work organization and take into account the life quality of all workers in exposure. Individual measures, as the name indicates, are those measures that are applied in the individual, with protective equipment that protect workers’ physical integrity and health.
At organizational terms, the reduction of exposure time, the increasing of breaks and the transference of a large energy operation to a fresher period, for example, can make the
27
difference to the workers’ health. These measures should be taken into account in the task-planning phase. The limit loss by sweating equals 4 liters in 8 working hours so water intake should be of half a liter per hour, and the replacement be done regularly.
Table 2.2 – Protective measures (Sousa, et al., 2005; Miguel, 2005; Workplace Safety & Health Division, 2007; Araújo, 2010).
Measures
Constructive
General ventilation and air conditioned to reduce temperature and humidity;
Fans use to increase air speed;
Protective screens use, against radiant heat;
Isolation of heat producing equipment;
Protection of opaque walls – ceilings;
Glass surfaces protection.
Organizational
Apply a work schedule to allow acclimatization;
Introduce rest periods and increase their frequency and length;
Work distribution over time;
Water supplies in appropriate amounts to workers near to the work location and encourage them to drink even if they don’t feel thirsty;
Slow down work pace;
Provide air-conditioned areas to rest.
Individual
Protective clothing;
Visors with reflector glass.
The employer must allow sufficient acclimatization period before full workload. Regarding to individual protection, the clothing is very important to maintain the superficial temperature of the human body and should present good ventilation, flexibility and reflection. Wearing loose cloths help sweat evaporation but stops radiant heat (Miguel, 2005; Rodrigues, 2007). Beyond control measures, workers should have instruction in order to understand the symptoms of dehydration, exhaustion or fainting.
28
2.4 Human Thermal Modeling
Thermal comfort analysis can be performed using diverse techniques and models of comfort, such as Computation Fluid Dynamics (CFD) and numerical simulations (Murakami, Kato, & Zeng, 2000). The majority of this techniques uses manikins and other objects to simulate the human thermal response, in various conditions of a certain environment (Kilic, Kaynakli, & Yamankaradenix, 2006; Sorensen & Voigt, 2003). These models and numerical simulations can model either the environment (1) or the human body and its reaction to the environment (2).
Regarding to environment’ modeling (1), CFD are used to analyze the Heating, Ventilating, and Air Conditioning systems, particularly in the vicinity of the human body. CFD model can be coupled with thermoregulatory model of the human body to describe the airflow patterns, temperature distribution, air humidity and heat and mass transfer between the ventilation air and a manikin inside a room (Rodrigues et al., 2013).
According to a review made by Dear et al. (2013), about the evolution of the numerical models of human thermoregulation and thermal comfort, Wissler (1964) divided the body into 15 cylinders and Stolwijk and Hardy (1966) into 3. The models evolved from cylinders to parts with Stolwijk’s model, in 1971, and from that, to more elements or segments; Fiala et al. (1999) and Tanabe at al. (2002) models used 15 cylindrical body elements and 16 body segments, respectively. According to studies of various authors, the models that reproduce the most reliable results are based on 16 segments: head, chest, back, pelvis, left shoulder, right shoulder, left arm, right arm, left hand, right hand, left thigh, right thigh, lef leg, right leg, left foot and right foot (Huizenga et al., 2001; Sorensen & Voigt, 2003; Tanabe, Kobayashi, Nakano, Ozeki & Konishi, 2002; Wan & Fan, 2008). The evolution of the body in thermoregulation models increased their complexity, being able to be compared to thermal manikins. But, the models have the advantage of achieving results related with physiological responses to thermal states and not only the thermal states themselves, which happens when the manikins are used. Concerning to the human body reactions to the environment (2), the models used are, in general, based on the Stolwijk’s (1971) thermoregulation model. This model is based in six segments – head, torso, arms, hands, legs and feet. Each body segment is composed by four layers – core, muscle, fat and skin (Tanabe et al., 2002; Wan & Fan, 2008; Yi, Fengzhi, Yingxi, & Zhongxuan, 2004).
29
Human body can adjust heat exchanges with the environment around to maintain a constant temperature, but when in extreme heat, cold or wind, Man uses clothing as a way to help the body to adapt to the environment (Wan & Fan, 2008). Thus, comfort models can also include the effect of the presence or absence of cloth (Wan & Fan, 2008).
32
This work follows a deductive approach that is a theory conceptualization and hypothesis are developed and after it a research strategy is settled to test the hypothesis. This kind of approach is based in five steps: (1) hypothesis deduction from the theory; (2) hypothesis expression in operational terms that is proposition of a relation between two or more specific variables; (3) hypothesis test involving experimentation; (4) examination of the results from the experiment; and, (5) based on the results adaptation of the established model the theory. The deductive approach has scientific principles, going from the theory to data and it is settled from the collection of quantitative data (Araújo & Tereso, 2013). In this work, the method of research followed the mixed-method: it was used both quantitative and qualitative techniques to collect data. Regarding to the type of study, this was a longitudinal study–over time, allowing the study of change and development (Araújo & Tereso, 2013).
Five main steps were defined to perform this study and presented on Figure 3.1. Briefly an explication of each one is provided bellow.
Figure 3.1 – Research Methodology
3.1 Selection of an area
To develop this thesis, it was necessary to understand the company as a system that is how the workers, the equipment’s and the process were related.
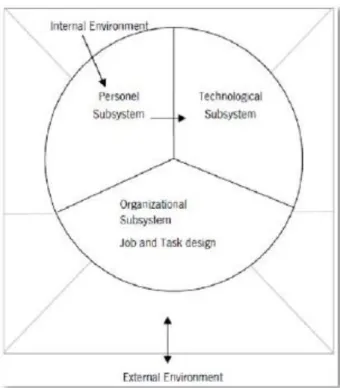
A basic work-system model proposed by Kleiner (2006) indicates that organizations must be integrated in an overall system. As visible in Figure 3.2, a system is composed by a personnel subsystem, a technological subsystem and an organizational subsystem (task and organizational design. The balance of a system can be influenced by the internal environment, and external environment. . These parts interact with each other within the basic system to achieve a balance where maximum process performance and workers wellbeing are accomplished.
Selection of the Workplace Measuring points Selection Data Collection Data Analysis Conclusion and Future Work
33
Figure 3.2 - Work system model (adapted from Kleiner, 2006)
According to Karwowski (cited by Kleiner, 2006), the technological subsystem is , related to the “system of people and organizations, knowledge, processes and devices that go into creating and operating technological artifacts, as well as the artifacts themselves”
The personnel subsystem is defined by those who work; the interrelation and communication between humans. This subsystem is a result between the hierarchies of an organization, self-worker, workers between each other and the person from whom the service is addressed.
The organizational subsystem is composed by several sub-systems related to physical, social or informational aspects of the environment.
Taking in consideration the system approach a further explication of the technological and personnel subsystems is provided in the following subsections.
3.1.1 Technological subsystem
The workplace selected was the Twisting area. The criteria used for area’ selection was related to several factors namely, the productive process, the experience of the Occupational and Health technical of the company, and the sensibility to this topic. The Twisting area has approximately 6000m2 and is situated in hall 2, floor 0. The
34
machines, twisters (Figure 3.3), work continuously, 24 hours a day. These machines are accountable for a great source of radiant temperature.
Figure 3.3 – ICBT twister
Twisters are responsible for the twist of yarns, obtaining rope with improved characteristics. In the twisting area there are 18 ICBT and 4 Volkman twisters and 3 winders. The winding process is performed to give the appropriate dimension to the bobbins so that they can be used in the twisters. From there, the bobbins with new dimensions are used to supply the ‘pots’, the inferior part of the twisters.
The supply of yarn comes from external providers and is packed on pallets. Each pallet has three layers of bobbins and is placed in an area close to the twisters, by forklifts. The rope resulting from twisting is rolled into tubes, of plastic or cardboard, forming bobbins that are the feedstock for weaving process. The discharge of the bobbins of rope is assisted by a motor carpet that moves them, from their point to the discharge point in the twister. Hence, are conditioning in cars that have capacity to 72 units of bobbins, 36 in each side of the car. These cars are placed in an intermediate storage for later sent for weaving process. The pallets of yarn and the cars are visible in Figure 3.4.
35
3.1.2 Personnel Subsystem
According to the collected information from the Human Resources Department, 84 workers developed their activity in this area. 41 of them work permanently on C-ITA and 43 are from external labor. Of the total number of workers, 80 are male and 4 female. Women’s only work in winding process. Each shift has a total of 8 hours and there are three different shifts: (1) from 06h00 to 14h00, (2) from 14h00 to 22h00 and (3) from 22h00 to 06h00. From the total of working time, half an hour is settled for meals. Regarding the breaking periods, it is not established a set time or a fixed amount of breaks as they are dependent of the needs of each one.
3.2. Selection of the measuring points and strategy
The measurements points, 29 in total were defined according to the layout of the area, available from the company archive (Figure 3.5). The technological and personnel subsystems as well as the activity’ process were also take into consideration, namely the location of ventilation areas such as doors and windows, as well as the locals were there are more movements from workers. Through the layout analysis and direct and indirect observations on the field, it was possible to identify the 18 ICBT twisters (colored with blue in Figure 3.5), the 4 Volkman twisters (colored with yellow in Figure 3.5) and the 3 winders (in the right side of Figure 3.5). It is important to notice that the ventilation system was removed in the past as the excess of humidity was associated with the breaking of the yarn. As workers were not fixed on a single workplace, several intermediate points were also defined (marked with crosses in Figure 3.5). These points were established to ensure that no major differences were presented on the 29 points’ surrounding areas.
According to the ISO 7726:1998 recommendations for standing work, three level measures were defined: at 0.10m, 1.10m and 1.70m, from the ground. To check if the environment could be considered homogeneous, air temperature, radiation, air velocity and humidity need to be practically uniform, at a given point, around the subject. The ISO 7726 (1998) guidelines were followed to verify this issue. Accuracy of the results is obtained for a Ta equal to ±0.05 0C, for a Tg equal to ±20C and for a Va equal to ±0.05 + 0.05 m/s (see Table A.1). According to these guidelines, multiplying the accuracy with a certain value, named factor x, Ta should be equal to ±1.50C, Tg equal to