Caminhos de Geografia Uberlândia v. 10, n. 30 Jun/2009 p. 111 - 119 Página 111 VARIATION OF THE OCCUPIED AREA BY RIPARIAN ZONE ACCORDING TO
CONSIDERED WIDTH1
Felipe Muniz Silveira Engenheiro Ambiental - [email protected]
Alexandre Marco da Silva Prof. Dr. Departamento de Engenharia Ambiental - UNESP Sorocaba [email protected]
Priscila Ikematsu Engenheira Ambiental - [email protected] Michele Bomback Engenheira Ambiental – [email protected] Fabíolla Pereira de Paula Graduanda em Engenharia Ambiental - UNESP Sorocaba - [email protected] Davi Pajaro Nogueira Engenheiro Ambiental – [email protected]
Sergio Henrique Alves Graduando em Engenharia Ambiental - UNESP Sorocaba - [email protected]
ABSTRACT
Considering that the riparian vegetation provides many “ecological services” and such services vary according to this width, in this study we surveyed some morphometrical parameters of the Sorocaba city, as well as we estimated the area and respective percentage occupied by riparian zone according to the riparian buffer width. The considered width values were: 30, 45, 60 and 90 meters. Two digital cartographic bases were used: hydrographic and headwater maps. These two maps were joined and the maps containing the buffer zones were created. Considering 30 m width, the buffer zone occupies area of 92.2 km2, corresponding to 20.4% of the study area. For 45 m width, the area was 118.9 km2 (26.1%). For 60 m width, the area was 141.2 km2 (30.9%) and for 90 m width the area was 199 km2 (43.7%). Additionally, it was possible to create the Riparian Buffer Index that permits to estimate, using the total channels length, the destined area to be reforested according to the desired riparian buffer width, as well as the costs of this project.
Key-words: buffer zone, riparian buffer width, riparian environment, Riparian Buffer Index.
VARIAÇÃO DA ÁREA OCUPADA PELA ZONA RIPÁRIA CONFORME A LARGURA CONSIDERADA
RESUMO
Considerando que a vegetação ripária promove vários “serviços ecológicos” e estes variam conforme a largura, neste estudo nós levantamos alguns parâmetros morfométricos no município de Sorocaba, bem como estimamos a área e respectiva porcentagem ocupada pela zona ripária conforme a largura deste ecossistema. As larguras consideradas foram 30, 45, 60 e 90 metros. Duas bases cartográficas foram usadas: mapas de hidrografia e de nascentes. Estes dois mapas foram juntados e os mapas contendo as zonas “buffer” foram criados.
1 Recebido em 27/09/2008
Caminhos de Geografia Uberlândia v. 10, n. 30 Jun/2009 p. 111 - 119 Página 112 Considerando largura “buffer” de 30 metros, a área ocupa 92,2km2, correspondendo a 20,4% da área de estudo. Para largura de 45m, a área foi de 118,9km2 (26,1%). Para largura de 60m, a área foi 141,2 km2 (30,9%) e para 90m a área foi 119 km2 (43,7%). Adicionalmente, foi possível criar o “índice de zona buffer” que permite estimar, usando o comprimento total de canais a área destinada a ser reflorestada conforme a largura “buffer” desejada, bem como estimar custos associados.
Palavras-chave: zona “buffer”, largura ripária “buffer”, ambiente ripário, índice “buffer” ripário.
INTRODUÇÃO
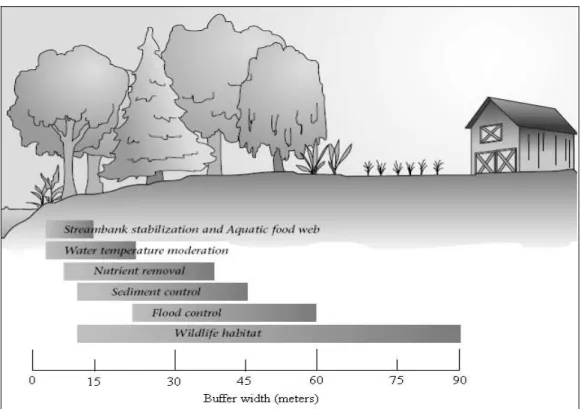
Riparian zones occur as transitional areas between aquatic and upland terrestrial habitats (Naiman & Décamps, 1997) and they frequently harbor a disproportionately high number of wildlife species and perform a disparate number of ecological functions (Tjaden and Weber, 2004, Figure 1) when compared to most upland habitats (Fischer et al., 2000). It is a defined distance from a stream where land use activities are restricted for stream protection purposes, and it has becoming an increasingly common environmental / water resources management tool (Naiman & Décamps, 1997; Sparovek et al., 2002).
The riparian vegetation has been constantly and directly affected by the deforestation worldwide, due to important and interesting components that are favorable to some human activities (Fischer et al., 2000). This ecosystem has been protected by the Brazilian Federal Law 4771/65 and is considered Area for Permanent Preservation. Table 1 shows the minimum width of vegetation string that must be preserved according to water course width.
Figure 1 – Buffer width for specific objectives. Source Tjaden and Weber (2004) – modified (width unity converted from international to metric system).
Caminhos de Geografia Uberlândia v. 10, n. 30 Jun/2009 p. 111 - 119 Página 113 Table 1
Strip zone that must be considered as Area for Permanent Preservation according to the width of the water bodies
Situation Strip zone with vegetation
Streams up to 10 m width 30 m in each margin
Streams from 10 m to 50 m width 50 m in each margin Rivers from 50 m to 200 m width 100 m in each margin Rivers from 200 m to 600 m width 200 m in each margin
Rivers wider than 600 m 500m in each margin
Leaks or reservoirs located in urban zones 30 m width surrounding the water body Leaks or reservoirs located in rural areas (smaller than 20 hectares) 50 m width surrounding the water body Leaks or reservoirs located in rural areas (bigger than 20 hectares) 100 m width surrounding the water body
Hidroeletric dams 100 m width surrounding the water body
Headwaters 50 meters radius
Source: Programa Estadual de Microbacias Hidrográficas (www.cati.sp.gov.br).
The area of the landscape / city that must be destined for riparian zone is normally unknown. Fischer et al. (2000) affirm that such area comprise a small percentage of the landscape, often less than one percent. However, this value might expressively change, and the length of river network per area (Silva et al., 2006) of considered area can be useful information to compute such information.
In this paper we present a dataset about the river network for Sorocaba City and the area and percentage that is occupied by riparian buffer zone, considering four buffer string widths (30m, 45m 60m or 90m).
Site description
Environmental characterization of the study area
The study area is Sorocaba. Sorocaba is a city located in São Paulo State (Figure 2). It has 456
km2 area and 532,000 inhabitants, 98% of them living in urban settlements. It is an important
socio-economic center, encompassing 1,078 industries and showing an advanced urban expansion.
The annual average temperature is 21.4oC and annual average rainfall height is 1,285 mm.
Topography is highly changeable. In the western portion, where the land is intensively used for agriculture, the relief is plane or smoothly waved. In the eastern portion, the relief is waved / strongly waved and is, in such portion of the city, that the natural remnant vegetation is a little more conserved. The analysis of the digital elevation model of the city reveals that the elevation ranges from 500 to 1033 m above the sea level. There are two main soil classes: Yellow-red Alfisols and Red Oxisols, both dystrophic (Oliveira et al. 1999).
In Sorocaba occurs the biome called “Mata Atlântica”, but it is a transition area (ecotone) between the biomes “Mata Atlântica” and “Cerrado” (www.ibge.gov.br). It encompasses an area largely destroyed for agriculture, pasture (Durigan et al., 2003) and urban expansion. According to newest land cover map of the city (Silva, 2005), the main land cover category is pasture, occupying 36.2% of the study area. The category of urban settlement occupies 18.7% and the category of Natural Remnant Vegetation / Reforestation occupies 22.1%.
Procedures
The river network and all headwaters of the study area were on-screen digitalized using 1:50,000 maps. Figure 3 shows the hydrographic and the headwater maps.
Initially, a database concerning some morphometric data of the study area was elaborated. Using the river network of the study area (vectorial format) and the Arcview 3.1 software (ESRI, 1996), parameters “total length of the rivers network” and “number of headwaters” were computed. Hence,
Caminhos de Geografia Uberlândia v. 10, n. 30 Jun/2009 p. 111 - 119 Página 114 the others parameters were mathematically determined using the following equations, as mentioned in Silva et al. (2006).
Rd = Nh / A (1)
Where:
Rd – River density (number of headwaters per Km2
); Nh – number of headwaters; A – watershed/study area (Km2 ). Dd = T.C.L. / A (2) Where:
Dd – drainage density (Km per Km2
); T.L.C. – total channels length (Km).
A – watershed/study area (Km2
).
Mc = (1 / Dd) * 1000 (3)
Where:
Mc – Maintenance coefficient (m2) - indicates the average area to keep one meter of channel in
continuous flow.
Dd – drainage density (Km per Km2
);
A – watershed/study area (Km2
).
Figure 2 - Localization of the study area (gray patches in map of the right side – urban settlement). For the computation of the riparian buffer zone, the cartographic bases were: hydrographic map and a map containing all digitalized / georreferenced headwaters. This part of the study was developed using the Idrisi software - version Kilimanjaro (Eastman, 2004) and the methodology was based in that one presented in Narumalani et al. (1997) and in Silva (2003).
Using the Buffer routine of the Idrisi and the rasterized hydrography map of the study site, the map containing the 30 meters buffer strip zone was created. The value of 30 meters used here was
Caminhos de Geografia Uberlândia v. 10, n. 30 Jun/2009 p. 111 - 119 Página 115 adopted in order to follow the Brazilian Federal Law (Table 1). In addition, using the headwaters map (already rasterized), the map containing the buffer zone of the headwaters (radius = 50m) was also created. The value r=50 meter was considered in order to also follow the Brazilian Federal Law.
Figure 3 - Hydrographic (left) and headwater maps of the Sorocaba city.
These two maps were overlapped through the Overlay routine of the Idrisi, in order to generate a new map containing simultaneously the buffer area of the headwaters and the buffer area of the water courses in the study area. Figure 4 shows, as example, a part of the hydrography and its respective 30m buffer zone.
Once created such map, the area and the percentage of the occupation of the buffer area in relation to the total study area was computed. In order to check how much of the area of Sorocaba the buffer strip occupies according to others values widths, the same procedure was carried out for 45, 60 and 90 meters. These width values were chosen according to that ones cited in Tjaden and Weber (2004) – see Figure 1.
Results and Discussion
Analyzing Figure 3 (already presented) it can be noticed that the hydrography of Sorocaba has predominantly a stream pattern considered dendritic. Table 2 presents the values obtained for investigated morphometric parameters. In Sorocaba occurs almost 1,200 kilometers of rivers, independently of the hierarchical order of the river. The parameter “drainage density” presented
value of 2.67 km of rivers per km2. According to the interpretation table cited in Silva et al. (2003),
this value indicates that Sorocaba presented a low drainage density. Although the value was considered low, the value observed here was bigger than the values found by Silva et al. (2006) for
the seven meso-scale river basins (values changed from 0.871 to 1.651 km of rivers per km2), by
Cardoso et al. (2006) for a watershed located in Nova Friburgo (RJ – value: 2.36 km of rivers per
km2) and by Tonello et al. (2006) for a watershed located in Guanhães (MG – value: 1.05 km of
rivers per km2).
One possible reason for such differences is the rainfall amount. Another is the characteristic of geological basement of the considered areas. One of these two reasons (isolated) or, most probable, the combined effect of the two factors, might explain the regional difference of the drainage density values.
Caminhos de Geografia Uberlândia v. 10, n. 30 Jun/2009 p. 111 - 119 Página 116 Figure 4 - Part of the hydrographic map over the map buffer (gray pixels) as example.
Table 2
Values of the investigated parameters for the study area.
Parameter value
Total length of river network (meters) 1,198,887.4
Drainage density (km of river per km2) 2.67
Maintenance coefficient (m2 per m) 374.5
Number of headwaters 2,332
River density (number of headwaters per km2) 5.19
It can be seen that the rivers and headwaters (Figure 4) are not homogeneously distributed along the study area. A major concentration occurs in the eastern portion of the study area. The main possible reason that explains the heterogeneous spatial distribution of the hydrography along the study area is the geological basement. Sorocaba is situated over a transitional geological region, and the geological basement of the eastern portion is formed by crystalline rocks, while the middle and western portion is formed predominantly by sedimentary rocks.
The maintenance coefficient was 374.5 m2 per meter, and was expressively lower than the values
found by Silva et al. (2006), whose values ranged from 605.8 to 1,148.1 m2 per meter, probably due
to the same reasons early commented (climate and geology). Total number of headwaters was
2,332, and consequently the river density was 5.19 headwaters per km2. Such value was
expressively higher when compared with that ones found by Silva et al. (2006), whose values
ranged from 0.358 to 1.105 headwaters per km2.
Considering 30 meters width strip zone, we computed that (77.6) km2 of Sorocaba city must be
considered buffer zone (then, Area for Permanent Preservation). Such area represents 20.4% of the total area of Sorocaba. This value is comparatively much higher than that stated by Fischer et al. (2000), who mention that the riparian buffer area normally encompasses less than one percent of the catchment.
Caminhos de Geografia Uberlândia v. 10, n. 30 Jun/2009 p. 111 - 119 Página 117 However, this width probably fulfils only a part of the multiple functions of riparian vegetation (Tjaden and Weber, 2004, Sparovek et al., 2002). A 90 meters buffer strip adequately performs all required functions for buffer strips (stream bank stabilization and aquatic food web, water temperature moderation, nutrient control, sediment control, flood control and wildlife habitat (Tjaden and Weber, 2004)). If all riparian buffer strips had this width (90m) and all area were completely
covered with native vegetation, the area would be 199 km2 and it would occupy 43.7% of the whole
area of Sorocaba City (Figure 5).
0 20 40 60 80 100 120 140 160 180 200 30 45 60 90 Buffer width (m)
Buffer area (km2) Percentage
Figure 5 - Area (km2) and percentage of occurrence of the Area for Permanent Preservation
according to considered buffer width.
Considering the respective areas according to riparian buffer width (92.8 km2 for 30m, 118.9
km2 for 45m, 141.2 km2 for 60m and 199.0 km2 for 90m), and the total length of the rivers
network, we need 77.4 m2 of vegetated area per meter of river to fulfills the 30m width buffer
strip, 99.2 m2 of vegetated area per meter of river to fulfills the 45m width, 117.8 m2 of
vegetated area per meter of river to fulfills the 60m width and 165.9 m2 of vegetated area per
meter of river to fulfills the 90m width. Hence, the equation that describes the relation between buffer width and vegetated area is:
y = 1.4695x + 32.414 (4)
Where x = buffer width (m), y = forested area (m2)
r2 = 0.99 (significant =1%).
Considering the relation noticed here between river length and area of riparian buffer, the following equations were stated in order to compute the Riparian Buffer Index.
RBI30 = (77.4 Tlrn) 10000 -1 (5) RBI45 = (99.2 Tlrn) 10000 -1 (6) RBI60 = (117.8 Tlrn) 10000 -1 (7) RBI90 = (165.9 Tlrn) 10000 -1 (8) Where:
RBI - riparian buffer index (hectares of riparian buffer zone); Tlrn – total length of the rivers network (meters); the subscripted value of RBI is the corresponding riparian width.
Caminhos de Geografia Uberlândia v. 10, n. 30 Jun/2009 p. 111 - 119 Página 118 This value is particularly important for experts in restoration of riparian regions because in projects aiming to restore riparian buffer vegetation, normally there is an approximated number of a specimen per specie to be planted by hectares of riparian zone (Bertani et al., 2001). Once the area of riparian buffer zone is available (computed using the RBI), the number of specimens per specie will be easily determined.
In a hypothetic example, a land-cover manager wants to know how much of riparian vegetation is necessary to restore the riparian buffer zone of a determined watershed that is completely deforested. He desires 30 meters width riparian vegetation along the entire river network, once that
all rivers are up to 10 meters width. He knows that the area of the watershed is 40 km2 and the total
length of the rivers network is 50,000 meters of river network. Hence, by applying the equation (5), the result is 387 hectares of riparian buffer zone.
If the result of the equations (5) to (8) is multiplied by 1000, we also have the average cost for restoring the focused area, once that the estimated cost per hectare for restore 1 hectare of riparian forest is approximately 1,000 dollars (Joly et al., 2001).
CONCLUSIONS
According to the four riparian buffer strip here investigated, the riparian buffer can occupy from 20.4 to 43.7% of the Sorocaba City. The data base here surveyed permitted us to create a RBI (Riparian Buffer Index), that might facilitate the computation of the total buffer area and their respective estimated cost to restore the vegetation, when necessary.
Aknowledgements
To FAPESP by financial support (grant 04/13096-7) and by scholarships (grants 04/15796-6, 05/56004-8, 05/56234-3, 05/56235-0, 06/59809-0 and 06/60110-0) conceded. To “Campus
Experimental de Sorocaba – UNESP” by logistic support and by permission of use of some
equipments. REFERENCES
BERTANI. D. F., RODRIGUES, R. R., BATISTA, J. L. F., SHEPHERD, J. 2001. Análise temporal da heterogeneidade florística e estrutural em uma floresta ribeirinha. Revista Brasileira de Botânica, 24 (1), p. 11 – 23.
CARDOSO, C. A.; DIAS, H. C. T.; SOARES, C. P. B.; MARTINS, S. V. 2006. Caracterização morfométrica da bacia hidrográfica do rio Debossan, Nova Friburgo, RJ. Revista Árvore, 30, p. 241-248.
ESRI, 1996. Arcview GIS - The Geographic Information System for Everyone. Version 3.1, 350 p. DURIGAN, G & SILVEIRA, E. R. DA. 1999. Recomposição da mata ciliar em domínio de cerrado, Assis, SP. Scientia Forestalis, 56, p. 135-144.
FISCHER, R.A., CHESTER, O.M., FISCHENICH, J.C. 2000. Improving riparian buffer strips and corridors for water quality and wildlife. International Conference on Riparian Ecology and Management in Multi-land use watersheds – American Water Resources Association. 7p. Web site address:
http://www.usace.army.mil/inet/functions/cw/cecwp/ttconf/env00/b1de.pdf
JOLY, C.A.; SPIGOLON, J.R.; LIEBERG, S.A.; SALIS, S.M.; AIDAR, M.P.M.; METZGER, J.P.W.; ZICKEL, C.S.; LOBO, P.C.; SHIMABUKURO, M.T.; MARQUES, M.C.M.; SALINO, A. 2001. Projeto Jacaré-Pepira – O Desenvolvimento de um modelo de Recomposição da Mata Ciliar com base na Florística Regional. In: Rodrigues, R.R.; Leitão Filho, H.,F. (Eds.). Matas Ciliares, conservação e recuperação. Edusp / FAPESP, São Paulo, p. 271 - 287.
NAIMAN, R. J.; DÉCAMPS, H. 1997. The ecology of interfaces: Riparian Zones. Annual Review of Ecology and Systematics, 28, p. 621 – 658.
Caminhos de Geografia Uberlândia v. 10, n. 30 Jun/2009 p. 111 - 119 Página 119 NARUMALANI, S., ZHOU, Y. & JENSEN, J. R. 1997. Application of remote sensing and geographic information systems to the delineation and analysis of riparian buffer zones. Aquatic Botany, 58 (3/4), p. 393-409.
OLIVEIRA, J. B. DE; CAMARGO, M. N.; ROSSI, M.; CALDERANO FILHO, B. 1999. Mapa Pedológico do Estado de São Paulo. Legenda Expandida. Campinas: Instituto Agronômico; Rio de Janeiro: EMBRAPA – Solos, 64 p.
SILVA, A. M. 2003, Mapeamento da cobertura e uso do solo para as Bacias Hidrográficas do Alto Paranapanema, Aguapeí, Peixe/Santo Anastácio e São José dos Dourados, a partir de imagens de satélite. Segundo relatório de atividades enviado à FAPESP referente a um projeto de pós-doutoramento. Processo FAPESP 00/12939-0, 20 p.
SILVA, A. M. 2005. Cobertura do solo do município de Sorocaba-SP e implicações na fragmentação dos remanescentes florestais. Revista de Estudos Ambientais, 7 (2), p. 38 – 46. SILVA, A. M., SCHULZ, H. E., CAMARGO, P. B. 2003. Erosão e hidrossedimentologia em bacias hidrográficas. 1ª ed. São Carlos - SP: RIMA, 2003. v. 1. 138 p.
SILVA, A. M., HERPIN, U., MARTINELLI, L. A. 2006. Morphometrical characteristics of seven mesoscale river basins in São Paulo State. Caminhos de Geografia, Uberaba - MG, v. 17, n. 3, p. 20-30.
SPAROVEK, G., RANIERI, S. B. L., GASSNER, A., DE MARIA I. C., SCHNUNG, E., SANTOS, R. F., JOURBERT, A. 2002. A conceptual framework for the definition of the optimal width of riparian forests. Agriculture, Ecosystems & Environment, 90: 169 – 175.
TJADEN, R. L. AND WEBER, G. M. 2004. Riparian buffer management: riparian forest buffer design, establishment, and maintenance. Fact Sheet 725, Maryland Cooperative Extension – University of Maryland, 8 p.
TONELLO, K. C. ; DIAS, H. C. T. ; SOUZA, A.L. ; RIBEIRO, C.A.A.S. ; LEITE, F. P. 2006. Morfometria da bacia hidrográfica da Cachoeira das Pombas, Guanhães, MG. Revista Árvore, v. 5, p. 849-857.