IoT Enabled Aquatic Drone for Environment Monitoring
João Ricardo Baptista de Matos
Dissertação submetida como requisito parcial de obtenção do grau de Mestre em Engenharia de Telecomunicações e Informática
Orientador(a):
Professor Octavian Adrian Postolache, ISCTE-IUL
Co-orientador(a):
Professor Anders Lyhne Christensen, ISCTE-IUL
ABSTRACT
This thesis presents a platform that tackles environment monitoring by using air and water quality sensors to provide data for the user to know what is happening in that surveilled area. The hardware is incorporated in a sensing module in order to be used with an Unmanned Surface Vehicle (USV).
It presents a monitoring system based on Raspberry Pi platform and a multichannel sensing module associated with water quality and air quality measurement parameters. Thus, the temperature, relative humidity and gas concentration are measured as well as the underwater acoustic signals using a hydrophone. The data is stored on the memory of the drone’s computational platform (Raspberry Pi), and synchronized with a remote server database. Audio streaming capabilities were implemented in the server side. Additionally, a mobile application was developed to be used by people working in the field for data visualization, audio streaming playback and statistical analysis (by showing plotted data).
RESUMO
O intuito desta dissertação é apresentar uma plataforma de monitorização ambiental através da instalação de sensores de qualidade do ar e da água de forma a fornecer dados ao utilizador daquela área vigiada. O hardware é apresentado num módulo onde estão presentes todos os componentes por forma a poder ser usado num drone aquático.
É apresentado um sistema de monitorização baseado no sistema de processamento Raspberry Pi e um módulo multicanal de sensores de medição de qualidade do ar e qualidade da água. Sensores esses de medição da temperatura, humidade relativa e concentrações de gases tal como a medição de sinais de áudio debaixo de água com o uso de um hidrofone. Os dados estão alojados na memória do sistema computacional do drone (Raspberry Pi) e estão sincronizados com uma base de dados remota alojada num servidor cloud. Um sistema de streaming de áudio foi também implementado do lado do servidor. Adicionalmente, foi desenvolvida uma aplicação móvel que permite visualizar os dados provenientes dos sensores, reproduzir a stream de áudio e também analise de estatísticas (com apresentação gráfica dos dados).
ACKNOWLEDGMENTS
Firstly, I would like to thank Professor Octavian Postolache for all the hard work in providing all the materials, the workspace and all the help in the making of the thesis in general. Even with busy schedules, always showed availability to help in whatever he could.
Would like to thank Professor Anders Christensen and the BioMachines lab for providing a Raspberry Pi 2 and some sensors right in the beginning that allowed me to fully explore, learn and test on the Raspberry that enabled me to work more flawlessly in the upcoming months. Also for providing an aquatic drone in order to do the field tests.
To the lab technician Hugo Silva for the hard work in making the final circuit board that made the live tests possible. For all the persistency and patience in having the final product fully working, thank you Hugo.
To my friends and fellow Master’s colleagues Nuno Santos, Nuno Pardal and Rui Rosa. We spent a lot of time together doing our own dissertations with continuous inputs, opinions and ideas that made this journey easier.
To my friends Tiago Saraiva, André Silvério and Diogo Ferreira for showing concern, providing inputs and ideas whenever I got stuck with issues.
FIGURES
Figure 1 - BeagleBone Black ... 7
Figure 2 - Arduino Uno ... 8
Figure 3 - Arduino Mega ... 9
Figure 4 – Raspberry Pi 3 ... 10
Figure 5 - Cirrus Logic card installation ... 11
Figure 6 - Cirrus Logic Audio Card and the possible connections [21] ... 12
Figure 7 - Plantronics USB Audio Adapter ... 13
Figure 8 – Sea-Phone Hydrophone [22] ... 13
Figure 9 - SQ26-H1B Hydrophone [23] ... 14
Figure 10 – Digital Thermometer DS18B20 [24] ... 15
Figure 11 - LM35 ... 15
Figure 12 - HIH4000 ... 16
Figure 13 - Structure of the TGS2600 ... 17
Figure 14 - TGS2600 gas sensor [27] ... 17
Figure 15 – Sensing element of the TGS800 [28] ... 18
Figure 16 - TGS800 gas sensor ... 18
Figure 17 - Inside structure (cut view) of TGS800 [29] ... 18
Figure 18 - Adafruit ADS1015 12bit ADC ... 19
Figure 19 - Structure of the MCP3004 [31] ... 19
Figure 20 - MCP3004 ... 20
Figure 21 - Cellular standards comparison ... 24
Figure 22 - Hardware system architecture overview ... 27
Figure 23 - Circuit schematics ... 28
Figure 24 - HIH 4000 connections ... 29
Figure 25 - LM35 connections ... 30
Figure 26 - Adafruit's Ultimate GPS Breakout v3 ... 30
Figure 27 - Hydrophone connected to the USB audio card ... 31
Figure 28 - Raspberry Pi 3 with the components connected ... 32
Figure 29 - Voltage Divider ... 32
Figure 30 - ZTE MF910 LTE Mobile Router ... 33
Figure 31 - Software system architecture ... 35
Figure 32 - Data acquisition script flow chart ... 37
Figure 33 - Signals script flow chart ... 38
Figure 34 - Raspberry signalling scheme ... 39
Figure 35 - Data acquisition python functions ... 39
Figure 36 - Code snippet of the sensors' thread ... 40
Figure 37 - Code snippet of the signals' script ... 41
Figure 38 - Databases' structure ... 42
Figure 39 - Example of an NMEA message ... 43
Figure 40 - cgps output (GPSd)... 43
Figure 41 - FFmpeg output... 44
Figure 42 - Code snippet of FFT (android) ... 45
Figure 45 - Flow chart for the latest data returning script ... 48
Figure 46 - Flow chart for the signal triggering script ... 49
Figure 47 - PHP signals' script code snippet ... 49
Figure 48 - PHP latest value script code snippet ... 50
Figure 49 - PHP all data returning script code ... 51
Figure 50 - JSON output example ... 51
Figure 51 - Wowza Streaming Engine main screen ... 52
Figure 52 - Main Activity flowchart ... 53
Figure 53 - Main Activity screen shot ... 54
Figure 54 - Graphs activity flowchart ... 55
Figure 55 - Sensors' data in graph format ... 56
Figure 56 - FFT data Activity flowchart ... 57
Figure 57 - FFT audio data Activity ... 58
Figure 58 - Audio waveform (time domain) ... 59
Figure 59 - Android code snippet of data receiving interface method ... 60
Figure 60 - Android code snippet get data method ... 61
Figure 61 - AsyncTask code snippet ... 61
Figure 62 - JSON data parsing and plotting ... 62
Figure 63 - Android fft graph code snippet ... 63
Figure 64 - USV components ... 65
Figure 65 - USV with the components installed plus mobile application ... 65
Figure 66 – Deploying the USV in the lake ... 66
Figure 67 - USV deployed ... 66
Figure 68 - USV test trajectory (start red circle; finish yellow circle) ... 67
Figure 69 - Main screen after the test ... 68
Figure 70 - Audio waveform in the time domain ... 69
Figure 71 - Audio FFT data from the tests ... 70
Figure 72 - Audio FFT with wider spectrum ... 71
Figure 73 – Relative humidity values (%) ... 72
Figure 74 - Temperature values (ºC) ... 73
Figure 75 - Gas sensor values ... 74
TABLES
Table 1 - BeagleBone original and BeagleBone Black specifications [17] ... 7ACRONYMS & ABBREVIATIONS
IoT Internet of Things
USV Unmanned surface vehicle
US Unmanned Systems
UV Unmanned Vehicles
GPS Global Positioning System DSR Design Science Research
DSRMPM Design Science Research Methodology Process Model ICCPCT International Conference on Circuit, Power and Computing
Technologies
GUI Graphical User Interface CPU Central Processing Unit USB Universal Serial Bus
HDMI High-Definition Multimedia Interface GPIO General-purpose input/output
GNSS Global Navigations Satellite System LTE OS IDE ADT API AVD Long-Term Evolution Operating System
Integrated Development Environment Android Development Tools
Application Program Interface Android Virtual Device UMTS
HSPA LTE-A
Universal Mobile Telecommunications System High Speed Packet Access
CONTENTS
ABSTRACT ... ii
ACKNOWLEDGMENTS ... iv
FIGURES ... v
TABLES ... vi
ACRONYMS & ABBREVIATIONS ... vii
CONTENTS ... viii 1 ... 1 Overview ... 2 Motivation ... 3 Context ... 3 Objectives ... 5 Literature Review ... 6 1.5.1 Computational Platforms ... 6 1.5.1.1 BeagleBone ... 6 1.5.1.2 Arduino ... 7 1.5.1.3 Raspberry Pi 3 ... 9 1.5.2 Audio ... 11
1.5.2.1 Cirrus Logic Audio Card ... 11
1.5.2.2 USB Audio solution ... 12
1.5.2.3 Plantronics USB Audio Adapter ... 12
1.5.2.4 SS03-10 Sea-Phone Hydrophone ... 13
1.5.2.5 SQ26-H1B Hydrophone ... 13
1.5.3 Temperature Sensors ... 14
1.5.3.1 Waterproof Digital Thermometer DS18B20 ... 14
1.5.3.2 LM35 Temperature Sensor ... 15
1.5.6 GPS ... 20
1.5.7 Mobile application platform... 20
1.5.7.1 Android ... 21 1.5.7.2 iOS ... 21 1.5.7.3 Windows Phone ... 22 1.5.8 Wireless Communication ... 23 1.5.8.1 Wi-Fi ... 23 1.5.8.2 Cellular Network ... 23 Dissertation structure ... 25 2 ... 26 Hardware Overview ... 27
Adafruit ADS1015 Analog do Digital Converter ... 28
Analog Sensors ... 29
2.3.1 HIH 4000 ... 29
2.3.2 LM35 ... 29
Ultimate GPS Breakout v3 ... 30
USB Audio Card & Sea-Phone Hydrophone ... 30
Raspberry Pi ... 31
Conditioning circuits ... 32
Network communication ... 33
2.8.1 ZTE MF910 LTE Mobile Router ... 33
3 SOFTWARE ... 34
Software Overview ... 35
Embedded Platform Software ... 35
3.2.1 Python ... 36
3.2.2 MySQL ... 36
3.2.3 FFmpeg ... 36
3.2.4 DDclient ... 36
3.2.5 Python Scripts ... 36
3.2.6 Python Scripts Code Highlights ... 39
3.2.7 MySQL Database ... 41
3.2.8 GPS Software ... 42
3.2.9 Audio Stream ... 43
3.3.2 Wowza ... 46
3.3.3 PHP Scripts... 47
3.3.4 PHP Scripts Code Highlights ... 49
3.3.5 JSON Format ... 51
3.3.6 Wowza Streaming Service ... 51
Android Application ... 52
3.4.1 Main screen ... 52
3.4.2 Sensors’ graphical data ... 54
3.4.3 Audio FFT activity ... 56
3.4.4 Audio Waveform (time domain) sound activity ... 58
3.4.5 Mobile Application Code Highlights ... 59
4 RESULTS ... 64
Field Tests ... 65
5 CONCLUSIONS AND FUTURE WORK ... 75
Conclusion ... 76
Future Work ... 76
REFERENCES ... A ANNEX ... E
1
Overview
With today’s advancements in technology, it became possible to address a larger number of problems regarding accessibility and also monitoring and interacting more thoroughly with systems. This work presents the design and implementation of a system that can be used for water quality monitoring, the system being designed especially for monitoring tasks on rivers and estuaries to help maintain sustainability. The possibilities are numerous of what can be done with a USV, it can help doing maritime tasks using multi-drone swarms [1], it can address more concerning events such as cleaning oil spill [2], or for general environmental condition monitoring.
The Internet of Things help to solve a lot of problems in different fields: in smart cities, IoT applications are related with parking issues, noise, traffic, illumination monitoring [3]; emergency systems for earthquakes [4]; precision agriculture applications in culture process optimization [5]. IoT are used to deliver information from the sensors and to the actuators. The goal of this thesis is to present an aquatic drone setup equipped with a Raspberry Pi that is connected to an array of sensors for air and the water quality monitoring. For air quality measurements, temperature, humidity and gas sensors were considered. For water quality monitoring, hydrophone sensing unite were implemented in order to measure underwater noise pollution related with human activities in rivers, estuaries and seas. The system is prepared to include additional sensors for water quality monitoring such as turbidity, DO, conductivity and pH however in this first phase considering the budget limitation and the current needs only the above-mentioned measurement channels were implemented.
Several tasks were carried out during the system implementation. Thus, the sensors interfacing with Raspberry Pi platform was considered and different signal conditioning modules were implemented. Referring to the system software, Python scripts were developed in order to read the values from the sensors and to write them to a local database. A server setup was carried out to receive the data from the local database implemented on Raspberry Pi level using
Motivation
The ‘Internet of Things’ is not an unknown term nowadays as it continues to grow in popularity. A lot of companies are working on new devices and new solutions to deal with the growth of the connected devices as this industry continues to develop. It carries the tools that can transform every industry such as: agriculture, transportation, manufacturing, housing and even entire cities. Companies continue to work on making new devices to address in the digitalization of these industries but also improving communication protocols with security being a top priority. It is estimated that around 2015 10 billion devices were connected and by 2020 will be connected 20 to 30 billion devices, the main reason being the costs continue to drop and demand continues to grow [6].
The need for a good ecosystem and its preservation is important to maintain a sustainable environment and it requires continues searches for new ideas to promote a clean planet. The oceans are the home of thousands of different species that are important for the ecosystem, the ocean also provides more than half of the oxygen in the atmosphere and also absorbs the most carbon from it. Excess human activity such as the degradation of marine habitats and species, overharvest of resources present a danger to the marine life and a good way to fight this problem is by protecting areas with monitoring and conservation [7].
On the other hand, the rivers provide a rich source of fresh water and nutrients required by animals and also by humans. In many areas rivers are used to water crops, fishing and also transportation. It is also the main source of water of wild animals that ensure their survival with a sustained supply of fresh water and food. More than the oceans, the rivers should be preserved to maintain and guarantee a good ecosystem [8].
Another problem that should not be ignored and must be monitored as well is the underwater noise. With the vast amount of human activity in the sea with submarines, ships equipped with sonar devices, even natural causes such as earthquakes can disrupt fish migrations, communication and even their food hunting [9]. With this system it is hoped to provide monitoring of air and water quality factors in order to help fight these problems.
Context
Unmanned Systems (US) are devices or any sort of machines that do not require human intervention to perform actions. It consists of sensors, processors, controls and communication
US to do as well as receive data from the US and make decisions upon that [10]. These US can also be categorized as Unmanned Vehicles (UV) and are divided through different types:
Unmanned Ground Vehicle (UGV) Unmanned Aerial Vehicle (UAV) Unmanned Surface Vehicle (USV) Unmanned Undersea Vehicle (UUV) [11]
In this project, a USV will be used. A USV is a boat type vehicle that operates on the surface of the water, in order words, an aquatic drone. Nowadays the USVs are mostly used for military service such as training purposes, transporting supplies, equipped with weapons for action, for scouting activity, etc. USVs are also used for research purposes for environmental control and this project will assist in this direction.
Since various types of smart sensors will be connected to it, there will be a whole new dimension of actions that the USV will manage to do. It is possible for the USV to make decisions of its own regarding the programming behind it. For example, if a swarm of USVs is scouting an area and they are equipped with hydrophones they can move towards where the sound is originating from (for a set of specific frequencies), being useful to chase a shoal of fish or any other thing. Or, another example, if one boat in the swarm detects weird sounds (i.e. a frequency different than normal) coming from another boat it can let the user know and perform maintenance upon the receiving of that information. There are innumerous actions that can be made using smart sensors and can be explored to the max.
The BioMachines Lab in Institute of Telecommunications in ISCTE-IUL, Lisbon is developing a swarm of aquatic drones designed to perform maritime tasks in the sea with an ad-hoc network architecture via Wi-Fi. Each drone is equipped with a compass, GPS and a Raspberry Pi 2 unit with a Wi-Fi interface and they form a distributed network (controlled by an artificial neural network based controller) without a central coordination, they keep broadcasting their position to the drones in their neighborhood every second. The neural network performs actions depending on what it receives, the sensor readings feed the neural network and then it will
Raspberry is part of an IoT module that will send the data to a cloud server, the cloud server then sends the data to a web server with a user interface [13].
Another interesting research using buoys composed by android phones as an electronic device for sensing and sending information, using the phones’ GPS to report the position and also meteorological data such as wind speed and direction. The buoys track oil spilt areas without human intervention [14].
Another project done in the United States, the Water on the Web (WOW) gathers information from lakes and rivers across the different states of the country, it uses a RUSS (Remote Underwater Sampling Station) which is a floating platform equipped with conductivity, dissolved oxygen, pH, temperature and turbidity sensors and it uses cellular networks to transmit the data to the website [15][16].
This thesis has similarities with the above-mentioned projects, an aquatic drone will be used but instead of using Wi-Fi connection, a cellular solution will be adopted to eliminate the distances problem, and with today’s strong infrastructures of 3G and 4G the latency will not be considered as an issue. A Raspberry will be used with similar sensors as described in the second project to monitor the water quality but also to perform statistics with the data and it will feature a local database that will keep feeding a remote server with data to be then consulted by a GUI application developed for mobile. Like the WOW project, this thesis will focus on lakes and rivers but also estuaries.
Objectives
The main goal is to build a water and air quality-monitoring module for aquatic drones using Raspberry Pi platform connected to a wide array of sensors for data gathering to monitor the area. Sensors for temperature readings, humidity, pH, salinity and conductivity levels, also underwater noise. Mostly air and water quality sensors. The connection is done by Wi-Fi or 3G/4G but mostly 3G/4G since large distances are dealt with. The thesis contents is expressed by following parts:
Air and water quality sensors connected to the Raspberry computation platform that have python scripts to control the acquisition, to process the data and to upload the data to a local database on the SDcard.
3G/4G communication between the Raspberry and the cloud server and vice-versa. Mobile front end application in Android that fetches the sensors’ data from the server.
It obtains sensors’ values and the states. Can also provide statistics.
Literature Review
1.5.1 Computational Platforms
In this section is discussed the several embedded systems considered for the core component of the project.
1.5.1.1
BeagleBone
Beaglebone is an embedded open source computer developed by Texas Instruments. The board is meant for educational purposes and people in general that which to experiment and create something using this small affordable computer. It can run several distributions of Linux OS and Android. There are several versions of BeagleBone boards but only two were considered: BeagleBone Black and the original BeagleBone. The hardware of both boards is described in the following table:
BeableBone Black BeableBone (original)
Processor AM3358 ARM Cortex-A8
1GHz
AM3358 ARM Cortex-A8 720MHz
Analog Pins 7 7
Digital Pins 65 (3.3V) 65 (3.3V)
Memory 512MB DDR3 256MB DDR2
Connectivity miniUSB 2.0 client port, USB 2.0 host port, Ethernet, HDMI
miniUSB 2.0 client port, USB 2.0 host port, Ethernet
4 Timers, FTDI USB to Serial, JTAG via USB
MSRP $49 $89
Table 1 - BeagleBone original and BeagleBone Black specifications [17]
Figure 1 - BeagleBone Black
Out of the two boards, the choice would go to the BeagleBone Black as it has more memory and a slightly faster processor, the HDMI interface is not important for the project and it has less interfaces than the original but those are also not important. The most important interfaces for the project are the UART and I2C and the Black model already include those and is cheaper. A big downside is the lack of Wi-Fi support which is crucial for the communication.
1.5.1.2
Arduino
Arduino is an open-source hardware platform that is able to read inputs (sensors or other type of hardware connected to it) and trigger an action/output on hardware or software level. It can be programmed by writing a set of instructions using the Arduino programming language and the Arduino IDE to write and upload the code, available for Windows/Mac/Linux. There are several boars available but only two were considered, the Uno and Mega:
Arduino Uno Arduino Mega
Processor ATmega328P
16MHz
ATmega2560 16MHz
Operating/Input Voltage 5 V / 7-12 V 5 V / 5-12 V Analog In/Out 6/0 16/0 Digital IO/PWM 14/6 54/15 EEPROM [kB] 1 4 SRAM [kB] 2 8 Flash [kB] 32 256
USB / UART Regular / 1 Regular / 4
MSRP €20 €35
Table 2 - Arduino Uno and Mega specifications [18]
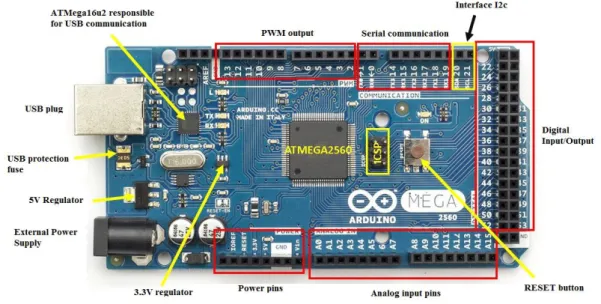
Figure 3 - Arduino Mega
The use of Arduino in this project is not viable due to several limitations. To ensure that the system would work, it would necessary to install external shields for the Wi-Fi and GPS but at the end would not look friendly and come out as even more expensive. The streaming would be possible but the performance would drop with so many things working at once and for the similar price, there are better alternatives for this project’s environment.
1.5.1.3
Raspberry Pi 3
The Raspberry Pi is a very small and compact computer manufactured for educational purposes. It is basically a computer with a size of a credit card, it possesses an ARM CPU, graphics capabilities, USB ports, Ethernet port, HDMI port, programmable ports (GPIO) and a combined audio and composite video jack. Its characteristics make it ideal to use in the environment of this project, it is possible to connect all the sensors needed and to communicate with a server to keep uploading data. It also does not require much power (5V, ~1A), allowing it to be attached to a rather small battery for mobile purposes. There are several models of Raspberry Pi, the latest being the Raspberry Pi 3 that was considered for the project [19][20].
Figure 4 – Raspberry Pi 3
Raspberry Pi 3
Processor BCM2837 1.2GHz 64-bit
Quad-Core ARMv8
Memory 1GB SDRAM
Connectivity 4x USB 2.0 host port, Ethernet, HDMI, Wi-Fi 802.11n,
Bluetooth 4.1
Video Full HDMI port
Audio HDMI, 3.5mm audio jack
Supported Interfaces 40 GPIO pins with I2C, SPI, 1-Wire, UART, Digital
input/output, JTAG, PCM, DPI, GPCLK (General purpose
and with the best price considering all the hardware it has. The only downside is the lack of audio input interface but it does not present much of a problem as the Raspberry has a lot of support for external components and getting an analog interface is not hard.
1.5.2 Audio
In order to capture audio from the microphone, an external audio card is necessary to provide audio input. In this section, the audio cards are analyzed.
1.5.2.1
Cirrus Logic Audio Card
Although the Raspberry Pi is equipped with audio capabilities, it does not allow for a crucial factor needed for this project, which is audio input. This module designed specifically for the Raspberry not only has much better audio performances (in both analog and digital forms) but also allows for audio input which will be needed to process audio. Although this card has really high quality, its installation is not ideal as it will occupy all of the GPIO ports of the Raspberry, like in the following image:
Figure 5 - Cirrus Logic card installation
As it is clear in the image, this card will not let anything else connect to the GPIO ports of the Raspberry, which would make the project undoable.
Figure 6 - Cirrus Logic Audio Card and the possible connections [21]
1.5.2.2
USB Audio solution
At first a more complete solution was thought to assure audio input capabilities and a more reliable sound quality such as the Cirrus Logic Audio card, but it came to a conclusion that its implementation style (shield onto the GPIO ports) on the Raspberry Pi would raise some difficulties on connecting the rest of the components so it was decided to migrate to a simpler solution and an audio USB card was chosen. Since Raspberry is running a Linux kernel, it is important to look for a card that has a driver-free chip, in other order just plug and play. There are just a few cards like these in the market so the choice is not difficult. There is no point in comparing these sorts of cards because they all feature similar chips and look practically the same (some with bigger size than others).
1.5.2.3
Plantronics USB Audio Adapter
Figure 7 - Plantronics USB Audio Adapter
1.5.2.4
SS03-10 Sea-Phone Hydrophone
A hydrophone is basically an underwater microphone; it will be used to listen to all types of underwater noises such as animals and derivatives from human activity with a frequency range from 0.020 to 50 kHz. This model is powered by a 9V battery that can last up to 18 hours and gathers the audio through a 3.5mm stereo jack connector that will be used to connect to the audio card in the Raspberry. It also allows to adjust the gain from 0 to 30dB.
Figure 8 – Sea-Phone Hydrophone [22]
1.5.2.5
SQ26-H1B Hydrophone
This hydrophone is a more recent model and also suited for general purpose audio-band signal detection. It is a little bit smaller than the SS03-10 and has a slightly smaller frequency range, going from 0.020 to 45kHz and can be paired with a Bluetooth speaker system. The battery is longer, going up to 34 hours of life but the gain and the jack connector are the same as the SS03-10.
Figure 9 - SQ26-H1B Hydrophone [23]
Although the SQ26-H1B is more recent and has some extra features and improvements, it is a little bit more expensive than the SS03-10 and those extra features do not bring anything useful considering the context of this project. The extra battery time could be useful but the tests never last 18 hours straight so the extra time is not needed. The older hydrophone was used instead and serves the purpose just as good.
1.5.3 Temperature Sensors
For temperature sensing, analog and digital models were considered and the next few paragraphs talk about them.
1.5.3.1
Waterproof Digital Thermometer DS18B20
This temperature sensor provides temperature readings from -55ºC to 125ºC with a +/-0.5C accuracy from -10ºC to +85ºC. It uses the 1-Wire protocol for data communication which means that uses only 1 wire to exchange data with the Raspberry Pi and in addition, it can also draw power from that same line due to its feature called “parasite power” eliminating the need for an external power supply, making it really simple to setup. Each DS18B20 sensor also has a unique 64-bit code which allows to setup multiple installations to work on the same 1-Wire bus. The sensor also includes an integrated EEPROM that reduces external component count.
Figure 10 – Digital Thermometer DS18B20 [24]
1.5.3.2
LM35 Temperature Sensor
The LM35 is a compact temperature sensor that can be powered by 5V supplied by the Raspberry but it can operate from 4V to 30V, it provides an accuracy of 0.5ºC and I can go from -55ºC to 150ºC. The sensor is already calibrated directly in Celsius and it provides an output voltage linearly proportional to the centigrade temperature [25].
Figure 11 - LM35
Comparing the two temperature sensors, the LM35 came as the preferable choice. Its analog interface makes it easier to deal with as it does not need any drivers and it is cheaper.
1.5.3.3
HIH 4000 Humidity Sensor
This humidity sensor will provide the percentage value of the relative humidity present in the air with the necessary conditioning, it provides the values in voltage has an enhanced accuracy, fast response times and it requires low power [26], ideal for our work environment.
Figure 12 - HIH4000
1.5.4 Gas sensors
In the gas sensing electronics, the search must be done by the target gas(es) and since for this project outside air is the target environment, the results will be better if a sensor designed for air quality control is selected. Inside air contaminants, there are not many options to go for, two were considered, the TGS2600 and TGS800 both from Figaro.
1.5.4.1
TGS2600
The TGS2600 is the latest model from Figaro for air quality control, it is comprised of a metal oxide semiconductor layer formed on an alumina substrate with an integrated heater (which is common in gas sensing electronics). The sensor reacts to the gas by increasing its conductivity depending on the gas detected. It features low power consumption, high sensitivity to air gas contaminants, small size and has a simple electrical circuit. Its structure is showed in the following figure:
Figure 13 - Structure of the TGS2600
Figure 14 - TGS2600 gas sensor [27]
1.5.4.2
TGS800 Gas Sensor
The TGS800 serves the same purpose as the TGS2600 and has a similar construction but it is an older version and, for that reason, it is cheaper. The sensor has a heater in an alumina ceramic tube and the semiconductor material is mounted on the tube, like in the following picture:
Figure 15 – Sensing element of the TGS800 [28]
The sensor is then housed by a resin base and cover painted in red, like in the figure 15:
Figure 16 - TGS800 gas sensor The overall inner structure of the sensor looks like this:
Figure 17 - Inside structure (cut view) of TGS800 [29]
The choice would go to the TGS800 due to solely being cheaper, as having the latest model TGS2600 does not present that much of an improvement to justify spending extra.
1.5.5.1
Adafruit ADS1015 12-Bit Analog to Digital Converter (ADC)
This Adafruit model has an I2C communication interface that can be connected directly to the Raspberry through the GPIO ports with proper conFiguretion and it is easy to use. This ADC is powered by 5V and has 4 analog input ports (A0-A4) on which the analog sensors will be connected. It also features a PGA (Programmable Gain Amplifier) which allows to tune for more precision for sensors that have lower voltage readings. This model has a really good support for the Raspberry Pi, Adafruit has developed a library in python to aid in the development. With this hardware it is be possible to work with the analog sensors that are needed for the project. [30].
Figure 18 - Adafruit ADS1015 12bit ADC
1.5.5.2
Microchip MCP3004
The MCP3008 is an ADC featuring the SPI interface with a 10-bit resolution, it also has 4 analog input ports and is powered by 5V. It does not have an amplifier and has a low power CMOS technology. This ADC has no specific support for the Raspberry, but it works as it has an SPI interface. The structure of this ADC is the following:
Figure 20 - MCP3004
Between these two ADC’s, the ADS1015 from Adafruit was the preferable choice as it offers a more specific support for the Raspberry Pi with a custom-made library developed by Adafruit. The MCP3004 being SPI, it could present a solution with better performance but the implementation of the SPI without specific support for the Raspberry would bear a considerate amount of work. The speed, being the main difference between both interfaces [50], it would not be a problem in this project, as the I2C interface suffices for the scenario and has a simpler implementation.
1.5.6 GPS
GPS is a type of Global Navigations Satellite System (GNSS) to determine somethings position on earth in coordinates, it uses trilateration to calculate the exact position. The GPS receiver must receive signal from at least 3 satellites to determine the 2D (latitude and longitude) position plus track movement and 4 or more satellites to determine the 3D position (latitude, longitude and altitude). Other information can be provided such as speed, bearing, track, trip distance, distance to destination, sunrise and sunset time and more. A unit is connected to the Raspberry Pi in order to know the position of the USV at all time, can also be used to interact with the smart sensors to execute actions in certain locations [32].
1.5.7.1
Android
Android is a Unix based operating system currently developed by Google to compete against iOS, Symbian and Windows Phone but with the difference that it is open source which is a must for programming enthusiasts to be able to develop the best performance-wise applications. It uses Linux kernel and is designed for smartphones, tablets and more recently wearables, TV and automobiles. This OS has been increasing in popularity in the past years becoming a market leader leaving iOS in second place. Android is an excellent option to develop a GUI front end application for data reading and statistics processing, it also has direct connections with other Google products such as Google maps which enrich development with the assist of these tools [33].
To develop in Android (which is Java + XML), Android Studio is the main IDE to develop Android applications, it is also developed by Google to succeed the Eclipse ADT Plugin that was the previous officially supported method to develop android applications. Android Studio features a handful of new capabilities such as the Gradle-based build system that improves dramatically the ease of importing APIs and other libraries to merge into the application being developed. It also features Android Virtual Device (AVD) that allows to test apps in different sorts of virtual smartphone models in case a physical device cannot be used. Still the best method would indeed to use a physical device, it provides the most realistic scenario for application testing [34].
1.5.7.2
iOS
iOS is a proprietary operating system developed by Apple Inc. and is also Unix based like Android and is exclusively targeted for Apple products. It is the second most popular mobile OS in the market at this point and the latest version is the iOS 10, major versions are released annually [35].
The development of applications for iOS is done with the Xcode IDE from Apple itself and is the official platform to develop for Apple products. It has the downside that it is only available for Macintosh computers (that feature Apple’s Mac OS), so it is necessary to have an Apple computer to be able to develop applications to these platforms [36]. Within the Xcode programming, there are two possible choices for the programming languages: Objective-C and Swift. Objective-C was the main language to develop applications for Apple products but recently Apple created their own programming language Swift which became the primary
in that language but it is recommended to start using Swift as it has a lot of improvements towards Objective-C [37][38].
1.5.7.3
Windows Phone
Windows Phone is developed my Microsoft and is a mobile operating system, the latest being Windows 10 Mobile. It is also closed source like iOS but is not locked for Microsoft products only. This OS is primarily aimed to the consumer market to try and compete with Android and iOS [39].
The development of applications for Windows Mobile is done via the Visual Studio IDE from Microsoft and uses a mixture of programming languages. For the User Interface, XAML is used, C# or Visual Basic for the code and optionally C++ to take full advantage of the phone’s graphics hardware.
To make a general comparison of the three considered mobile operating systems, a table was constructed:
Android iOS Windows Phone
Company Google Apple, Inc Microsoft
Market Share (2015Q2) [40]
82.8% 13.9% 2.6%
License Free and open
source
Proprietary Proprietary
OS family Linux Darwin Windows Phone
Package Manager APK iTunes XAP, APPX
SDK platform(s) Linux, Mac OS X, Windows
Mac OS X, macOS Windows
1.5.8 Wireless Communication
For the wireless communications, there are not many technologies to choose from, but they present big differences from each other and the important factor will be the distances and high bandwidth capabilities.
1.5.8.1
Wi-Fi
Wi-Fi is a wireless technology that allows for computers/devices to connect to a Wireless Local Area Network (WLAN) using mostly 2.4Ghz or 5Ghz radio bands. The IEEE (Institute of Electrical and Electronics Engineers) LAN/MAN Standards Committee has standardized the technology as 802.11 and is responsible for its maintenance. Since its creation in 1997, the protocol has been having constant improvements that are categorized in letters [42], the main ones being 802.11a, 802.11b, 802.11g, 802.11n, 802.11ac and a lot more. Today’s mostly used standards are 802.11n and ac with still older ones like 802.11g still widely used. Making a comparison of these two, we would have:
IEEE 802.11n IEEE 802.11ac Approx. Range outdoor
(m)
250 No clear value
(Beamforming technology)
Band (GHz) 2.4/5 5
Bandwidth (MHz) 20/40 20/40/80/160
Data rate (Mbps) Up to 450 Around 1331
MIMO Streams 4 8
Table 5 - Wi-Fi popular standards comparison
The actual speed of the transfers is hard to measure as it depends of the environment, interferences and router settings. In the case of the 802.11ac standard it works differently, the Beamforming technology works by detecting where the target device is in space and intensifies the signal in its direction, which works much better than the traditional Omni-directional signal propagation of the 802.11n [43][44].
1.5.8.2
Cellular Network
Cellular network is a form of communication using cell towers that are distributed in different areas, known as base stations. The most used standards (technologies) for cellular
speeds up to 384Kbps, HSPA can provide up to 42Mbps of Downlink and 28Mbps of Uplink (HSPA+), LTE can provide up to 300Mbps of Downlink and 75Mbps of Uplink and LTE-Advanced can go up to 3Gbps of Downlink and 1.5Gbps of Uplink, the latency is highest in UMTS and lowest in LTE-A. The best scenario would be to have always service coverage from HSPA or even LTE or LTE-A which offer the highest speeds and the lowest latencies [45][46][47][48], but since bandwidth is not much of a problem for the type of data being dealt with (of what any of these standards can provide), the only concern will be the latency. As long as at least a good UMTS coverage is provided the system should theoretically work fine.
Figure 21 - Cellular standards comparison
In Portugal, ANACOM conducted a study from September 2014 to December 2014, an evaluation of the cellular performances throughout the country (UMTS, HSPA and LTE combined). The worst scenarios tested were throughout the highways of the country and the mean latency values the tests showed, considering all of the ISPs, was 42ms, which is still a great value to work with. Also, globally, the coverage values for LTE were all above 88% and above 95% for the rest of the older standards [49].
Dissertation structure
The dissertation is composed by five sections:
Section 1 (Introduction) – Where an overview of the system and early studies are described.
Section 2 (Sensors and computational platform) – Where all the sensors and embedded computers are described and also the implementation of the hardware part.
Section 3 (Software) – Where all the developed server sided scripts, embedded platform scripts, streaming and additional software is described and explained.
Section 4 (Results and evaluation) – Where the tests results are represented.
Section 5 (Conclusions and future work) – Where final thoughts of the development of the system are described and also possible improvements for future iterations.
2
SENSORS AND
COMPUTATIONAL
PLATFORM
Hardware Overview
The architecture of the system includes sensor measurement channels connected to the Raspberry Pi, that allows signal acquisition, signal processing using Python scripts implemented on the level of computation platform expressed by Raspberry.
The system architecture is represented in figure 22:
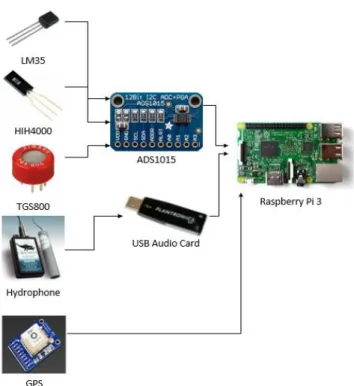
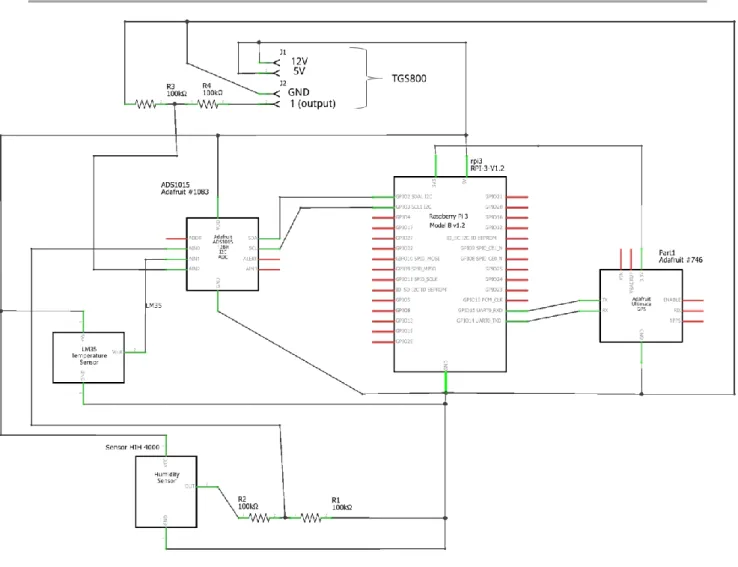
Figure 22 - Hardware system architecture overview The schematic of the implemented architecture is presented in Figure 21:
The analog sensors are connected to the Raspberry Pi via an ADC board based on ADS1015. The hydrophone channel requires special analog to digital conversion and interfacing capabilities thus an USB Audio Card was employed and connected to a Raspberry USB port. The GPS is connected to the Raspberry via the UART TX (transmit) and RX (receive) ports in the GPIO.
Adafruit ADS1015 Analog do Digital Converter
The ADC will play as a middleman for the data acquisition from the sensors and inputting them to the Raspberry. All of the analog sensors are connected to the analog ports (A0 – A4) of the
𝑽𝒐𝒍𝒕𝒔 =4.096 ∙ 𝐴0−4 2047
Where 4.096 is the maximum voltage for PGA = 1, 2047 is the maximum value the ADC outputs at 4.096V, and A0-4 are the analog input ports that will receive the data from the sensors.
Analog Sensors
2.3.1 HIH 4000
The humidity sensor has got three wires for output and power (Vin, output and ground). It is powered by the Raspberry with 5V and the output is connected to an analog port in the ADC module.
Figure 24 - HIH 4000 connections
The implemented relation to extract the relative humidity (%) values out of the voltage is:
RH(%) =
Vout
Vsupply − 0.16 0.0062
2.3.2 LM35
The temperature sensor has a similar setup as the humidity sensor, it also presents with three connections: Vs, GND and Vout. It is also powered with 5V from the Raspberry and the output is connected directly to the ADC module without additional conditioning required.
(1)
Figure 25 - LM35 connections
Ultimate GPS Breakout v3
This GPS model is made by Adafruit and it requires a 3.3V power input, which the Raspberry can provide but it can also be powered with 5V as it has a dropout regulator. It features an external antenna for better signal coverage, a -165dBm high sensitivity receiver and can tack up to 22 satellites on 66 channels and only draws 20mA of current. It also has an LED to show the GPS status on satellite connections, it blinks every second while it is searching for satellites and blinks once every 15 seconds when it has abled to make a connection.
Figure 26 - Adafruit's Ultimate GPS Breakout v3
To connect this GPS model to the Raspberry Pi, the UART interface is used. The RX and TX connections of the GPS are cross-connected with the ones from the Raspberry Pi, then we connect the 3.3V pin to the 3.3V from the Raspberry and also the GND.
The Hydrophone requires a AAA battery of 9V to power the device, other than that is just connecting the main microphone to the capture device and then connecting to the USB audio card in the input port with a 3.5mm jack cable.
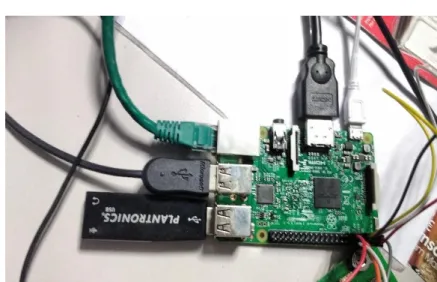
Figure 27 - Hydrophone connected to the USB audio card
Raspberry Pi
The Raspberry Pi is the core of the system; all the sensors are connected to it and it handles all the analog processing. It is powered by Raspbian, the official Linux distribution for the Raspberry, it offers official support for specific Raspberry functionalities and not disregarding the advantages of having a Linux kernel. It receives data from all the analog sensors, the GPS and the hydrophone and saves the data in a local database and replicates to a remote server and also streams the audio received by the hydrophone. It will host all the python scripting and terminal commands needed to keep uploading/streaming data to the remote server. The Raspberry will only have the signaling script running at runtime, from there everything can be controlled by the android application.
Figure 28 - Raspberry Pi 3 with the components connected
Conditioning circuits
For the gas and humidity sensors it was verified that, due to the high voltage output values, the ADC module could not handle such values and it saturated rather quickly, as the value could go above 5V. To solve this problem, it was applied a voltage divider in order to attenuate the values the sensor outputted.
Figure 29 - Voltage Divider
The figure 10 shows how the voltage divider was implemented. Vin is the voltage value outputted from the HIH 4000 and the gas sensor, R1 and R2 in this particular case are the same which means cutting the voltage value in half, so if the the sensor outputs 1.2V, the voltage
Network communication
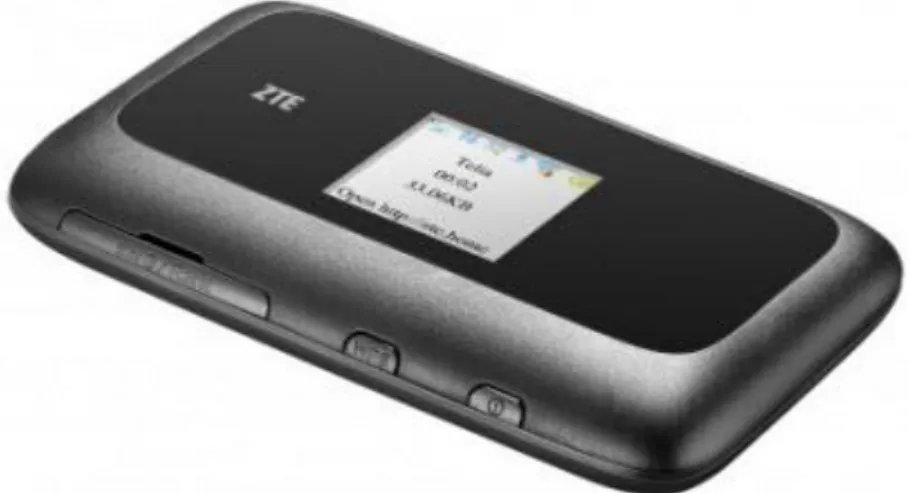
The communication is done via 3G/4G from the Raspberry pi to the cloud server and vice versa to provide access to the data, the idea was to use a mobile router that stays in the USV with the Raspberry Pi to provide cellular internet access.
2.8.1 ZTE MF910 LTE Mobile Router
This mobile router will provide internet connection to the Raspberry Pi via Wi-Fi. This router receives connection through cellular networks, from UMTS to LTE, depending on what is available in the area of deployment and provides the internet connection via Wi-Fi to the connected interfaces. This router has a built-in battery but can also be connected to an external source for extra power.
3
SOFTWARE
Software Overview
This chapter presents the system software describing every backend and frontend functionality within the Raspberry Pi, databases, remote server and the mobile application.
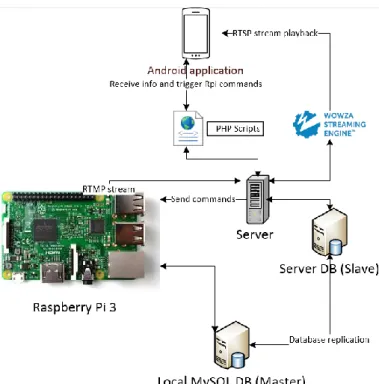
The software system architecture is represented in the following figure:
Figure 31 - Software system architecture
As it is presented in the figure 31, on the Raspberry level, it has a local database implemented that is fetching the data from the sensors, the values and the respective timestamps. The local database is then configured to be replicated by the remote server’s own database, of which acts like a slave and copies the data from the master 1:1, every change done in the master is replicated by the slave. For the server side a set of PHP scripts were developed, the scrips being accessed by the mobile application that retrieve the sensors’ data. As for the streaming, the Raspberry will stream the audio in RTMP to the server, and then the Android device will receive the streaming as RTSP.
Embedded Platform Software
The Raspberry Pi has a few scripts running and software to allow the system to work flawlessly. The used software platforms were Python, MySQL, FFmpeg and DDclient.
3.2.1 Python
Python is a widely used high-level programming language for general purpose, this language was selected due to having the most support on the Raspberry platform, including external devices, making it the right choice for this thesis. This programming platform is also easy to learn and emphasizes on code readability which makes it visually appealing and it can do a lot with few lines of code.
3.2.2 MySQL
MySQL is an open source software to manage relational databases. It is widely used in web applications and has a pretty solid replication capability which is very important for this project. MySQL is also going to be used in the server as the data is replicated.
3.2.3 FFmpeg
FFmpeg is a multimedia framework that is incredibly complete, it allows to decode, encode, transcode, mux, demux, stream, filter and play most of the codecs out there, community and corporation made. It is divided in 4 different tools: ffmpeg which converts multimedia files, ffserver which is a multimedia streaming server, ffplay which is a media player and ffprobe, a multimedia stream analyzer. For the thesis only the ffmpeg was used, in order to handle the audio streaming.
3.2.4 DDclient
DDclient is a software developed with Perl used to update DNS entries for accounts on DDNS (Dynamic Domain Name System) services. The usage of a DDNS is necessary to overcome the problem of the dynamic IP address by the ISP of the 3G/LTE connection. By registering a domain name and associating it to the DDclient, the software will keep updating the domain name with the latest active dynamic IP given by the ISP. With this solution, there is no longer need to worry about IP changes as the connection is made using a DNS address instead.
3.2.5 Python Scripts
Two python scripts were developed. One of them is designed to handle the data acquisition thus allowing the Raspberry to obtain the data from the sensors. The Adafruit’s ADC library was
a SIGINT signal sent from the keyboard combination CTRL+C or with a killall/kill command which terminates all the threads and exits.
Start script
Start thread for each sensor
Keep inserting the latest data of each sensor to DB SIGINT received? No Yes Script terminated Connect to local DB
Figure 32 - Data acquisition script flow chart
The second script is designed to handle the signalling received from the server “signals” database that is triggered by the mobile phone. The script is running a thread that is scanning the database every second for changes in the values, the database is updated through a PHP script that the android application calls and triggers the database change. Whenever there are changes triggered by the android application, the script will proceed to execute the requested actions. There are five possible actions that can be executed:
1. Start or stop the data acquisition script 2. Start or stop the stream
3. Shutdown the Raspberry
This way the application has a more dynamic way of controlling the whole system without the constant need to log into the Raspberry, everything can now be made at a click of a button.
Start script
Scan server DB for changes in adc, stream or shutdown tables sig_shutdown = 1? sig_adc = 1? sig_stream = 1? Yes Start data acquisition script
Set sig_adc back to 0 and go back to scanning No sig_adc = 2? Yes Send SIGTERM signal to data acquisition script to terminate and go back to scanning
Yes Start ffmpeg sig_stream = 2? Set sig_stream
back to 0 and go back scanning Yes Set sig_shutdown back to 0 Yes Send SIGINT signal to ffmpeg to terminate and go back to scanning Set sig_stream back to 0 and go back to scanning Terminate all scripts Execute shutdown command to power off Raspberry Pi Connect to server DB
Figure 34 - Raspberry signalling scheme
3.2.6 Python Scripts Code Highlights
For the data acquisition script, a function was made to convert the ADC values into volts and another function to apply the correct formula based on which sensor is connected in which port (A0-A4):
Figure 35 - Data acquisition python functions
For the data insertion, a thread for each sensor is constructed with different time intervals of data insertion:
Figure 36 - Code snippet of the sensors' thread
For the signals’ script that triggers linux signals based on the information detected on the database triggered by the mobile application, a threading principle was also used to keep reading for database changes every second:
Figure 37 - Code snippet of the signals' script
The script in figure 37, keeps accessing the database every second and sees if the values saved are 1 or 2. If the value is 1 it starts the data acquisition script and if the value is two, sends a SIGTERM to terminate the script. Whenever these actions are done, the value is always reverted back to 0.
3.2.7 MySQL Database
The MySQL database has a straightforward design, the first database has a table for each sensor and their fields are: id, value and timestamp. This allows the storing of every sensor reading and the respective time of when it was measured.
The second database is called signals and has the tables sig_adc, sig_stream and sig_shutdown. Each of these tables have a field called sig_state which can have the values 0, 1 or 2, apart from the sig_shutdown table which only goes until 1. The default value is 0, which is the state of not doing anything. For the remaining values, the logic is the following for each of the tables:
sig_adc: if the value is set to 1, it means the mobile application wishes to start the data acquisition script, and if it is set to 2 it wishes to stop the script instead (if it is already running).
sig_stream: if the value is set to 1, the Raspberry will start the ffmpeg streaming command and the streaming process will start. If it is set to 2, a SIGINT signal is sent to the ffmpeg process in order for it to terminate safely, which ends the stream.
sig_shutdown: if the value is set to 1, Rasbperry receives a shutdown order.
The values are reverted back to 0 whenever an action is requested and triggered. The overview of all the databases look like this:
Figure 38 - Databases' structure
3.2.8 GPS Software
In order for the GPS model from Adafruit to work, the Raspberry Pi must have a program that handles the messages from the GPS and translate them into human readable, and that software is GPSd.
GPSd is a service daemon that monitors GPS’s receivers that are connected to a computer through USB, serial, etc. and sends the data to the TCP port 2947 of the host computer. This way it is possible to access the localhost and the TCP port 2947 and the GPS data is accessible
With all these tools, it is not necessary to deal with the raw NMEA messages and all the errors the might surface, as there is already software that deals with that. A typical NMEA message looks like this:
Figure 39 - Example of an NMEA message
This is the raw data the most GPS devices emit that need to be parsed in order to present readable data. With the use of GPSd, the data is already parsed and looks like this:
Figure 40 - cgps output (GPSd)
With the help of python, it is possible to access this data directly for the data acquisition script.
3.2.9 Audio Stream
After connecting the hydrophone and the USB Audio card to the Raspberry it is necessary to activate the microphone and tweak the volume using the ALSA software. ALSA allows to configure the multimedia hardware connected to the Raspberry, in this case we want to configure the USB Audio card, which is mostly just activate the audio input functionality and
To be able to stream the audio from the hydrophone, the ffmpeg command will receive the data from the USB audio card through ALSA and encapsulate the audio in an RTMP stream that is sent to the server. As the ffmpeg is in fact a powerful command and allows for a lot of variety of different approaches to construct a good command for the needs of the user, it was necessary to test different approaches and protocols in order to obtain a satisfying stream. The output of the stream is represented in the following picture:
Figure 41 - FFmpeg output
3.2.9.1
Fast Fourier Transform (FFT)
It is important to understand how strong or weak are the sound emitting sources and to know that, it is necessary to have a spectrum of frequencies to analyse. These frequencies will also help in the identification of the audio source and to obtain the frequencies, an implementation of the FFT algorithm was included. The FFT algorithm will compute the Discrete Fourier Transform (DFT) which will convert the signal, that is in the time domain, into a representation in the frequency domain.
Where 𝑓𝑠 is the sampling frequency (configured in ffmpeg, 8kHz used) and 𝑓∆ is the frequency resolution, but since the length of the audio file is used, it needs to be converted in time, becoming 𝑇∆.
The FFT algorithm only works with a bin size value that is a power of two so, after applying the formula, the actual result will be an equivalent power of two value of the bin size result in order to feed FFT with data. The FFT algorithm receives an array of complex values (after converting the bytes into complex values) and outputs the FFT data also in complex format. To have the right values, it is necessary to compute the magnitude of the output complex array to obtain the amplitude values in a double format. It is now possible to plot the FFT data using the output double array as the Y axis (amplitude values) and X as the frequencies in Hz.
Figure 42 - Code snippet of FFT (android)
In order to compute the frequencies, it is necessary to calculate the frequency resolution, which by manipulating the formula (3), it goes like this:
𝒇∆= 𝑓𝑠 𝐹𝐹𝑇𝑆𝑖𝑧𝑒
The resulting value, multiplying with the iterator value of the length of the output double array from the FFT algorithm, presents the frequency spectrum of the audio file plotted in the X axis. The result:
Figure 43 - FFT data output example
Server Side Software
The server is responsible for delivering all the data to the mobile application using PHP scripts, Wowza streaming engine and MySQL serving as a slave of the Raspberry.
3.3.1 PHP
PHP is a programming language mostly used for web development but is also suited for general use, it is going to be used as a form of communication between the android application and the server using the REST architecture.
3.3.2 Wowza
Wowza is streaming service that is installed in the server and allows to receive and distribute streams through publish and subscribe. It supports almost all of the streaming protocols available in the market and also a large number of video and audio codecs. It has the advantage of making the streaming process much simpler has it is very flexible of using different protocols
3.3.3 PHP Scripts
The server houses a couple of PHP scripts to allow the mobile application to access the sensors’ data. A total of 5 scripts were developed, three of them return all of the saved data from each sensor in a JSON format and they work like this:
Start script Connect to server DB Retrieve all values and timestamps of the sensor Return data in JSON format End script
Figure 44 - flow chart for the full data returning scripts
The fourth script will return the latest recorded value for each sensor, depending on the “GET” variable that is passed by the mobile application. If a GET string “temp” is passed, the script returns the latest temperature value recorded, the same goes for the “hum” and “gas” strings for their respective sensors. The purpose of this script is to allow the mobile application to keep getting the latest value when it desires to show live readings within a certain interval.
Start script Read GET variable $sensor $sensor = temp? Connect to server DB $sensor =
hum? No $sensor = gas?
Yes Retrieve latest recorded values for temperature sensor Return data Yes Retrieve latest recorded values for humidity sensor Yes Retrieve latest recorded values for gas sensor
Return data Return data
End script
No $sensor = gps?
Yes
Retrieve latest recorded values
for gas sensor
Return data
No
Figure 45 - Flow chart for the latest data returning script
The last script is responsible for sending the signals to the Raspberry to trigger actions by communicating with the Raspberry Pi through the cloud server’s database to trigger signals.
Start script Read GET variable $signal $signal = adc? Connect to server DB $signal = stream? No $signal = shut? Yes Change sig_adc to 1 Yes Change sig_stream to 1 Yes Change sig_shutdown to 1 End script No No $signal = streamoff? No $signal = adcoff? Change sig_adc to 2 Change sig_stream to 2
Figure 46 - Flow chart for the signal triggering script
3.3.4 PHP Scripts Code Highlights
For the signals’ script, it’s mainly just change the database value when the mobile application wants to trigger something on the Raspberry Pi:
The script will receive a GET value passed with the script, like this: “http://92.222.xx.xxx/drone/trigger_signal.php?signal=streamoff” and in this case will ask to
stop the FFmpeg streaming program. The same for all other trigger actions: adc (to start data acquisition script), stream (to start FFmpeg), adcoff (to stop data acquisition script) and shut to shutdown the Raspberry Pi.
The script that returns the latest recorded value is implemented like this:
Figure 48 - PHP latest value script code snippet
After connecting to the database just like all the PHP scripts have to do first, in this case, the script will get the latest recorded value in the database based on the sensor name passed in the GET variable triggered with the http link.
Figure 49 - PHP all data returning script code
These scripts are the simplest ones, which will just access the server’s database and return all of the data for each sensor in a JSON format. There are three of these, one for each sensor.
3.3.5 JSON Format
The JSON format used in the data exchange is just arrays with the sensors’ values and timestamps. The reason to use JSON is mainly because large data sets are manipulated and this format provides an easy parsing of the values, as JSON has libraries in practically all programming languages making it easy to implement. If regular strings had to be used with all the data, the substring parsing would take far more time to pull through. Example of a JSON output of the temperature values:
Figure 50 - JSON output example
3.3.6 Wowza Streaming Service
the Raspberry Pi and the mobile application will subscribe to that same stream that was published by the ffmpeg using RTMP. For all this to work, the Wowza Streaming Engine was installed in the server to facilitate the streaming process. Wowza generates a link where it is allowed to publish streams with almost any audio/video streaming protocol and at the same time allows for subscriptions that lets a client software to play the audio/video, in this case, the mobile application. And since Wowza is flexible on the protocol usage, it is possible to play the stream using RTSP which Android has official support.
Figure 51 - Wowza Streaming Engine main screen
Android Application
The android application acts as a terminal of which a user can access all the data visually, the audio stream, audio data and also perform some actions on the Raspberry Pi.
3.4.1 Main screen
The activity that shows the data from the sensors, gps data and drone location on the map. The data is read live and in the case of the map, it tracks the movement of the drone by leaving a
Main application screen
Program flow User interaction
Start activity Read sensor values from the PHP scripts Connect to cloud server to access the PHP scripts End activity Show info on screen Clicked on start stream button? Yes Send signal to server to trigger stream start on Raspberry Play stream No Clicked on any other interaction button? Yes Send corresponding signal to server to trigger action on Raspberry No Application closed? Yes
Figure 53 - Main Activity screen shot
3.4.2 Sensors’ graphical data
This activity shows all the data from each sensor saved in the cloud’s database by accessing the PHP files and parsing the output JSON data into graphs.
Sensor plots screen
Start Finish Clicked on a sensor data button? Access the PHP script on server andobtain all the data recorded as JSON
Parse JSON data and plot the values
and timestamps
![Figure 6 - Cirrus Logic Audio Card and the possible connections [21]](https://thumb-eu.123doks.com/thumbv2/123dok_br/19169082.940442/22.892.170.721.112.486/figure-cirrus-logic-audio-card-and-possible-connections.webp)
![Figure 9 - SQ26-H1B Hydrophone [23]](https://thumb-eu.123doks.com/thumbv2/123dok_br/19169082.940442/24.892.260.633.100.391/figure-sq-h-b-hydrophone.webp)
![Figure 10 – Digital Thermometer DS18B20 [24]](https://thumb-eu.123doks.com/thumbv2/123dok_br/19169082.940442/25.892.278.618.112.387/figure-digital-thermometer-ds-b.webp)