FACULDADE DE CIÊNCIAS
DEPARTAMENTO DE BIOLOGIA ANIMAL
Dealing with uncertainty and heterogeneity in
the assessment of structural and functional
integrity in marine fish assemblages
Miguel Pessanha Freitas Branco Pais
DOUTORAMENTO EM BIOLOGIA
UNIVERSIDADE DE LISBOA
FACULDADE DE CIÊNCIAS
DEPARTAMENTO DE BIOLOGIA ANIMAL
Dealing with uncertainty and heterogeneity in
the assessment of structural and functional
integrity in marine fish assemblages
Miguel Pessanha Freitas Branco Pais
Tese orientada pelo Professor Doutor Henrique Cabral e
pela Professora Doutora Maria José Costa, especialmente
elaborada para a obtenção do grau de Doutor em Biologia
(especialidade de Biologia Marinha e Aquacultura).
Doctoral thesis in Biology (scientific area of Marine Biology and Aquaculture) presented to the University of Lisbon.
Tese apresentada à Universidade de Lisboa para obtenção do grau de Doutor (especialidade Biologia Marinha e Aquacultura).
________________________________
Miguel Pessanha Freitas Branco Pais
2013
“However fragmented the world, however intense the national rivalries, it is an inexorable fact that we become more interdependent every day. I believe that national sovereignties will shrink in the face of universal interdependence. The sea, the great unifier, is man's only hope. Now, as never before, the old phrase has a literal meaning: We are all in the same boat.”
Jacques-Yves Cousteau in National Geographic Magazine, 1981
Table of Contents
Resumo... 9 Summary... 10 Resumo alargado... 11 List of papers... 16 1. General introduction... 172. A critical approach to the use of published data for baseline characterisation of marine fish assemblages: An exercise on Portuguese coastal waters... 27
2.1. Introduction... 29
2.2. Materials and methods... 30
2.2.1. Study area... 30
2.2.2. Data collection and assumptions... 31
2.2.3. Guild classification... 33
2.2.4. Data analysis... 35
2.2.4.1. Minimising the effect of sampling methods... 35
2.2.4.2. Assemblage characterisation... 35
2.3. Results... 37
2.3.1. Minimising the effect of sampling methods... 37
2.3.2. Assemblage characterisation... 39
2.4. Discussion... 43
2.4.1. Comparability of methods and designs... 43
2.4.2. Characterisation of assemblage types: problems and achievements... 45
2.4.2.1. Rocky reefs (0−20m deep) ... 46
2.4.2.2. Shallow soft substrate (0−20m deep)... 47
2.4.2.3. Deep and intermediate soft substrate (20−200m deep) ... 47
2.5. Conclusions... 49
Appendix 2A... 52
3. Improving the “chain and tape” method: A combined topography index for marine fish ecology studies... 59
3.1. Introduction... 61
3.2. Materials and methods... 62
3.2.1. Study area... 62
3.2.2. Fish sampling method... 62
3.2.3. Topography sampling method... 64
3.2.4. Building and testing the index... 65
3.3. Results and discussion... 67
4. Topographic complexity and the power to detect structural and functional changes in temperate reef fish assemblages: The need for habitat-independent sample sizes... 75
4.1. Introduction... 77
4.2. Materials and methods... 79
4.2.1. Study area... 79
4.2.2. Fish assemblage surveys and topographic complexity... 80
4.2.3. Fish-based metrics... 81
4.2.4. Calculation of statistical power... 82
4.4. Discussion... 88
5. Seeking functional homogeneity: A framework for definition and classification of fish assemblage types to support assessment tools on temperate reefs... 97
5.1. Introduction... 99
5.2. Materials and methods... 101
5.2.1. Study area... 101
5.2.2. Fish sampling method... 101
5.2.3. Fish-based metrics and guild classification... 102
5.2.4. Environmental variables... 104
5.2.5. Typology definition... 105
5.2.5.1. Clustering sites according to categories of fish-based metrics... 105
5.2.5.2. Cluster ensembles and definition of assemblage types... 108
5.2.5.3. Classification model... 111
5.2.5.4. Algorithms and software... 112
5.3. Results... 112
5.3.1. Individual and ensemble clustering of data... 112
5.3.2. Variability of fish-based metrics and characterisation of assemblage types... 114
5.3.3. k-nearest neighbours classification model... 119
5.4. Discussion... 120
Appendix 5A... 128
6. Identifying functional homgeneity in a dynamic environment: Application to soft substrate fish assemblages off the Portuguese coast... 133
6.1. Introduction... 135
6.2. Materials and methods... 136
6.2.1. Study area... 136
6.2.2. Sampling method and fish-based metrics... 138
6.2.3. Environmental variables and trawling impact... 139
6.2.4. Definition of assemblage types... 140
6.2.4.1. Clustering sampling stations according to categories of fish-based metrics... 140
6.2.4.2. Cluster ensembles and characterisation... 142
6.2.5. Algorithms and software... 144
6.3. Results... 144
6.3.1. Clustering of sampling stations according to individual categories... 144
6.3.2. Ensemble clustering and definition of assemblage types... 149
6.3.3. Characterisation of assemblage types... 150
6.4. Discussion... 156
7. General discussion... 167
Resumo
O nível crescente de pressão humana sobre os ecossistemas marinhos levou a uma maior sensibilização para a necessidade de compreender a interconexão de efeitos directos e indirectos sobre comunidades e populações. Assim, na avaliação de associações de peixes marinhos, assiste-se a uma transição da monitorização do efeito da pesca em populações exploradas para a análise do efeito de várias fontes de impacto sobre comunidades.
Esta tese contribui para as novas exigências metodológicas da avaliação de integridade funcional em associações de peixes marinhos, utilizando a costa portuguesa como área de estudo. O primeiro estudo pretende analisar a distribuição e caracterização das associações de peixes em recifes rochosos e áreas de substrato móvel, baseando-se apenas em dados publicados. Embora seja possível uma caracterização geral, vários aspectos negativos dessas abordagens foram identificados e demonstrados, como as lacunas de informação, a questionável comparabilidade dos dados e a falta de detalhe sobre variação a pequena escala. Os dois estudos que se seguem destinam-se a compreender a variabilidade em recifes temperados. O primeiro centra-se na quantificação da complexidade topográfica, através da proposta de um novo índice que reflecte a resposta das comunidades de peixes a características topográficas; o segundo analisa a influência dessa complexidade no poder estatístico para detectar alterações em métricas de estrutura e função, com algumas orientações sobre o esforço amostral. Os dois estudos finais propõem um quadro metodológico para a definição de tipos de associações de peixes funcionalmente homogéneos, tendo em conta a variabilidade externa. No primeiro estudo, associações de peixes de recife são classificadas em tipos que persistem face à variabilidade entre transectos, enquanto que no segundo estudo, associações de substrato móvel da plataforma continental são classificadas em áreas que conservam a sua homogeneidade face à variação inter-anual contida em 5 anos de dados de monitorização.
Palavras-chave: peixes marinhos, gestão ambiental, monitorização ambiental,
Summary
The increasing level of human pressure on marine ecosystems has led to higher awareness towards the need to understasnd the inter-connection of direct and indirect effects on communities and populations. Therefore, in the assessment of marine fish assemblages, there is an ongoing shift from monitoring the effect of fishing in exploited populations to analysing the effect of several impact sources on communities.
This thesis contributes to the new methodological requirements of functional integrity assessments in marine fish assemblages, using the Portuguese coast as a study area. The first study attempts to analyse the distribution and characterisation of fish assemblages in rocky reefs and soft substrate areas by relying only on published data. Although a rough characterisation is achieved, several negative aspects of these approaches were pinpointed and demostrated, namely information gaps, questionable data comparability and the lack of detail on fine-scale variation. The two studies that follow are aimed at understanding variability in temperate reefs. The first one focuses on quantifying topographic complexity, through the proposal of a new index that reflects the response of fish communities to topographic features, and the second one analyses the influence of this complexity on the power to detect changes in structural and functional fish-based metrics, with some guidelines regarding sampling efforts. The two final studies propose a framework for the definition of functionally homogeneous fish assemblage types, while taking into account background variability. In the first study, reef fish assemblages are classified into types that persist in the face of fine-scale among-transect variability, while in the second study, soft substrate fish assemblages of the continental shelf are classified into areas that retain their homogeneity in the face of inter-annual variation, as described by 5 years of monitoring data.
Keywords: marine fish, environmental management, environmental monitoring,
Resumo alargado
Sabe-se que o ambiente marinho suporta cerca de 25% das espécies da Terra, existindo provavelmente ainda um número muito elevado de espécies marinhas por descrever. Esta enorme biodiversidade fornece bens e serviços inestimáveis ao ecossistema, do qual as populações humanas são uma parte muito importante. No entanto, o uso desses recursos pelo Homem tornou-se insustentável, e a pressão sobre o ambiente marinho disparou nas últimas décadas, atingindo níveis alarmantes em algumas regiões do globo. Isto levou a uma maior sensibilização dos decisores, e vários instrumentos políticos internacionais impõem agora a necessidade de evitar a deterioração e assegurar o uso sustentável dos recursos. Na verdade, os princípios da abordagem ecossistémica, propostos pela Convenção sobre a Diversidade Biológica no ano 2000, tiveram uma grande contribuição na forma como a política internacional lida com o equilíbrio entre conservação e uso de recursos no ambiente marinho. Em geral, esses princípios afirmam não só a necessidade de avaliar e antecipar possíveis impactos noutras áreas do ecossistema que não estão diretamente sob pressão, mas também a necessidade de incorporar a dimensão humana na equação, incluindo todas as partes interessadas e as áreas da sociedade que dependem directa ou indirectamente dos recursos.
Em comunidades de peixes, estes novos requisitos levaram a uma mudança de abordagem, de uma gestão apenas centrada nos efeitos da pesca em populações comercialmente exploradas para uma gestão mais integrada e transversal, onde várias fontes de impacto são tidas em conta, bem como o seu efeito em toda a comunidade. Esta abordagem tem sido aplicada em rios e estuários europeus no âmbito da Directiva Quadro da Água, onde as ferramentas com maior sucesso se centram em aspectos funcionais das comunidades, em vez de se focarem na identidade taxonómica. Isto ocorre geralmente com a divisão das espécies em grupos que possuem uma característica funcional comum (e.g. carnívoros, sedentários, resiliência elevada). Este aspecto tem sido fundamental para ajudar na distinção entre variabilidade natural e antropogénica, dado que grupos funcionais não só respondem de modo mais previsível aos impactos, como permitem maior resistência à variabilidade natural (quando espécies são substituídas por outras do mesmo grupo ao longo de um gradiente).
Esta tese consiste numa série de estudos que visam contribuir para as novas exigências metodológicas de abordagens funcionais baseadas em comunidades de peixes marinhos, tentando preencher algumas das lacunas relacionadas com a variabilidade e
heterogeneidade ambiental. De facto, apenas lidando com a incerteza e a heterogeneidade podemos efetivamente detectar impactos antropogénicos, compreender as limitações dos métodos e adaptar as necessidades de gestão aos recursos disponíveis.
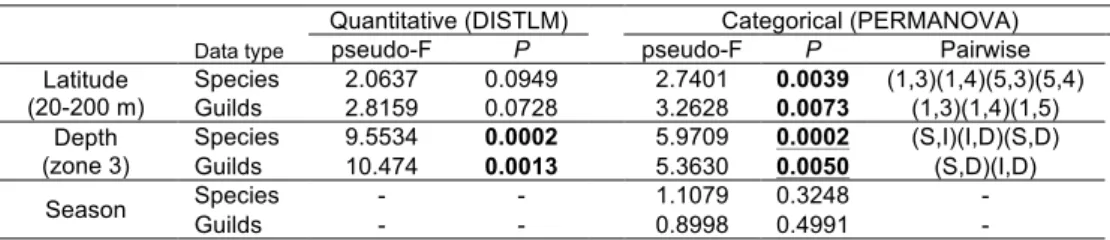
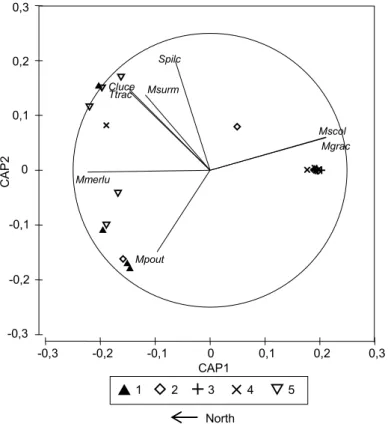
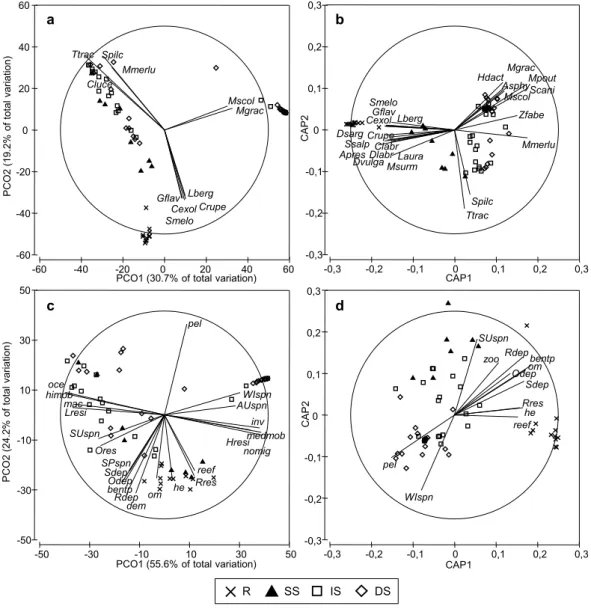
O primeiro estudo foi um exercício de caracterização de comunidades de peixes marinhos com base apenas em dados publicados sobre a costa de Portugal continental, abrangendo áreas de substrato móvel até aos 200m de profundidade e recifes rochosos perto da costa. Independentemente da própria caracterização, este exercício teve por objetivo abordar criticamente estes procedimentos, através da identificação de problemas e capacidades. Foram definidos critérios para a inclusão de estudos publicados e os conjuntos de dados foram padronizados através do uso de proporções de abundância de espécies e da classificação em secções espaciais e temporais comparáveis. As espécies foram classificadas e incluídas em diversos grupos funcionais e todas as análises foram realizadas separadamente para uma abordagem taxonómica clássica e uma abordagem com grupos funcionais. A influência da estação do ano, profundidade e latitude foram avaliadas através de análise de variância multivariada usando permutações (PERMANOVA) e modelos lineares com base em distância (DISTLM) e as associações de peixes foram caracterizados com base em métodos de ordenação multivariada e classificação hierárquica. Foram encontradas diferenças significativas entre estudos que empregam diferentes métodos em recifes rochosos e os outliers não foram utilizados na caracterização. Devido a limitações no detalhe espacial e temporal em dados publicados, apenas foi realizada uma caracterização de tipos de associações de peixes pouco detalhada e a larga escala, com conjuntos de dados divididos em recifes rochosos, substrato móvel pouco profundo (0−20 m), substrato móvel intermédio (20−100 m) e substrato móvel profundo (100−200 m). Não foram detectadas diferenças sazonais, mas uma relação não linear com a latitude foi encontrada em associações de substrato móvel profundo. Durante o exercício, as escalas temporais e espaciais foram forçadas pela qualidade dos dados e algumas análises não detectaram padrões conhecidos. Diferenças entre os métodos e tipos de dados levaram à necessidade de adoptar um grande número de pressupostos questionáveis para conseguir alguma comparabilidade. No geral, o exercício proporcionou uma visão prática sobre o uso de dados publicados para planeamento num contexto de gestão costeira, apontando a comparabilidade dos dados, a escala e as lacunas de informação como severas limitações destas abordagens.
em calcular o rácio entre a distância linear entre os pontos de início e fim de uma corrente ou cabo chumbado (chain) moldada à superfície do substrato e o seu comprimento total estendido, uma medida conhecida como o índice de rugosidade do substrato (SR). Esta medida tem várias vantagens no campo quando comparada com outros métodos, mas têm sido apontados alguns pontos fracos. No entanto, ainda é uma das medidas de topografia mais utilizadas em ecologia de peixes de recife. O estudo realizado propôs um índice de topografia combinado (CTI), que utiliza o método "chain and tape" no campo, com resultados que se aproximam de métodos mais complexos, superando o índice SR tradicional. O CTI é estruturado como uma soma ponderada de três características topográficas: índice SR, o número de ondulações (NC) e o relevo máximo vertical (MVR), sendo que a NC e MVR são aplicados coeficientes de peso que variam entre 0 e 1. Para estabelecer os coeficientes de peso, foram amostradas associações de peixes em seis locais de calibração, representando um gradiente de complexidade topográfica. Foram calculadas combinações de coeficientes de modo a que o CTI ficasse optimamente correlacionado com vários parâmetros estruturais de comunidades de peixes. A lista de possíveis soluções foi então aplicada a nove perfis esquemáticos publicados anteriormente e comparada com outros métodos. O índice final foi estabelecido como: CTI = (1 − SR) + NC/25 + MVR/25. No final, o desempenho preditivo do CTI e do tradicional SR foi testado, aplicando-os a 11 novos locais como variáveis preditoras de abundâncias de espécies em modelos lineares com base em distância (DISTLM). O CTI superou o SR quando adicionado a três variáveis previamente inseridas no modelo (profundidade, percentagem de cobertura com areia, percentagem de cobertura com calhau rolado), explicando 5,6% de variação adicional ao utilizar todas as espécies e 8,1% utilizando apenas as espécies criptobênticas, enquanto o SR não mostrou efeitos adicionais significativos.
O terceiro estudo teve como objetivo compreender a relação entre a complexidade topográfica em recifes ao longo da costa portuguesa e o poder estatístico para detectar alterações em métricas baseadas em associações de peixes. Em 14 locais ao longo da costa foram realizados seis transectos de censos visuais em mergulho para cada local e recorreu-se a simulações de Monte Carlo para gerar um grande número de replicados para representar a hipótese nula (ausência de alteração) e simular três hipóteses alternativas que representam diferentes magnitudes de alteração. O poder estatístico para detectar diferenças entre as hipóteses nula e alternativa foi estimado através de 10 mil testes de Mann-Whitney para números de replicados entre 2 e 15. O poder estatístico mostrou tendência para variar de acordo com a complexidade topográfica, particularmente
no caso de alterações pequenas e médias nos valores das métricas e quando se utiliza um número reduzido de replicados. Enquanto o poder aumenta com o aumento da complexidade para a maioria dos indicadores, alguns mostraram tendências decrescentes. Para uma alteração de grande magnitude foi necessário um número de replicados entre 5 e 15, dependendo da métrica, para estabilizar o poder estatístico acima de 0,80 independentemente das características do habitat. Um poder estatístico de 0,95, contudo, não foi atingido para a maioria das métricas em todos os locais, mesmo quando se utilizam 15 replicados. A observação de que a capacidade para detectar a degradação e recuperação de associações de peixes de recife parece variar de acordo com características do habitat significa que um programa de monitorização que está correctamente calculado para uma determinada área pode não ser directamente aplicável num recife nas proximidades. Para além da necessidade de maximizar o poder estatístico, este estudo enfatizou a necessidade de ter em conta a heterogeneidade do habitat nestes cálculos, estimando um esforço amostral que seja independente do habitat e apropriado para a escala e locais de interesse.
No quarto estudo propôs-se uma estrutura inovadora para definir tipos de associações de peixes de recifes rochosos através de um método aglomerativo denominado “metric
pairwise constrained k-means” (MPCK-means). Foram amostradas associações de peixes
em 14 locais ao longo da costa portuguesa e foram agrupados os locais com base em várias categorias grupos funcionais, numa abordagem que tem em conta a variabilidade que resulta do método de amostragem e de causas naturais. Este procedimento foi seguido de um segundo processo aglomerativo baseado na identidade dos grupos formados com cada uma das categorias funcionais, e que encontra padrões que minimizem a perda de informação ao integrar os resultados desses agrupamentos individuais. A classificação final foi obtida por comparação de três algoritmos de geração de consenso, tendo o melhor resultado mantido um índice médio de informação mútua normalizada de 0,605. Através de análises PERMANOVA hierárquicas foram encontradas diferenças significativas entre os tipos de associações e identificadas as métricas menos resistentes à variabilidade natural. Como complemento, foi proposto um método baseado num algoritmo classificador (k-nearest neighbours) para inserir novos locais na tipologia definida, tendo como base apenas variáveis ambientais que não são diretamente afectadas pela presença de impactos antrópogénicos. Os parâmetros do modelo de classificação foram optimizados e o melhor desempenho foi alcançado com votação ponderada por distância inversa dos quatro vizinhos mais próximos, com uma precisão
No último estudo propõe-se a aplicação do método utilizado anteriormente para identificar tipos de associações de peixes de substrato móvel ao longo da costa portuguesa. Usando o mesmo algoritmo MPCK-means, as estações de amostragem foram agrupadas com base em categorias de grupos funcionais, tendo em conta a variabilidade contida em 5 anos de monitorização com arrasto de fundo. Neste processo, foi comparada a utilização de dados em biomassa e abundância. Todos os agrupamentos feitos com base em categorias individuais foram combinados num conjunto final de sete tipos de associação de peixes. O efeito da profundidade, tipo de substrato e da variação latitudinal nos padrões de agrupamento foi também avaliado. Os dados de biomassa revelaram padrões mais homogéneos que facilitaram a distinção de áreas, mas a combinação de métricas com base em biomassa e abundância obteve os melhores resultados na definição de uma solução final.
A aplicação das classificações obtidas deve estar ligada a uma base de dados sólida, dado que os métodos utilizados são limitados pela qualidade e tamanho da base de dados que os suporta. Quanto maior for a base de dados, melhores serão as capacidades de previsão, um aspecto crucial num contexto de monitorização, uma vez que é necessário identificar o potencial de um determinado local, mesmo que o presente estado das comunidades esteja longe do ideal. No entanto, modelar o resultado da monitorização de uma comunidade de peixes inteira é imensamente complexo, a um nível que ainda está fora do alcance à luz do conhecimento actual. As razões pelas quais um peixe é encontrado num determinado local num determinado momento são uma combinação muito complexa de factores ambientais, interações entre indivíduos dentro das populações e comunidades e processos fisiológicos e preferências individuais.
Por estas razões, é muito importante realizar análises de poder estatístico, compreender as probabilidades de erro, limitar a variabilidade ambiental e avançar com o melhor plano de monitorização possível para o orçamento disponível. Um indicador incapaz de oferecer segurança suficiente limitará inevitavelmente a confiança dos responsáveis pelas fontes de impacto e a sua cooperação. A simplificação da complexidade dos sistemas através de formas eficientes e responsáveis é essencial para garantir que as ferramentas desenvolvidas são de confiança e aplicáveis num contexto de monitorização.
List of papers
This thesis consists of a series of papers, each one corresponding to a chapter, from 2 to 6. The author wrote all papers and was responsible for experimental design, field surveys and data analysis. Remaining authors collaborated in some or several of these procedures.
Chapter 2
Pais, M.P., Henriques, S., Costa, M.J., Cabral, H.N., 2012. A critical approach to the use of published data for baseline characterisation of marine fish assemblages: An exercise on Portuguese coastal waters. Ocean & Coastal Management 69, 173−184.
Chapter 3
Pais, M.P., Henriques, S., Costa, M.J., Cabral, H.N., 2013. Improving the “chain and tape” method: A combined topography index for marine fish ecology studies. Ecological Indicators 25, 250−255.
Chapter 4
Pais, M.P., Henriques, S., Costa, M.J., Cabral, H.N. Topographic complexity and the power to detect structural and functional changes in temperate reef fish assemblages: the need for habitat-independent sample sizes. Submitted to Journal of Applied Ecology.
Chapter 5
Pais, M.P., Henriques, S., Batista, M.I., Costa, M.J., Cabral, H.N., 2013. Seeking functional homogeneity: A framework for definition and classification of fish assemblage types to support assessment tools on temperate reefs. Ecological Indicators 34, 231−245.
Chapter 6
Pais, M.P., Henriques, S., Murta, A.G., Azevedo, M., Costa, M.J., Cabral., H.N. Identifying functional homogeneity in a dynamic environment: Aplication to soft-substrate fish assemblages off the Portuguese coast. Submitted to Journal of Sea Research.
For every paper, a QR code like the one presented here is provided at the start of the corresponding chapter. Scanning this code with any smartphone or tablet will link to the published version. Alternatively, scanning this example code will lead to an index containing all papers.
Chapter 1
The marine environment is known to support about 25% of the Earth’s species, and there is reason to believe there may be yet a very large number of marine species awaiting description (Mora et al., 2011). This huge biodiversity provides invaluable goods and services to the ecosystem, of which human populations are a very important part (Worm et
al., 2008). However, the use of these resources by humankind has become far from
sustainable, and the anthropogenic pressure on the marine environment has escalated in the last decades, reaching alarming levels in some regions of the globe (Halpern et al., 2008). This has led to increasing awareness among decision-makers, and several international policy tools now enforce the need to prevent deterioration and ensure the sustainable use of resources. In fact, the 12 principles of the ecosystem approach proposed by the Convention of Biological Diversity (CBD, 2000) have had a great contribution to the way international policy deals with the balance among conservation and use of resources in the marine environment. In general, these principles state not only the need to assess and anticipate possible impacts in other areas of the ecosystem that are not directly under pressure but also the need to incorporate the human dimension into the equation, including all stakeholders and areas of the society that directly and indirectly depend on the resources. The need for an ecosystem approach to fisheries (Garcia and Cochrane, 2005; Jennings, 2005) has led to the establishment of ecosystem-based fisheries management practices (Link, 2002; Nicholson and Jennings, 2004) and ultimately to the concept of ecosystem-based management of the marine environment (Browman and Stergiou, 2004; McLeod et al., 2005). This concept is now introduced into marine policy worldwide (Forst, 2009) and plays a strong part in European marine policy tools such as the Marine Strategy Framework Directive (MSFD; EC, 2008) and the Common Fisheries Policy (CFP; EC, 2011).
In a healthy ecosystem, communities are only limited by environmental factors and the result of their own interaction (predation, competition, reproduction) (Diaz et al., 2004; Johnson et al., 2012). In the marine environment, one of the main factors that can determine the potential community composition of a given habitat is the type of substrate, which can roughly be divided into hard substrate (reefs) and soft substrate (sand, mud). In soft substrate communities, sediment properties can have a direct effect on benthic organisms (Rhoads, 1974) but the main driving force for both benthic and demersal organisms is usually depth, and changes in community composition tend to occur along a depth gradient (Lampitt et al., 1986; Sousa et al., 2005, 2006; Johnson et al., 2012). In rocky reefs, communities are highly dependent on the complexity of the substrate, as a
in turn will provide food and shelter for adult and juvenile fish and mobile invertebrates. The occurrence of holes and crevices of several sizes, boulders, cobble and large blocks also provides shelter from hydrodynamic stress and increases the number of niches available for species to thrive (Ferreira et al., 2001; García-Charton and Pérez-Ruzafa, 2001; Fraschetti et al., 2005). In addition to spatial variability due to environmental factors, there is also significant temporal variability at several scales, from movement of organisms across the day (e.g. Gibson et al., 1998), to weekly, monthly or seasonal patterns (e.g. Cadée, 1986; Holbrook et al., 1994; Beyst et al., 2001), decadal climatic oscillations (Henriques et al., 2007; Kröncke et al., 2013), as well as large scale climate change (Roessig et al., 2005; Gamito et al., 2012).
As a system becomes impacted by human-induced pressures such as fishing, sewage discharges and habitat loss, changes occur that lead to a shift in the overall state of the communities, with drastic reductions in abundance or disappearance of sensitive species and increases in abundance of stress-tolerant opportunistic species (e.g. Islam and Tanaka, 2004; Arévalo et al., 2007; McKinley and Johnston, 2010). The challenge that stands before environmental managers and the scientific community in general is to be able to search within this immense pool of variability and detect which part of it is directly or indirectly related to human action. Not only must we accomplish this but it must be done in a timely manner, so that management decisions can effectively reverse degradation.
The way scientists and managers are dealing with natural variability can be roughly divided into two main approaches: the first one is to incorporate or model the behaviour of environmental variables and the second one is to minimise their effects by partitioning the area of interest into homogeneous sections. Incorporating environmental variability can be accomplished either by using a BACI (before-after control-impact) approach or its variations (e.g. Underwood, 1994), where changes in the control sites before and after an impacted situation are assumed to be due to natural causes, or by identifying environmental variables responsible for changes, quantifying and excluding their effects (e.g. García-Charton et al., 2004). These approaches, however, are mostly suited for relatively small-scale studies or direct assessments of a known impact source. In national and international large scale monitoring programmes, however, modelling every possible combination of environmental conditions and their interactions is an extremely difficult task, and thus the most frequently used methods aim to reduce environmental variability by defining relatively homogeneous units within which the state of the communities is assessed (Maxwell and Buddemeier, 2002). This can be achieved either through a top-down approach, by delimiting areas with similar habitat features at an appropriate scale
(Valesini et al., 2003; Ramos et al., 2012), or through a bottom-up approach, by grouping areas with similar community composition for the organisms of interest (Araújo and Azevedo, 2001; Bremner et al., 2003). A top-down approach is advantageous for standardising assessment scales, since environmental homogeneity can be organised hierarchically according to scale (Costello, 2009). On the other hand, such an approach is not guaranteed to lead to units supporting homogeneous communities, particularly of free-swimming organisms (Stoner, 2003). This reason supports the need for bottom-up definition of units using the communities of interest, followed by inference about the range of environmental features where those communities occur. With such an approach, spatial and temporal scales will likely vary according to the type of organism considered but the resulting units will more accurately reflect the achievable level of homogeneity within the variables that will in fact be monitored, such as species abundances.
Dealing with uncertainty in ecology and environmental management is undoubtedly a challenging task. In addition to natural variability, there are also sampling errors that contribute to background noise. These include systematic errors due to the selectivity of the methods, observer bias and other constraints, as well as random errors, generated by the movement of organisms relative to the sampling units (Vézina, 1988; Irigoyen et al., 2013; McClanahan et al., 2007). While an adequate monitoring plan can minimise the influence of random errors and small-scale natural variability, marine ecosystems present an additional barrier, as all processes occur under large masses of saltwater, in an environment that is still harsh for humans. For this reason, marine monitoring usually requires complex and/or expensive resources and techniques, and budget constraints tend to be very limiting in every monitoring programme (Borja and Elliott, 2013). This leads to institutions and managers often resorting to less demanding solutions that are, more often than not, inadequate and insufficient (de Jonge et al., 2006; Borja and Elliott, 2013; Pais, 2013). Using available published data or scattered databases to design large scale monitoring plans is not an uncommon alternative to more expensive approaches but this can lead to huge data gaps and a general disregard for the actual methods that will be applied in the field. Another approach is to apply a monitoring programme that fulfils the (often lax) requirements of national or international policy tools but does not necessarily provide sufficient certainty in estimates and can therefore mislead managers, with ecological and socioeconomic consequences. One of the clearest examples of this is fisheries stock assessments and predictive models, which are the basis for the establishment of regulatory measures that can be costly if unnecessarily applied and
been suggested that catch data fails to reflect the real state of populations (Pauly et al., 2013), and even some of the most complete stock survey programmes have been shown to often require a decade to provide, with enough certainty, indication that a worrying decline is occurring (Maxwell and Jennings, 2005).
While uncertainty is still a complex challenge at the population level, it can easily escalate in complexity when assessing marine communities or, ultimately, the whole ecosystem (Pais, 2013). Lessons learned from community-based assessments in transitional waters for the European Water Framework Directive (WFD; EC, 2000) have shown that the choice of sampling method and protocol can have huge impacts on the perceived abundance of some species (Pasquaud et al., 2012), and that some of the monitoring plans already established are leading to much more uncertainty than would be desirable for decision support purposes (Gamito et al., 2012). For these reasons, there is evidence to support the need to prioritise scientific background knowledge regarding environmental features and sampling procedures in the planning phase of community-based assessments in the marine environment, in order to minimise problems that may arise once monitoring programmes are established.
Among all organisms in the marine environment, fish have been given a minor role in marine community-based assessments required by European policy tools, and their management has been mostly focused on the impact of fishing in a few commercially important populations. However, due to their great socioeconomic importance, as well as their valuable contribution to the stability of the ecosystem (Holmlund and Hammer, 1999), monitoring the state of fish communities is now a requirement of more recent tools like the MSFD, as well as part of monitoring and management plans in Marine Protected Areas (MPA) worldwide (García-Charton et al., 2000; Côté et al., 2001; Denny and Babcock, 2004; EC, 2008). In fact, the diversity of niches occupied by fish species, from bottom-dwelling invertebrate feeders to pelagic plankton filterers, has been pointed out as one of the main advantages of using fish communities as indicators of ecosystem instability and degradation (Harrison and Whitfield, 2004). This, allied to their relative easiness of identification, can provide the bases for short-term indicators of anthropogenic impacts on the marine environment. Nevertheless, high mobility, schooling behaviour and cryptic habits are some of the behavioural aspects of fish that can greatly affect the variability of abundance estimates, and thus our ability to discern human-driven from natural changes (Samoilys and Carlos, 2000; Maxwell and Jennings, 2005; McClanahan et al., 2007; Irigoyen et al., 2013). In order to minimise these issues, promising results have been obtained by classifying species according to functional guilds that respond more
predictably to stress (Elliott et al., 2007; Rochet and Trenkel, 2003). These functional approaches have been thoroughly used in streams and estuaries, where several measurable aspects of fish communities, such as species richness, total abundance and functional guilds are combined into multimetric indices that are able to detect deviation from a functionally healthy community (Pérez-Dominguez et al., 2012). This approach has recently been brought into the marine environment, both in a similar form (e.g. Henriques
et al., 2008) and also as a set of tools to support ecosystem-based fisheries management
(Rochet and Trenkel, 2003; Nicholson and Jennings, 2004) but its application is still at a very early stage. While many studies have stressed the need for functional approaches, there are still large methodological gaps regarding their practical application, particularly the response of functional guilds to specific pressure sources and their relationship with uncertainty and environmental heterogeneity. It is therefore urgent, given the urgency of detecting and acting upon human impacts on the marine environment, that these gaps are filled before the functional integrity of fish communities can be properly assessed.
This thesis consists of a series of works that aim to contribute to the new methodological requirements of community-based, functional approaches to marine fish assemblage monitoring, by attempting to fill in some of the gaps related to background variability and environmental heterogeneity. In fact, only by dealing with uncertainty and heterogeneity can we effectively detect anthropogenic impacts, understand the limitations of the methods and adapt management needs to the available resources. In chapter 2, a classification of fish assemblage types on the Portuguese coast is attempted using only published data as a basis. The problems and achievements of such a procedure are analysed and demonstrated, and some alternatives and good practices are suggested. The problems of using published data set the basis for approaching some of the practical aspects that can only be solved when using field data that incorporate fine scale variability with standardised and directly comparable sampling methods. Chapters 3 and 4 approach the issues of uncertainty and heterogeneity in temperate reefs, focusing on two different perspectives. In chapter 3, a method is proposed to quantify topographic complexity as perceived by fish communities, a solution to incorporate the fact that different organisms have different responses to habitat heterogeneity. This is followed, in chapter 4, by an assessment of the relationship between topographic complexity and the effort needed to detect changes in metrics of structural and functional integrity with enough certainty. Finally, chapters 5 and 6 describe and apply a framework for the definition of fish assemblage types that retain the best achievable level of structural and functional
is applied to temperate reefs, taking into account the variability associated with underwater visual census and, in chapter 6, the same method is applied to soft-substrate areas along the coast, taking into account inter-annual variability along 5 years of bottom-trawl surveys. Overall, this thesis proposes new approaches and methodologies for community-based assessment of marine fish, integrated in an ecosystem approach. In this way, it attempts to strengthen the bases that are needed for a reliable and scientifically supported use of fish communities as short-term indicators of human impacts on the functional integrity of marine ecosystems.
References
Araújo, F.G., Azevedo, M.C.C., 2001. Assemblages of Southeast-South Brazilian Coastal Systems Based on the Distribution of Fishes. Estuarine, Coastal and Shelf Science 52, 729–738.
Arévalo, R., Pinedo, S., Ballesteros, E., 2007. Changes in the composition and structure of Mediterranean rocky-shore communities following a gradient of nutrient enrichment: descriptive study and test of proposed methods to assess water quality regarding macroalgae. Marine Pollution Bulletin 55, 104–113.
Beyst, B., Buysse, D., Dewicke, A., Mees, J., 2001. Surf Zone Hyperbenthos of Belgian Sandy Beaches: Seasonal Patterns. Estuarine, Coastal and Shelf Science 53, 877−895.
Borja, Á., Elliott, M., 2013. Marine monitoring during an economic crisis: The cure is worse than the disease. Marine Pollution Bulletin 68, 1−3.
Bremner, J., Rogers, S.I., Frid, C.L.J., 2003. Assessing functional diversity in marine benthic ecosystems: a comparison of approaches. Marine Ecology Progress Series 254, 11–25.
Browman, H.I., Stergiou, K.I. (eds), 2004. MEPS Theme Section: Perspectives on ecosystem-based approaches to the management of marine resources. Marine Ecology Progress Series 274, 269– 303.
Cadée, G.C., 1986. Recurrent and changing seasonal patterns in phytoplankton of the westernmost inlet of the Dutch Wadden Sea from 1969 to 1985. Marine Biology 93, 281−289.
CBD, 2000. Ecosystem Approach. COP 5 Decision V/6 (available at:
www.cbd.int/decision/cop/default.shtml?id=7148).
Costello, M.J., 2009. Distinguishing marine habitat classification concepts for ecological data management. Marine Ecology Progress Series 397, 253–268.
Côté, I.M., Mosqueira, I., Reynolds, J.D., 2001. Effects of marine reserve characteristics on the protection of fish populations: a meta-analysis. Journal of Fish Biology 59 (Suppl. A), 178–189. Denny, C.M., Babcock, R.C., 2004. Do partial marine reserves protect reef fish assemblages?
Biological Conservation 116, 119–129.
Diaz, R.J., Solan, M., Valente, R.M., 2004. A review of approaches for classifying benthic habitats and evaluating habitat quality. Journal of Environmental Management 73, 165–181.
EC, 2000. Directive 2000/60/EC of the European Parliament and of the Council of 23 October 2000 establishing a framework for community action in the field of water policy. Official Journal of the EU C 242E,11−30.
EC, 2008: Directive 2008/56/EC of the European Parliament and of the Council of 17 June 2008, establishing a framework for community action in the field of marine environmental policy (Marine Strategy Framework Directive). Official Journal of the EU L 164, 19–40.
EC, 2011. Reform of the common fisheries policy. Communication from the Commission to the European Parliament, the Council, the European Economic and Social Committee and the Committee of the Regions. COM(2011) 417 final (available at: http://goo.gl/nQ6jL).
Ferreira, C.E.L., Gonçalves, J.E.A., Coutinho, R., 2001. Community structure of fishes and habitat complexity on a tropical rocky shore. Environmental Biology of Fishes 61, 353–369.
Forst, M.F., 2009. The convergence of Integrated Coastal Zone Management and the ecosystems approach. Ocean & Coastal Management 52, 294–306.
Fraschetti, S., Terlizzi, A., Benedetti-Cecchi, L., 2005. Patterns of distribution of marine assemblages from rocky shores: evidence of relevant scales of variation. Marine Ecology Progress Series 296, 13–29.
Gamito, R., Pasquaud, S., Courrat, A., Drouineau, H., Fonseca, V.F., Gonçalves, C.I., Wouters, N., Costa, J.L., Lepage, M., Costa, M.J., Cabral, H.N., 2012. Influence of sampling effort on metrics of fish-based indices for the assessment of estuarine ecological quality. Ecological Indicators 23, 9–18.
Garcia, S., Cochrane, K., 2005. Ecosystem approach to fisheries: a review of implementation guidelines. ICES Journal of Marine Science 62, 311–318.
García-Charton, J.A., Pérez-Ruzafa, Á., 2001. Spatial pattern and the habitat structure of a Mediterranean rocky reef fish local assemblage. Marine Biology 138, 917–934.
García-Charton, J.A., Pérez-Ruzafa, Á., Sánchez-Jerez, P., Bayle-Sempere, J.T., Reñones, O., Moreno, D., 2004. Multi-scale spatial heterogeneity, habitat structure, and the effect of marine reserves on Western Mediterranean rocky reef fish assemblages. Marine Biology 144, 161–182. Gibson, R.N., Pihl, L., Burrows, M.T., Modin, J., Wennhage, H., Nickell, L.A.,1998. Diel movements
of juvenile plaice Pleuronectes platessa in relation to predators, competitors, food availability and abiotic factors on a microtidal nursery ground. Marine Ecology Progress Series 165, 145−159. Halpern, B.S., Walbridge, S., Selkoe, K. a, Kappel, C. V., Micheli, F., D’Agrosa, C., Bruno, J.F.,
Casey, K.S., Ebert, C., Fox, H.E., Fujita, R., Heinemann, D., Lenihan, H.S., Madin, E.M.P., Perry, M.T., Selig, E.R., Spalding, M., Steneck, R., Watson, R., 2008. A global map of human impact on marine ecosystems. Science 319, 948–952.
Harrison, T.D., Whitfield, A.K., 2004. A multi-metric fish index to assess the environmental condition of estuaries. Journal of Fish Biology 65, 683–710.
Henriques, M., Almada, V.C., Gonçalves, E.J., 2007. Rapid shifts in a marine fish assemblage follow fluctuations in winter sea conditions. Marine Ecology Progress Series 340, 259–270.
Holbrook, S.J., Kingsford, M.J., Schmitt, R.J., Stephens, J.S., 1994. Spatial and Temporal Patterns in Assemblages of Temperate Reef Fish. Integrative and Comparative Biology 34, 463−475. Holmlund, C.M., Hammer, M., 1999. Ecosystem services generated by fish populations. Ecological
Irigoyen, A.J., Galván, D.E., Venerus, L.A., Parma, A.M., 2013. Variability in abundance of temperate reef fishes estimated by visual census. PLoS ONE 8, e61072.
Jennings, S., 2005. Indicators to support an ecosystem approach to fisheries. Fish and Fisheries 6, 212–232.
Johnson, A.F., Jenkins, S.R., Hiddink, J.G., Hinz, H., 2012. Linking temperate demersal fish species to habitat: scales, patterns and future directions. Fish and Fisheries. doi: 10.1111/j.1467-2979.2012.00466.x.
de Jonge, V.N., Elliott, M., Brauer, V.S., 2006. Marine monitoring: Its shortcomings and mismatch with the EU Water Framework Directive’s objectives. Marine pollution bulletin 53, 5–19.
Kröncke, I., Reiss, H., Dippner, J.W., 2013. Effects of cold winters and regime shifts on macrofauna communities in shallow coastal regions. Estuarine, Coastal and Shelf Science 119, 79–90. Lampitt, R.S., Billett, D.S.M., Rice, A.L., 1986. Biomass of the invertebrate megabenthos from 500 to
4100 m in the northeast Atlantic Ocean. Marine Biology 93, 69−81.
Link, J.S., 2002. What does ecosystem-based fisheries management mean. Fisheries 27, 18–21. Maxwell, B., Buddemeier, R., 2002. Coastal typology development with heterogeneous data sets.
Regional Environmental Change 3, 77–87.
Maxwell, D., Jennings, S., 2005. Power of monitoring programmes to detect decline and recovery of rare and vulnerable fish. Journal of Applied Ecology 42, 25–37.
McClanahan, T.R., Graham, N.A.J., Maina, J., Chabanet, P., Bruggemann, J.H., Polunin, N.V.C., 2007. Influence of instantaneous variation on estimates of coral reef fish populations and communities. Marine Ecology Progress Series 340, 221–234.
McKinley, A., Johnston, E., 2010. Impacts of contaminant sources on marine fish abundance and species richness: a review and meta-analysis of evidence from the field. Marine Ecology Progress Series 420, 175–191.
McLeod et al., 2005. Scientific Consensus Statement on Marine Ecosystem-Based Management. Available at http://goo.gl/dfgFa.
Mora, C., Tittensor, D.P., Adl, S., Simpson, A.G.B., Worm, B., 2011. How Many Species Are There on Earth and in the Ocean? PLoS Biology 9, e1001127.
Nicholson, M.D., Jennings, S., 2004. Testing candidate indicators to support ecosystem-based management: the power of monitoring surveys to detect temporal trends in fish community metrics. ICES Journal of Marine Science 61, 35–42.
Pais, M.P., 2013. Ecosystems: Marine monitoring is hard and costly. Nature 495, 174.
Pauly, D., Hilborn, R., Branch, T.A., 2013. Fisheries: Does catch reflect abundance? Nature 494, 303−306.
Pérez-Domínguez, R., Maci, S., Courrat, A., Lepage, M., Borja, A., Uriarte, A., Neto, J.M., Cabral, H., St.Raykov, V., Franco, A., Alvarez, M.C., Elliott, M., 2012. Current developments on fish-based indices to assess ecological-quality status of estuaries and lagoons. Ecological Indicators 23, 34– 45.
Ramos, E., Juanes, J. a., Galván, C., Neto, J.M., Melo, R., Pedersen, A., Scanlan, C., Wilkes, R., Van den Bergh, E., Blomqvist, M., Karup, H.P., Heiber, W., Reitsma, J.M., Ximenes, M.C., Silió, A., Méndez, F., González, B., 2012. Coastal waters classification based on physical attributes along the NE Atlantic region. An approach for rocky macroalgae potential distribution. Estuarine, Coastal and Shelf Science 112, 105–114.
Rhoads, D.C., 1974. Organism–sediment relations on the muddy seafloor. Oceanography and Marine Biology: An Annual Review 12, 263–300.
Roessig, J.M., Woodley, C.M., Cech, J.J., Hansen, L.J., 2005. Effects of global climate change on marine and estuarine fishes and fisheries. Reviews in Fish Biology and Fisheries 14, 251–275. Samoilys, M.A., Carlos, G., 2000. Determining methods of underwater visual census for estimating
the abundance of coral reef fishes. Environmental Biology of Fishes 57, 289–304.
Shahidul Islam, M., Tanaka, M., 2004. Impacts of pollution on coastal and marine ecosystems including coastal and marine fisheries and approach for management: a review and synthesis. Marine Pollution Bulletin 48, 624–49.
Sousa, P., Azevedo, M., Gomes, M.C., 2005. Demersal assemblages off Portugal: Mapping, seasonal, and temporal patterns. Fisheries Research 75, 120–137.
Sousa, P., Azevedo, M., Gomes, M.C., 2006. Species-richness patterns in space, depth , and time (1989-1999) of the Portuguese fauna sampled by bottom trawl. Aquatic Living Resources 103, 93–103.
Stoner, A.W., 2003. What constitutes essential nursery habitat for a marine species? A case study of habitat form and function for queen conch. Marine Ecology Progress Series 257, 275–289. Rhoads, D.C., 1974. Organism–sediment relations on the muddy seafloor. Oceanography and
Marine Biology: An Annual Review 12, 263–300.
Rochet, M.-J., Trenkel, V.M., 2003. Which community indicators can measure the impact of fishing? A review and proposals. Canadian Journal of Fisheries and Aquatic Sciences 60, 86–99.
Underwood, A.J., 1994. On Beyond BACI: sampling designs that might reliably detect environmental disturbances. Ecological Applications 4, 3–15.
Valesini, F.J., Clarke, K.R., Eliot, I., Potter, I.C., 2003. A user-friendly quantitative approach to classifying nearshore marine habitats along a heterogeneous coast. Estuarine, Coastal and Shelf Science 57, 163–177.
Vézina, A.F., 1988. Sampling variance and the design of quantitative surveys of the marine benthos. Marine Biology 97, 151−155.
Worm, B., Barbier, E.B., Beaumont, N., Duffy, J.E., Folke, C., Halpern, B.S., Jackson, J.B.C., Lotze, H.K., Micheli, F., Palumbi, S.R., Sala, E., Selkoe, K. a, Stachowicz, J.J., Watson, R., 2006. Impacts of biodiversity loss on ocean ecosystem services. Science 314, 787–790.
Chapter 2
A critical approach to the use of published data for baseline characterisation
of marine fish assemblages: An exercise on Portuguese coastal waters.
Abstract
Policy-makers are becoming increasingly aware of the importance of coastal fish communities for the integrity of marine habitats. However, initial assessments are often done prior to any major funding and available published data is sometimes seen as a low-cost approach to this problem. The present work constituted an exercise on marine fish assemblage characterisation, by relying only on published data from mainland Portugal, covering soft substrate areas and nearshore rocky reefs. Regardless of the characterisation itself, this exercise aimed to critically approach these procedures, by pinpointing problems and highlighting achievements. Criteria were defined for the inclusion of published studies and included datasets were standardised in terms of species proportions, spatial and temporal scales. Species were assigned to ecological guilds and all analyses were performed separately for species and guild data. The influence of season, depth and latitude were analysed through multivariate analysis of variance using permutations and distance-based linear models and assemblages were characterised based on multivariate ordination and hierarchical classification methods.
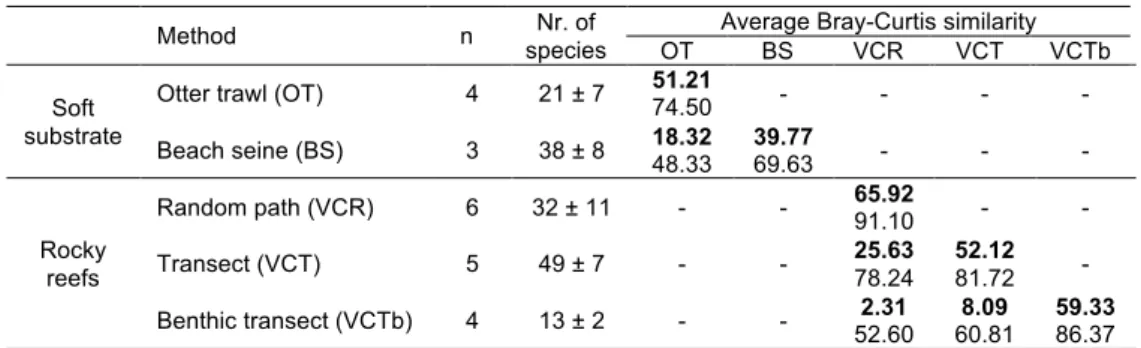
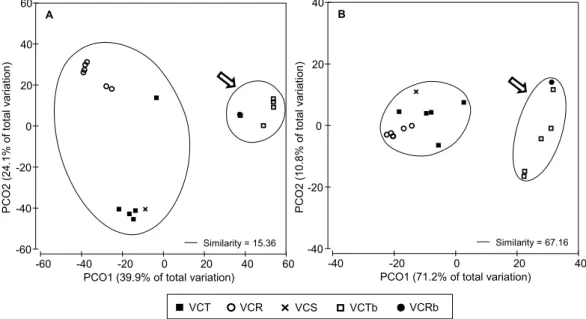
Significant differences were found between studies employing different methods in rocky reefs and outliers were not used in assemblage characterisation. Due to limitations in spatial and temporal detail in published data, only a rough, large-scale characterisation of assemblage types was accomplished, with datasets divided in rocky reefs, shallow soft-substrate (0−20 m), intermediate soft-soft-substrate (20−100 m) and deep soft soft-substrate (100−200 m). No seasonal differences were detected but a non-linear relationship with latitude was found in deep soft-substrate assemblages. During the exercise, spatial and temporal scales were forced by the quality of the data and some analyses failed to detect known patterns. Differences between methods, designs and types of data required assumptions to be made regarding data comparability. Overall, the exercise provided a hands-on insight into the use of published data for planning in a coastal management context, pinpointing data comparability, scale and information gaps as severe limitations of these approaches. In order to improve planning and design, some proposed measures were highlighted, such as the establishment of national databases and the use of pilot studies.
2.1. Introduction
Due to the consequences of increasing anthropogenic pressure on the marine environment, several national and international policies are addressing the need to maintain the integrity of marine ecosystems (Ricketts and Harrison, 2007; Borja et al., 2008; Katsanevakis et al., 2011). In fact, in Europe, the importance of coastal fish communities for the stability of the ecosystem and their role in supporting stocks is being increasingly addressed by both international policies and local management requirements (Borja, 2006; EC, 2008; Stål et al., 2008). Moreover, the high socio-economic value of fish, allied to their relative easiness of identification, diversity of ecological guilds, longevity, among others, are important advantages of using them as quality indicators for water bodies (Whitfield and Elliott, 2002; Harrison and Whitfield, 2004).
On the marine environment, most of the work has been centred on the impact of fishing on exploited fish species (e.g. Rice, 2000; Sainsbury et al., 2000) or, more recently, on an ecosystem approach to fisheries management (e.g. Browman and Stergiou, 2004; Jennings, 2005) that constitutes a holistic approach to fisheries but leaves a minor role to other anthropogenic impacts (Dethlefsen and Tiews, 1985). Adding the human dimension to the ecosystem is now deeply embedded in European policy, with the inter-connection of all species and habitats being a keystone principle in Integrated Coastal Zone Management. In fact, there is increased awareness that the effects of humans on exploited resources are reciprocal (Forst, 2009). With this in mind, the implementation of the Marine Strategy Framework Directive in 2008 (EC, 2008) has set the goals for improving the state of European marine waters but the scientific community is yet struggling to understand some of the underlying fundamental differences between marine habitats that define the “best” potential community a given area can support.
So far, the most common fish-based tools created in response to policy requirements in streams and estuaries (Roset et al., 2007; Cabral et al., 2012) and, more recently, in coastal waters (Henriques et al., 2008a,b) are multimetric indices, which rely mainly on functional guilds, by comparing measurable aspects of a community with “reference” values that correspond to a certain “status” in a given “type” of habitat. However, these (and likely other) tools have requirements that need to be fulfilled before they can be successfully applied in a monitoring context, namely the definition of habitat “types” and the understanding of how the relative importance of each functional unit in a community varies between habitats (Henriques et al., 2008b).
The downside is that initial assessments are often done prior to any major funding and, more often than desirable, have no choice but to rely on available published data compiled
in a database of previous studies for a given area (Aiken et al., 1999; Elliott et al., 1999). Because published data have served different purposes, often there is valuable information missing regarding habitat characteristics that would prove useful in defining habitat types (Olenin and Daunys, 2004). However, since what is ultimately measured is the supported community, some information can be obtained by looking at the assemblages themselves. Assuming that in a baseline characterisation of coastal areas, data should represent the natural state of a system, surveys performed in heavily impacted sites should be avoided, as they are likely to support “unnatural” communities (Smith et al., 1999; Guidetti et al., 2003). Another important aspect when characterising assemblages in a monitoring context is that species lists are insufficient, as important variations in abundance would pass unnoticed (Hewitt et al., 2005; de Jonge et al., 2006). On the other hand, it is known that different sampling designs and methods can lead to different abundance estimates for a given area (Willis et al., 2000; Pasquaud et al., 2012), which, coupled with the fact that raw abundances are not frequently published (e.g. Olenin and Daunys, 2004), can prevent the use of abundance values for analysis.
The present work constitutes an exercise of marine fish assemblage characterisation using only published data as a basis. As a case study, we will focus on the coastal waters of mainland Portugal down to 200 m deep, covering soft substrate areas and nearshore rocky reefs, in an attempt to understand the main gradients and factors delimiting fish assemblages, not only in terms of species composition but also using ecological guild data. The study ultimately aims to critically approach such procedures, by pinpointing problems and highlighting achievements.
2.2. Materials and methods
2.2.1. Study areaThe Portuguese coast is located in western Iberian Peninsula and extends from the Minho river mouth southwards along the 9º W meridian, and then eastwards at cape São Vicente (figure 2.1). The continental shelf is relatively narrow and its most conspicuous irregularity is the Nazaré Canyon. Reaching depths of around 5000 m, this depression divides the western shelf in a northern, flatter section up to 70 km wide, and a southern, steeper section up to 20 km wide until cape São Vicente, then reaching a width of about 30 km in the south coast (Gomes et al., 2001). Over the shelf, upwelling occurs during warm months (April-September) due to predominant northern winds. In winter, only intermittent and weaker upwelling periods are observed. Average sea surface temperature usually
Figure 2.1. Map of the study area with coastal zones delimited by IPIMAR (1980, 1981a,b,
1982, 1984) based on hydro-morphological criteria. The 20 m, 50 m, 100 m and 200 m isobaths are represented.
2.2.2. Data collection and assumptions
For the purpose of this study, no privileged access to databases was used and only publicly available data was considered. In general, it was found that data on composition and abundance of fish assemblages in the study area is not easily accessible, being mostly scattered across several sources in research papers, academic theses and technical reports. Nevertheless, an effort was made to compile data from various locations, depth ranges, seasons and substrates.
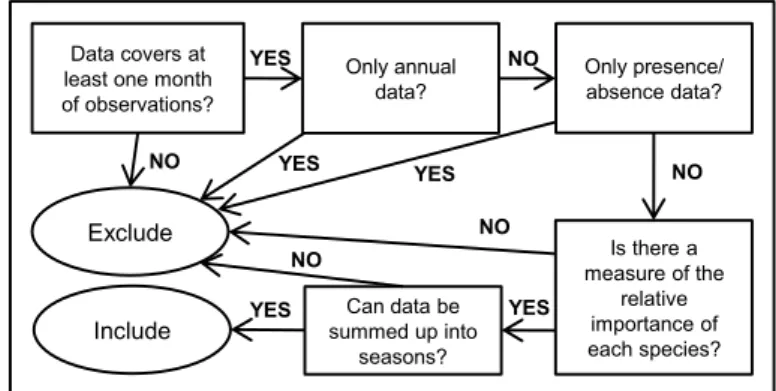
The first step in data collection was to define the basic criteria that any published dataset should fulfil to be included in the exercise, by defining a simple decision tree illustrated in figure 2.2. This step was crucial in order to ensure an acceptable degree of comparability between studies that are likely to differ in their design and goals.
20 50 50 50 10 0 10 0 10 0 100 20 0 20 0 20 0 200 10 0
PO
R
T
U
G
AL
Zone 1 LisbonAtl
antic
Oce
an
Zone 2 Zone 3 Zone 4 Zone 5 Nazaré 8°W 9°W 10°W 11°W 12°W 41°N 40°N 39°N 38°N 37°N 36°N 0 50 100 KmIn order to minimise the introduction of samples from highly impacted assemblages, nearshore sites were given priority when located near or inside protected areas. Moreover, given the unavoidable differences in abundance values between sampling methods and designs and to maximise the available data, relative abundances were calculated for every dataset to conserve the proportion of the assemblages represented by each species or guild. Another important criterion was the possibility to organise data into seasons in order to introduce seasonal variability into the analysis.
For each site and season, data were aggregated into a single data point and were assumed representative of the proportion of species and guilds on that site and season. As a result, by the end of the data collection process, each entry in the database represented the relative proportion of species in an area of the coast in a particular season, delimited by depth ranges. In order to avoid confusion regarding the concept of sample, data points are referred in the text as “datasets”, since they are the result of aggregated samples in a dataset.
Figure 2.2. Decision-tree illustrating the selection criteria for data to include in the exercise.
Most of the data used for soft substrate assemblages along the coast were gathered from technical reports of the trawl surveys performed by the Portuguese Institute for Fisheries and Sea Research (IPIMAR) that are grouped according to pre-defined depth ranges and coastal sections (zones 1 to 5 in figure 2.1). This zonation was indivisible in the published data, however, it is based on hydro-morphological criteria and zones can be roughly corresponded to homogenous fish communities, considering the large spatial scale (Gomes et al., 2001). Therefore, in order to overcome this constraint and standardise latitudinal location across the database, all collected datasets were assigned to these zones.
Concerning sampling procedures on the collected datasets (table 2.1), otter trawl was the
Exclude
Only presence/ absence data?
Include
Data covers at least one month of observations? Is there a measure of the relative importance of each species? Can data be summed up into seasons? Only annual data? YES NO YES YES YES YES NO NO NO NO
to characterise some areas approximately 10−30 m deep (Abreu, 2005) and beach seine fisheries data for some areas shallower than 10 m (Cabral et al., 2003). Beach seine, despite not being intentionally performed with the purpose of surveying fish assemblages, provides rather complete data due to the low selectivity of the fishing gear (Cabral et al., 2003). All rocky reefs were sampled using underwater (SCUBA) visual census methods that varied from timed random paths, to fixed distance transects and stationary observations.
Compiled studies were organised into 69 datasets (table 2.1) and the taxonomy was updated and corrected according to FishBase online database (Froese and Pauly, 2011).
Table 2.1. Summary of the references from which the data were collected. See figure 2.1 for coastal zone
limits.
Reference Sampling years Substrate Latitude zones Seasons sampled Depth range (m) method/gear Sampling datasets Nr. of IPIMAR,1980 1979 S 1, 2, 3, 5 Su 20 - 200 Otter trawl 8 IPIMAR, 1981a 1979 S 1, 2, 3, 4, 5 W 20 - 200 Otter trawl 9 IPIMAR,1981b 1980 S 3, 4, 5 Sp 20 - 200 Otter trawl 6 IPIMAR, 1982 1980 S 1, 2, 3, 4, 5 Su 20 - 200 Otter trawl 10 IPIMAR, 1984 1980 S 1, 2, 3, 4, 5 W 20 - 200 Otter trawl 10 Henriques, 1993 1993 R 3 Sp/Su/A/W 1 - 15 VC random 4 Rodrigues, 1993 1993 R 3 Sp/Su/A/W 10 - 25 VC transect 4 Almeida, 1997 1997 R 5 Su 17 - 25 VC stationary 1 Almada et al., 2002 1999 R 3 Sp/Su/A/W 1 - 20 VC transect 4 Cabral et al., 2003 1999 S 3 Sp/Su/A 0 - 20 Beach seine 3 Prista et al., 2003 2001 S 3 Sp/Su/A/W 10 - 30 Otter trawl 4 Almada et al., 2004 2004 R 3 A 1 - 20 VC transect 1 Gonçalves, 2004 2002 R 4 Su 19 - 23 VC random 2 Abreu, 2005 2005 S 5 Sp 10 - 30 Beam trawl 1 Maranhão et al., 2006 2004-05 R 3 Su 1 - 15 VC random 2
VC- visual census, S- soft, R- rock, Sp- spring, Su- summer, A- autumn, W- winter.
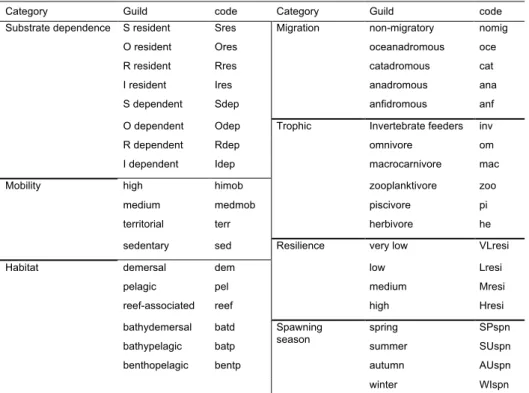
2.2.3. Guild classification
One of the advantages of using fish as ecological indicators is the large variety of ecological guilds, which can respond more predictably to alterations on the ecosystem (Elliott et al., 2007; Halpern and Floeter, 2008). Therefore, not only is there a need for guilds to play an important role in monitoring and assessment tools (de Jonge et al., 2006; Henriques et al., 2008b) but also the baseline characterisation of habitats and assemblages should take into account the distribution of these guilds regardless of individual species. For this reason, all species were incorporated into a total of 37 ecological guilds from seven categories (table 2.2), based on previous work by Henriques