Teleost fish larvae adapt to dietary arachidonic acid supply through
modulation of the expression of lipid metabolism and stress response genes
Dulce Alves Martins
1,2*, Filipa Rocha
1, Gonzalo Martı´nez-Rodrı´guez
2, Gordon Bell
3, Sofia Morais
4,
Filipa Castanheira
1, Narcisa Bandarra
5, Joana Coutinho
5, Manuel Yu´fera
2and Luı´s E. C. Conceic¸a˜o
11Centro de Cieˆncias do Mar do Algarve, Universidade do Algarve, Campus de Gambelas, 8005-139 Faro, Portugal 2Instituto de Ciencias Marinas de Andalucı´a (CSIC), Apartado Oficial E-11510, Puerto Real, Ca´diz, Spain 3Institute of Aquaculture, University of Stirling, Stirling FK9 4LA, Scotland, UK
4IRTA, Centre de Sant Carles de la Ra´pita, Carretera Poble Nou Km 5·5, 43540 Tarragona, Spain
5Instituto Nacional de Recursos Biolo´gicos – Instituto de Investigac¸a˜o das Pescas e do Mar (INRB/IPIMAR), Avenida Brası´lia, 1449-006 Lisboa, Portugal
(Submitted 24 June 2011 – Final revision received 12 October 2011 – Accepted 12 October 2011 – First published online 15 December 2011)
Abstract
Dietary fatty acid supply can affect stress response in fish during early development. Although knowledge on the mechanisms involved in fatty acid regulation of stress tolerance is scarce, it has often been hypothesised that eicosanoid profiles can influence cortisol production. Genomic cortisol actions are mediated by cytosolic receptors which may respond to cellular fatty acid signalling. An experiment was designed to test the effects of feeding gilthead sea-bream larvae with four microdiets, containing graded arachidonic acid (ARA) levels (0·4, 0·8, 1·5 and 3·0 %), on the expression of genes involved in stress response (steroidogenic acute regulatory protein, glucocorticoid receptor and phosphoenolpyruvate carboxykinase), lipid and, particularly, eicosanoid metabolism (hormone-sensitive lipase, PPARa,
phospholipase A2, cyclo-oxygenase-2 and 5-lipoxygenase), as determined by real-time quantitative PCR. Fish fatty acid phenotypes
reflected dietary fatty acid profiles. Growth performance, survival after acute stress and similar whole-body basal cortisol levels suggested that sea-bream larvae could tolerate a wide range of dietary ARA levels. Transcription of all genes analysed was significantly reduced at
dietary ARA levels above 0·4 %. Nonetheless, despite practical suppression of phospholipase A2 transcription, higher leukotriene B4
levels were detected in larvae fed 3·0 % ARA, whereas a similar trend was observed regarding PGE2production. The present study
demon-strates that adaptation to a wide range of dietary ARA levels in gilthead sea-bream larvae involves the modulation of the expression of genes related to eicosanoid synthesis, lipid metabolism and stress response. The roles of ARA, other polyunsaturates and eicosanoids as signals in this process are discussed.
Key words:PUFA: Sparus aurata: Gene expression: Stress
Intensive fish aquaculture can have a negative impact on animal welfare, hence farming practices have been developed with the intention of minimising stress below the threshold of prepatho-logical manifestation, thereby avoiding diseases and mortality(1). Stress resistance has been admitted as an important indicator of a fish’s physiological condition and considered as a target for gen-etic improvement since stress can negatively affect relevant pro-duction traits(2,3). The unavailability of essential nutrients, especially during delicate early life stages, may compromise normal development and survival. In fact, high mortalities (up to 99 % in nature) are considered normal for marine teleost larvae. In the face of a stressor, energetic resources must be
diverted away from growth and other biological processes into a stress-coping response. Therefore, it is important to provide fish larvae with nutrients that optimise their growth and survival, and that satisfy extra energy requirements inherent to intensive production. Dietary lipid, in particular, strongly influences immunity and response to stress associated with handling and suboptimal environmental conditions(4 – 6).
Dietary lipids are a major source of energy and provide essential fatty acids and phospholipids, widely acknowledged as critical success factors for larval fish rearing(7,8). In marine
fish nutrition, major attention has been given to DHA (22 : 6n-3) and EPA (20 : 5n-3) due to their predominance in
* Corresponding author: Dr D. Alves Martins, fax þ 351 289 800 069, email [email protected]
Abbreviations: ARA, arachidonic acid; COX, cyclo-oxygenase; DAH, days after hatch; GR, glucocorticoid receptors; HSL, hormone-sensitive lipase; LA, linoleic acid; LC-PUFA, long-chain PUFA; LNA, linolenic acid; LOX, lipoxygenase; LTB4, leukotriene B4; OA, oleic acid; PEPCK, phosphoenolpyruvate
carboxykinase; StAR, steroidogenic acute regulatory protein.
qThe Authors 2011
British
Journal
of
Nutrition
https://www.cambridge.org/core . Universidade do Algarve , on 12 Mar 2019 at 16:51:47, subject to the Cambridge Core terms of use, available at
https://www.cambridge.org/core/terms
.
fish tissues, particularly in cell membranes, but the potential of arachidonic acid (ARA; 20 : 4n-6) to affect growth, survival and stress resistance has also been recognised(9,10). The dietary requirement for ARA during early larval development in gilt-head sea bream (Sparus aurata) has been linked to survival during the stressful events of metamorphosis, weaning, crowding, grading(11) and other handling procedures(12 – 14).
Various fatty acids and phospholipids have long been demon-strated to present stress resistance conferring properties in fish(15 – 19), although the mechanisms involved are still some-what speculative.
Modulation of cellular membrane structure and/or function, through diet-induced changes in phosphoacylglycerol fatty acids, is probably responsible for major dietary outcomes on fish physiology(7,20), including stress-reducing effects(5). The consequences of dietary supplementation in certain long-chain PUFA (LC-PUFA) on stress tolerance in fish are often suggested to be mediated by eicosanoids, affecting corticoster-oid production(9,13,14,21). Most studies addressing this issue have focused on ARA-derived eicosanoids since these are gen-erally considered the most abundant and bioactive, whereas those produced from EPA tend to be of lower efficacy(22,23). Recent in vitro studies using gilthead sea-bream head kidney cells have clearly demonstrated the participation of cyclo-oxygenase (COX) and lipoxygenase (LOX) metabolites on cortisol release(24,25), as hypothesised in a model proposed for steroidogenesis regulation in mammals(26). The regulation of the steroidogenic acute regulatory protein (StAR), a key rate-limiting enzyme in steroidogenesis, by ARA and its metab-olites has still not been examined in fish. In mammalian research, for example, COX-2 inhibition, or 5-LOX- and epoxygenase-derived ARA metabolites have been reported to enhance StAR gene transcription and steroidogenesis(27 – 29). Furthermore, fatty acids and eicosanoids serve as ligands for nuclear receptors which may affect the transcription of genes involved in lipid and energy homeostasis, including choles-terol metabolism(30,31) which is central in steroidogenesis. Indeed, PPAR have been reported to modulate genes involved in cholesterol uptake and transport(32), including StAR(33),
hence affecting steroid production in mammals(34). Similar interactions between PPAR and StAR have recently been impli-cated in Atlantic salmon (Salmo salar)(35).
Cortisol release from the interrenal cells may be affected by the relative abundance of fatty acids through other pathways, such as Ca messenger systems(26). Enhancement of intracellu-lar calcium levels by ARA or its metabolites, including leuko-triene B4 (LTB4)(36 – 39), could play an additional role in
steroidogenesis regulation.
Within target cells, cortisol signalling entails the activation of glucocorticoid receptors (GR), their translocation into the nucleus and binding to the promoter of glucocorticoid respon-sive genes, hence modulating their expression(40). In fish, the existence of non-genomic pathways involving membrane-bound proteins is still unclear(41,42). A study in sea-bream larvae showed that GR mRNA abundance could be affected by dietary lecithin source(43). Also, in vitro studies in fish(44)and mammals(45,46) have shown dose-dependent suppression of GR binding by unsaturated fatty acids, a mechanism possibly
mediated in vivo by fatty acid binding proteins(47). Despite the common use of cortisol as a stress indicator, GR are recognised to mediate actual physiological effects of this hormone. Hence, studying the potential of dietary fatty acids to modulate these receptors is likely to provide clues as to how lipid nutrition could affect the stress response in fish larvae.
The objective of the present study was to advance our knowledge on the role of dietary fatty acids in regulating meta-bolic pathways involved in stress response in fish. Specifically, we have examined potential effects of dietary ARA levels on cor-tisol production and the expression of genes related to the stress response in gilthead sea-bream larvae. These included StAR, GR, PPARa and eicosanoid synthesis enzymes. The transcription of hormone-sensitive lipase (HSL), possibly regulated by GR(48,49), and phosphoenolpyruvate carboxykinase (PEPCK) was also analysed. The production of ARA-derived eicosanoids (PGE2 and LTB4) was determined, and overall results were
examined in light of larval fatty acid phenotypes.
Experimental methods Larval rearing
Animal manipulations were carried out in compliance with the Guidelines of the European Union Council (86/609/EU) and Portuguese legislation for the use of laboratory animals. Proto-cols were performed under license of Group-1 from the Gen-eral Directorate of Veterinary (Ministry of Agriculture, Rural Development and Fisheries, Portugal).
Gilthead sea-bream eggs were obtained from INRB/IPIMAR EPPO facility (Olha˜o, Portugal) and the experiment was con-ducted at the Centre of Marine Sciences (University of Algarve, Faro, Portugal). The larvae were distributed into twelve cylin-dro-conical tanks (100 litres), at a density of 100 larvae per litre. This tank system was supplied with constantly aerated seawater (18·4 ^ 0·68C, salinity about 35·6 and dissolved oxygen about 6 mg/l), kept under a photoperiod of 14 h light – 10 h dark until 16 days after hatch (DAH) and constant lighting conditions from thereon. Tank water renewal was 0·5 times daily initially and increased up to eight times per d throughout the course of the experiment. During this period, the green water technique was applied to the rearing tanks with the addition of Tetraselmis suecica (clone chuii) and Isochrysis galbana. From 4 DAH, the larvae were fed roti-fers (Brachionus plicatilis) previously enriched with a com-mercial product (Easy DHA Selco; INVE Aquaculture), and gradual replacement with the experimental microdiets occurred from 9 to 25 DAH, after which the larvae were fed exclusively on the microdiets. However, from 15 DAH, the amount of rotifers supplied was nutritionally negligible (about 1 rotifer per ml) in order to stimulate larval feeding behaviour. Monitoring of water quality, tank maintenance and removal of mortalities were performed daily.
Experimental diets
For the experiment, four microdiets were manufactured
according to the method of microencapsulation by
Fatty acids affect fish gene expression 865
British
Journal
of
Nutrition
https://www.cambridge.org/core . Universidade do Algarve , on 12 Mar 2019 at 16:51:47, subject to the Cambridge Core terms of use, available at
https://www.cambridge.org/core/terms
.
emulsification and internal gelation(50) and presented graded ARA levels ranging from 3·7 to 30·0 g/kg feed. These doses were selected in order to vary from a relatively low ARA level commonly found in larval microdiets to a level suffi-ciently high as to lower the dietary EPA:ARA ratio below 1. This was expected to highlight potential effects of ARA abun-dance in the tissues on the expression of genes and other parameters studied. Dietary formulations are presented in Table 1. Sieving allowed the separation of the microdiets into two size classes to be used according to larval size: 80 – 200 mm and 200 – 400 mm.
Experimental design and sampling procedures
The beginning of this experiment was considered to be at 16 DAH, when about 75 % of the larvae were estimated to accept the microdiets, through the microscopic observation of gut content. The photoperiod was then changed to continuous lighting conditions and rotifer supply reduced considerably. The microdiets were tested in triplicate and distributed by automatic feeders (Fishmate; PETMATE) five times per d from 9 to 16 DAH, and eight times per d (every 3 h) from 16 until 34 DAH.
At the end of the experiment, thirty larvae per tank were subjected to an acute stress consisting of 1 min gentle stirring, in a 1 litre beaker, and left to recover for 24 h at the end of which mortalities were recorded and live larvae sampled for whole-body cortisol determination. Cortisol levels were deter-mined under basal conditions and at 24 h post-stress only, due to the shortage of larvae at the end of the experiment and the large number of fish required for other biochemical analyses. The 24 h period was selected in order to evaluate also stress resistance (survival) 1 d after acute stress.
Initial average dry weight (16 DAH) was determined from pooled samples (200 larvae per tank), which were stored at 2208C until measurements could be conducted. At the final sampling, fifty larvae per tank were collected for individual dry-weight assessment, and about 100 per tank were stored at 2 808C for lipid and fatty acid composition analysis. Whole-body cortisol concentration was assessed, before (n 15) and 24 h after stress (n 15), in pooled larvae samples which were kept at 2 808C until analyses could be conducted. Furthermore, fifty larvae per tank were sampled for whole-body eicosanoid determination and stored in Hanks’ balanced salt solution (Sigma), containing 15 % ethanol (v/v) and 5 % formic acid (2M), at 2 208C. Finally, for gene expression anal-ysis, ten larvae per tank were preserved in RNAlater at 48C for 24 h and then at 2208C. All larvae sampled were previously anaesthetised with an overdose of 2-phenoxyethanol and washed with distilled water before storage or measurements, with the exception of those intended for gene expression anal-ysis, which were stored directly in RNAlater.
Analytical methods
The microdiets were analysed for proximate composition according to the following procedures: DM determined gravi-metrically by drying in an oven at 1058C for 24 h; crude ash by
incineration in a muffle furnace at 5008C for 12 h; crude protein (N £ 6·25) assessed by a N determinator (LECO, FP-528); total lipid extracted with petroleum diethyl ether (Soxhlet 40 – 608C); gross energy in an adiabatic bomb calori-meter (IKA C2000). For fatty acid composition analyses of the microdiets and larvae, acid-catalysed transesterification(51) was performed, to produce fatty acid methyl esters which were measured and quantified by GC in a Varian Star 3800
Table 1. Formulation and proximate composition of the experimental microencapsulated diets, prepared by internal gelation, for gilthead sea-bream larvae
Diets
ARA0·4 ARA0·8 ARA1·5 ARA3·0 Ingredients (g/kg) Fishmeal* 50·0 50·0 50·0 50·0 Fish hydrolysate† 100·0 100·0 100·0 100·0 Cuttlefish meal‡ 420·0 420·0 420·0 420·0 Casein§ 50·0 50·0 50·0 50·0 Sodium alginatek 70·0 70·0 70·0 70·0 Dextrin{ 13·0 9·0 7·0 4·0 Soyabean lecithin** 50·0 50·0 50·0 50·0 Linseed oil†† 35·0 30·0 30·0 -Sunflower oil‡‡ 34·0 30·0 10·0 -Olive oil§§ 20·0 20·0 20·0 20·0 ARASCOkk 7·0 21·0 44·0 88·0 DHASCO{{ 40·0 40·0 40·0 40·0 Incromega*** 31·0 30·0 29·0 28·0 Vitamin premix††† 20·0 20·0 20·0 20·0 Vitamin C‡‡‡ 30·0 30·0 30·0 30·0 Vitamin E§§§ 10·0 10·0 10·0 10·0 Mineral premixkkk 20·0 20·0 20·0 20·0 Proximate composition DM (%) 97·4 96·8 96·9 97·1 Protein (% DM) 58·0 59·5 59·5 57·9 Lipid (% DM) 27·3 25·0 25·4 27·3 Ash (% DM) 3·8 3·5 4·0 3·7 Carbohydrates (% DM){{{ 10·9 11·9 11·1 11·0 Energy (kJ/g DM) 25·4 25·1 25·2 25·8
* AgloNorse Microfeed (Norsildmel Innovation AS). † CPSP-90 (Sopropeche).
‡ Squid Powder 0278 (Rieber & Søn ASA). § VWR International.
k MP Biomedicals 154724.
{ Commercial grade type I (MP Biomedicals). ** Lecithin Soy Refined (MP Biomedicals).
†† Commercial linseed oil (Biolasi Productos Naturales, S.L.). ‡‡ Commercial sunflower oil (Ibarrasol, Aceites Ybarra S.A.). §§ Commercial olive oil (Hacendado, Sovena Iberica de Aceites S.A.).
kk Vegetable oil from fungi, approximately 40 % ARA, Martek life enriched TM (Martek Biosciences Corporation).
{{ Vegetable oil from microalgae, approximately 40 % DHA, Martek life enriched TM (Martek Biosciences Corporation).
*** Incromega TG7010 SR (Croda Europe Limited).
††† Vitamin premix supplied the following (per kg of diet): retinol – cholecalciferol 500:100, 1000 mg; cholecalciferol 500, 40 mg; a-tocopherol acetate, 3000 mg; menadione 23 %, 220 mg; thiamin HCl, 50 mg; riboflavin 80, 250 mg;D-calcium pantothenic acid, 1100 mg; nicotinamide, 500 mg; pyridoxine, 150 mg; pteroylglu-tamic acid, 50 mg; cyanocobalamin 0·1, 500 mg; biotin 20, 38 mg; ascorbic acid polyphosphate 35 %, 57·2 g; choline chloride 60 %, 100 g; myo-inositol, 15 g; anti-oxidants, 1·25 %.
‡‡‡ Sodium, calcium ascorbyl-2-phosphate, Rovimix STAY-C 35 (DSM Nutritional Products, Inc.)
§§§DL-a-Tocopherol acetate (MP Biomedicals 100555).
kkk Mineral premix supplied the following (per kg of diet): monocalcium phosphate, 35·2 %; calcium carbonate, 11·5 %; NaCl, 20 %; potassium chloride, 26 %; copper sulphate, 0·024 %; magnesium sulphate, 5 %; ferrous sulphate, 0·6 %; manganous sulphate, 0·81 %; zinc sulphate, 0·17 %; potassium iodide, 0·0031 %; sodium selenite, 0·6 %.
{{{ Carbohydrates ¼ 100 2 (protein þ lipid þ ash).
British
Journal
of
Nutrition
https://www.cambridge.org/core . Universidade do Algarve , on 12 Mar 2019 at 16:51:47, subject to the Cambridge Core terms of use, available at
https://www.cambridge.org/core/terms
.
CP equipped with an auto-sampler and fitted with a flame ion-isation detector at 2508C. The separation was performed in a polyethylene glycol capillary column DB-WAX 30 m in length, 0·25 mm in inner diameter and 0·25 mm in film thick-ness from J&W Scientific. The column was subjected to a tem-perature programme starting at 1808C for 5 min, increasing by 48C/min for 10 min and held at 2208C for 25 min. The injector (split ratio 100:1) and detector temperatures were kept con-stant at 2508C during the 40 min analysis. Fatty acid peaks were identified by directly comparing retention times with those of a known standard (‘PUFA 3’; Sigma-Aldrichw
) and quantified by means of the response factor to an internal stan-dard (21 : 0) which was used at 5 ml/mg sample.
Survival at the end of the experiment and at 24 h post-stress was determined by direct counting of individuals, relative to the initially stocked number of larvae, and excluding the 200 individuals sampled at 16 DAH. Individual determination of whole-body dry weight was performed in a Sartorius M5P balance (0·001 mg precision; Sartorius micro) after freeze-drying the samples for 24 h in a Savant SS31 (Savant Instru-ments, Inc.).
Whole-body cortisol was determined in pooled larvae samples of about 150 – 300 mg per tank (wet weight), according to methodology which has been described previously(43), and using a commercial cortisol ELISA kit (Neogen Corporation).
For the determination of whole-body eicosanoid concen-tration, samples were homogenised in the storage solution and centrifuged to remove debris. The supernatants were extracted using octadecyl silyl (C18) ‘Sep-Pak’ cartridges
(Millipore), as described in detail by Bell et al.(52). The extracts were dried under N2, redissolved in 1 ml of methanol and
stored in glass vials at 2 208C until immunoassay analysis. Upon sample preparation for analysis, 500 ml of the methanol extracts were dried under N2, redissolved in 2 ml enzyme
immu-noassay (EIA) buffer and loaded onto the plate contained in the assay kit. Eicosanoids were quantified using enzyme immu-noassay kits, namely PGE2EIA kit (Cayman, ref. 514010) and
LTB4EIA kit (Cayman, ref. 520111), according to the
manufac-turer’s instructions.
Total RNA from individual fish larvae (average weight 1·5 mg) was extracted using the QIAGEN RNeasyw
Plus Mini Kit designed to purify RNA from small amounts of animal tis-sues (maximum 30 mg), allowing yields of up to 100 mg total RNA. Total body tissue was disrupted and homogenised using a rotor – stator homogeniser Ultra Turrax T8 (IKAw
-Werke) and RTL plus buffer. The lysate was passed through a genomic DNA eliminator spin column to remove all genomic DNA contamination. The sample was transferred into an RNeasy spin column where total RNA bonded to a membrane and contaminants were washed away. Purified RNA was then eluted with 30 ml of RNase-free water. The quality and quantity of the RNA were assessed using the Bioanalyzer 2100 (Agilent Biosystem) and the RNA 6000 Nano kit, accurate to a qualitat-ive range of 5 – 500 ng/ml. A nanochip carried up to twelve RNA samples of 1 ml each. Through electrophoresis analysis of RNA with nanochips, two peaks were detected in well-preserved samples (RNA fragments 18S and 28S). After detec-tion, the ratio of the fragment areas and the RNA integrity
number were calculated. RNA was quantified spectrophoto-metrically at 260 nm using the Eppendorf Biophotometer Plus and plastic Eppendorf UVettesw
RNase free. The analysis was performed with 5 ml per sample, diluted with 50 ml of DEPC water and the correction factor automatically calculated. Complementary DNA were synthesised from 500 ng of total RNA using the qScript-cDNA synthesis kit (Quanta BioscienceTM), according to the manufacturer’s instructions, in a Mastercyclerw
VapoProtec (Eppendorf, ProS).
Gene expression was analysed by real-time quantitative PCR using the Mastercyclerw
ep Realplex2 S system (Eppen-dorf) and the procedure provided by the PerfeCTa SYBR Green kit (Quanta). Sea-bream specific primers were used, with b-actin as the normalisation gene, in a final volume of 20 ml per reaction well, using 12 ng of total RNA reverse tran-scribed to complementary DNA. The amount of complemen-tary DNA per reaction was established after a priori optimisation tests, considering the efficiency of the amplifica-tion process and the regression fit to six serial 10-fold diluamplifica-tions of complementary DNA. Moreover, each primer-pair anneal-ing temperature and concentration were established in advance using the temperature gradient function of the ther-mocycler. Each gene sample was analysed in triplicate. The PCR conditions were as follows: 958C for 5 min followed by forty cycles of 958C for 15 s and 608C for 30 s, and a final dena-turing step from 608 to 958C during 20 min to check for primer-dimers and spurious amplification products. The DDCt
method(53) was used to determine the relative mRNA
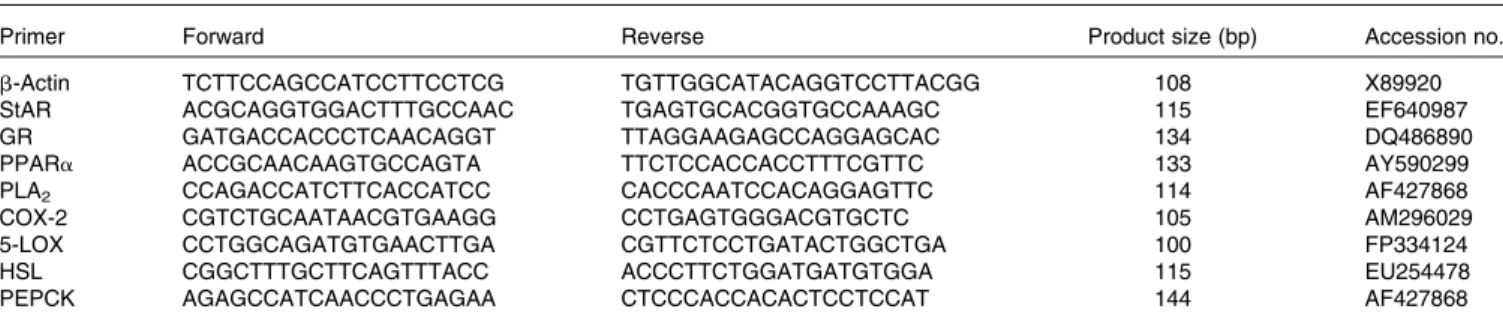
expression levels. For gilthead sea-bream specific primer design, nucleotide and EST GenBank databases were searched for the following genes: PLA2, COX-2, 5-LOX, StAR, GR,
PPARa, PEPCK and HSL. Oligonucleotides were designed using the Primer3 program, and ordered HPLC-purified. Primer sequences and accession numbers for the mRNA analysed are described in Table 2.
Statistical analysis
Larval growth expressed as relative growth rate was deter-mined at the end of the experiment for all treatment groups, according to the following equation(54): relative growth rate ¼ (eg21) £ 100, where g ¼ ((ln final weight 2 ln initial weight)/time)). A one-way ANOVA was used, with dietary treatment as the independent variable, for the statistical anal-ysis of growth performance, whole-body fatty acid compo-sition, eicosanoid and gene expression data. For the data not presenting variance homogeneity and normal distribution, the Kruskal – Wallis and Dunnett tests were performed. Corti-sol data were analysed by a 2 £ 2 mixed-design ANOVA to assess the effect of diet (between-subject variable) and sampling time (within-subject variable, i.e. differences between the basal values and levels detected 24 h post-stress). Differences were considered significant when P, 0·05. Tukey’s honestly significant difference (HSD) mul-tiple mean comparison test was used to identify differences between the means. The relationships between fatty acid concentrations in the diet and in fish can differ among the fatty acids. Hence, Pearson’s correlation coefficients and
Fatty acids affect fish gene expression 867
British
Journal
of
Nutrition
https://www.cambridge.org/core . Universidade do Algarve , on 12 Mar 2019 at 16:51:47, subject to the Cambridge Core terms of use, available at
https://www.cambridge.org/core/terms
.
differences (D values) between the percentages of selected fatty acids in larval lipids and in dietary lipids were calculated (% total fatty acids). Pearson’s coefficients were also used to explore correlations between cortisol levels and the fatty acid content of the larvae. All statistical tests were conducted with the software package SPSSw
16.0 for Windowsw
.
Results
The proximate composition of the microdiets showed crude protein levels of 58 – 60 %, crude lipid content between 25 and 27 %, and gross energy about 25 kJ/g DM (Table 1). Diet-ary fatty acid composition is presented in Table 3. Total fatty acid content analysis showed values between 171 and 182 mg/g diet. Saturates represented 3·4 – 4·0 % of the diet, whereas MUFA were about 4·3 – 4·5 %, mainly oleic acid (18 : 1n-9). PUFA content ranged from 9·3 to 10·2 %. Among polyunsaturates, ARA increased from 0·4 (ARA0·4) to 3·0 % (ARA3·0), whereas linoleic (LA; 18 : 2n-6) and linolenic (LNA; 18 : 3n-3) acid concentrations decreased with ARA addition. However, EPA and DHA levels were relatively constant between the dietary treatments. Thus, dietary EPA:ARA and DHA:ARA ratios were lowered with increasing dietary ARA inclusion, whereas the DHA:EPA ratio was maintained practi-cally identical between the diets.
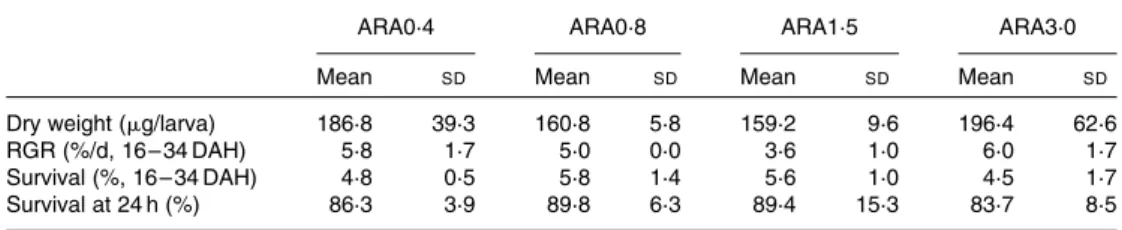
Sea-bream initial dry weight was 71·3 (SD 10·6) mg/larva and, despite slightly lower relative growth rates in the mid-range treatments at the end of the experiment, no significant differences were observed in growth parameters or survival between the dietary groups (Table 4). Overall, relative growth rate values were approximately 3·6 – 6·0 % per d, whereas survival was determined between 4·5 and 5·8 %. At 24 h after acute stress, this parameter varied between 84 and 90 % without statistically significant differences between the experimental groups.
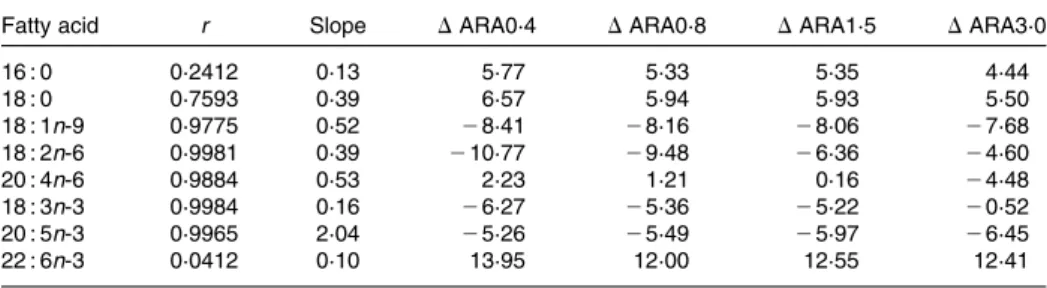
Whole-body fatty acid composition reflected dietary pro-files, particularly regarding ARA, which increased from 4·2 % total fatty acids in the ARA0·4 groups to 11·6 % in ARA3·0 fed larvae (Table 5). Pearson’s correlation coefficient for ARA was 0·99 and D values indicated its preferential retention up to 1·5 % dietary content, whereas at the highest dietary concentration tested, D values pointed to its preferential metabolism (Table 6). The DHA content of the sea bream was high (26·8 – 28·6 %) and D values suggested strong
preferential deposition of this fatty acid in fish tissues. On the other hand, despite relatively similar EPA concentrations among the experimental microdiets, larval levels were signifi-cantly reduced in the groups fed the ARA1·5 and ARA3·0 diets. The relationship between larval contents in ARA and EPA was also analysed and Pearson’s correlation coefficient (2 0·997) indicated a strong negative correlation between the two fatty acids in the tissues (Fig. 1). Furthermore, unlike ARA or DHA, EPA appeared to be preferentially metabolised in all experimental groups, and more so as ARA levels increased in the larvae, as suggested by D values. Regarding the EPA:ARA and DHA:ARA ratios, a significant decrease was noted as ARA deposition increased in the larvae. In particular, the EPA:ARA ratio was only above 1·0 in the group supplied with the lowest ARA levels. The DHA:EPA ratio was highest in the ARA3·0-fed groups. Other polyunsaturates, LA and LNA, decreased significantly, reflecting dietary differences, and seemed to be preferentially metabolised by the larvae as well as oleic acid. No statistically significant differences regarding SFA and MUFA were identified between the
Table 2. Sequences of forward and reverse primers (50– 30) for real-time quantitative-PCR of sea-bream genes and amplification product size
Primer Forward Reverse Product size (bp) Accession no.
b-Actin TCTTCCAGCCATCCTTCCTCG TGTTGGCATACAGGTCCTTACGG 108 X89920
StAR ACGCAGGTGGACTTTGCCAAC TGAGTGCACGGTGCCAAAGC 115 EF640987
GR GATGACCACCCTCAACAGGT TTAGGAAGAGCCAGGAGCAC 134 DQ486890
PPARa ACCGCAACAAGTGCCAGTA TTCTCCACCACCTTTCGTTC 133 AY590299
PLA2 CCAGACCATCTTCACCATCC CACCCAATCCACAGGAGTTC 114 AF427868
COX-2 CGTCTGCAATAACGTGAAGG CCTGAGTGGGACGTGCTC 105 AM296029
5-LOX CCTGGCAGATGTGAACTTGA CGTTCTCCTGATACTGGCTGA 100 FP334124
HSL CGGCTTTGCTTCAGTTTACC ACCCTTCTGGATGATGTGGA 115 EU254478
PEPCK AGAGCCATCAACCCTGAGAA CTCCCACCACACTCCTCCAT 144 AF427868
StAR, steroidogenic acute regulatory protein; GR, glucocorticoid receptor; PLA2, phospholipase A2; COX-2, cyclo-oxygenase-2; 5-LOX, 5-lipoxygenase; HSL,
hormone-sensitive lipase; PEPCK, phosphoenolpyruvate carboxykinase.
Table 3. Total fatty acid content (mg/g diet DM) and fatty acid compo-sition (g/100 g diet DM) of the experimental diets
Diets
ARA0·4 ARA0·8 ARA1·5 ARA3·0
Total FAME 182·2 171·7 171·3 179·3 Fatty acid 16 : 0 2·2 2·0 2·1 2·4 18 : 0 0·6 0·6 0·7 0·9 SFA 3·5 3·4 3·5 4·0 16 : 1n-7 0·1 0·1 0·1 0·1 18 : 1* 4·2 3·9 4·0 4·0 20 : 1n-9 0·2 0·2 0·2 0·2 MUFA 4·5 4·3 4·3 4·3 18 : 2n-6 3·4 2·8 1·9 1·5 20 : 4n-6 0·4 0·8 1·5 3·0 n-6 PUFA 3·8 3·6 3·6 4·7 18 : 3n-3 1·4 1·1 1·1 0·1 20 : 5n-3 2·0 1·9 1·8 1·8 22 : 6n-3 2·7 2·6 2·6 2·8 n-3 PUFA 6·3 5·9 5·7 4·8 PUFA 10·2 9·5 9·3 9·6 DHA:EPA 1·3 1·4 1·4 1·5 EPA:ARA 5·4 2·5 1·2 0·6 DHA:ARA 7·3 3·5 1·7 0·9
ARA, arachidonic acid; FAME, fatty acid methyl esters. * Includes 18 : 1n-7 and 18 : 1n-9.
British
Journal
of
Nutrition
https://www.cambridge.org/core . Universidade do Algarve , on 12 Mar 2019 at 16:51:47, subject to the Cambridge Core terms of use, available at
https://www.cambridge.org/core/terms
.
groups. Finally, palmitic (16 : 0) and stearic acids (18 : 0) were preferentially retained in the larval tissues in all exper-imental groups and their respective Pearson’s correlation coefficients were relatively low.
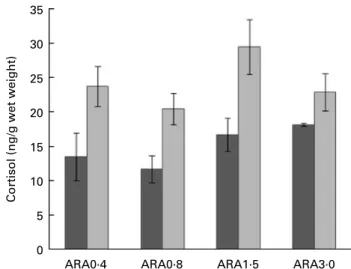
Whole-body basal cortisol levels (Fig. 2) ranged between 12 and 18 ng/g larvae wet weight, and levels at 24 h post-stress were between 20 and 30 ng/g. No statistical interaction was found between diet and sampling time (P¼ 0·70). Overall, cor-tisol values did not differ between the experimental groups (P¼ 0·12) but significantly higher levels were found at 24 h post-stress than before stress (P¼ 0·005).
Whole-body PGE2measurements did not show significant
differences between the treatments (P¼ 0·21), whereas the highest LTB4levels were determined in sea-bream larvae fed
the ARA3·0 diet (P¼ 0·04; Fig. 3).
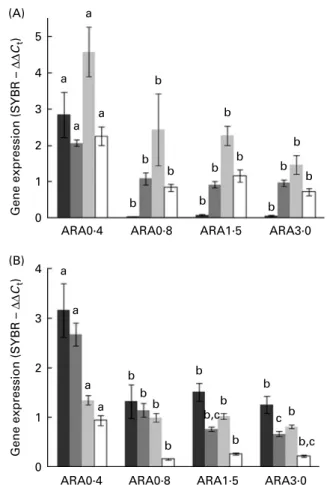
All genes studied showed significant differences in expression among the dietary treatments (Fig. 4). Above the lowest dietary ARA level tested (0·4 %), the transcription of the eight analysed genes was significantly depressed. In par-ticular, a drastically reduced expression of PLA2was observed,
whereas other enzymes involved in eicosanoid synthesis (5-LOX and COX-2) showed decreased mRNA levels to only about half in the groups fed 0·8 % ARA and above. PPARa mRNA abundance was also highest in the lowest ARA-fed groups. The StAR gene, encoding for the rate-limiting enzyme in steroidogenesis, presented a similar trend. On the other hand, GR gene expression appeared to be gradually reduced as dietary ARA supply increased. HSL transcript levels were only slightly higher in ARA0·4-fed larvae when compared with the other groups, while PEPCK gene
Table 4. Growth performance* and survival at 24 h after stress of sea-bream larvae fed the experimental diets containing graded arachidonic acid (ARA) levels
(Mean values and standard deviations)
ARA0·4 ARA0·8 ARA1·5 ARA3·0
Mean SD Mean SD Mean SD Mean SD
Dry weight (mg/larva) 186·8 39·3 160·8 5·8 159·2 9·6 196·4 62·6
RGR (%/d, 16 – 34 DAH) 5·8 1·7 5·0 0·0 3·6 1·0 6·0 1·7
Survival (%, 16 – 34 DAH) 4·8 0·5 5·8 1·4 5·6 1·0 4·5 1·7
Survival at 24 h (%) 86·3 3·9 89·8 6·3 89·4 15·3 83·7 8·5
RGR, relative growth rate.
* Initial dry weight, 71·3 (SD10·6) mg/larva.
Table 5. Whole-body total fatty acid content (mg/g sample) and profile (g/100 g total fatty acids) of sea-bream larvae fed diets containing graded arachidonic acid (ARA) levels
(Mean values and standard deviations)
ARA0·4 ARA0·8 ARA1·5 ARA3·0
Mean SD Mean SD Mean SD Mean SD
Total FAME 71·1 1·3 70·3 12·8 71·1 2·0 65·3 2·0 Fatty acid 14 : 0 0·9 0·0 0·9 0·1 0·8 0·0 0·8 0·1 16 : 0 17·8 0·9 17·0 1·4 17·4 0·4 17·4 0·4 18 : 0 10·1 0·3 9·6 0·4 10·1 0·2 10·4 0·5 SFA 30·1 1·0 29·3 1·5 29·9 0·5 30·2 0·9 16 : 1n-9 1·0 0·3 1·5 0·6 1·1 0·3 1·1 0·4 18 : 1n-9 13·3 0·1 13·4 0·4 13·2 0·1 12·7 0·3 20 : 1n-9 0·8 0·0 0·8 0·0 0·8 0·0 0·8 0·0 MUFA 17·1 0·5 18·3 1·8 17·0 0·7 16·5 1·1 18 : 2n-6 7·5a 0·0 6·3b 0·3 4·6c 0·2 3·4d 0·2 20 : 4n-6 4·2a 0·2 5·5a 0·8 8·7b 0·7 11·6c 1·2 n-6 PUFA 12·4a 0·1 12·9a 1·2 14·4a,b 0·6 16·2b 0·7 18 : 3n-3 1·3a 0·0 1·1a,b 0·0 1·0b 0·1 0·2c 0·1 18 : 4n-3 0·3a 0·1 0·3a 0·0 0·4a,b 0·0 0·5b 0·1 20 : 4n-3 0·4 0·1 0·4 0·1 0·4 0·1 0·4 0·1 20 : 5n-3 5·7a 0·1 5·2a 0·2 4·2b 0·1 3·4b 0·4 22 : 6n-3 28·6 1·0 27·1 0·9 27·2 0·4 26·8 0·9 n-3 PUFA 37·7a 0·8 35·6b 0·5 34·7b 0·4 32·7c 0·3 PUFA 50·4 0·7 48·7 1·7 49·4 1·0 49·2 1·0
n-3 PUFA:n-6 PUFA 3·0a 0·1 2·8a,b 0·2 2·4b 0·1 2·0c 0·1
DHA:EPA 5·0a 0·1 5·2a 0·2 6·5a,b 0·0 7·9b 0·1
EPA:ARA 1·4a 0·2 1·0b 0·4 0·5c 0·1 0·3c 1·2
DHA:ARA 6·7a 0·1 5·0b 0·6 3·1c 0·2 2·3c 0·2
FAME, fatty acid methyl esters.
a,b,c,dMean values within a row with unlike superscript letters were statistically significantly different (P, 0·05; ANOVA).
Fatty acids affect fish gene expression 869
British
Journal
of
Nutrition
https://www.cambridge.org/core . Universidade do Algarve , on 12 Mar 2019 at 16:51:47, subject to the Cambridge Core terms of use, available at
https://www.cambridge.org/core/terms
.
expression was up to 6-fold higher in ARA0·4-fed fish than in the other experimental groups.
Discussion
The present study clearly shows that gilthead sea-bream larvae can tolerate a wide range of dietary ARA levels, as neither growth rates nor survival presented significant differences between the experimental groups. Variation in responses obtained for other analysed parameters (eicosanoid levels and gene expression) did not appear to compromise the gen-eral growth performance of the fish for the duration of the experiment, and could be regarded as adaptive to the nutri-tional conditions tested. Relatively low survival was registered between 16 and 34 DAH, which may well relate to the stress of weaning (performed at an early life stage) combined with the fairly small tank volumes used in the rearing system. Still, the survivals observed are within the normal range for the species, despite higher values which have been reported when micro-diets were offered at a later stage(43,55). Relative growth rates may have reflected the same type of constraints, as higher values have been reported for sea-bream larvae fed casein-based microencapsulated diets(56). Nonetheless, sea-bream larvae more than doubled their initial weight during the exper-imental period and their fatty acid profiles clearly reflected the dietary fatty acid composition at the end of the study.
Besides the increase in ARA content in larval tissues from the ARA0·4 to ARA3·0 groups, it is also important to note reduced LA and LNA deposition which mirrored dietary pro-files. In contrast, EPA content in ARA3·0-fed fish was about 60 % that determined for ARA0·4 larvae, despite similar dietary supply levels. This reduction in EPA concomitant with increased ARA levels in larval tissues is a clear indication of competition between these fatty acids for inclusion into fish tissues by acyltransferases as reported in this(14) and other
species(57). The suggested displacement of EPA by increasing ARA competition is in accordance with results obtained from comparisons between dietary and larval fatty acid profiles (% total fatty acids, see Table 6), which indicated preferential EPA metabolism, especially with the increase in dietary ARA. In fact, whereas the EPA:ARA ratio was below 1·0 only in the ARA3·0 diet, in larval whole body, the same ratio was found to be equal to or lower than 1·0 in all groups receiving
dietary ARA levels above 0·4 %. The EPA:ARA ratio is of par-ticular interest since it is a major determinant of eicosanoid production and bioactivity.
An important shift in eicosanoid profiles can affect various metabolic pathways, including the stress response, as often proposed in fish(13,14,21,58). LTB
4, an eicosanoid known for
its pro-inflammatory properties(23), showed a clear increase in groups supplied with the highest dietary ARA levels. On the other hand, only such a trend could be identified regard-ing PGE2. Preferential ARA metabolism was in fact suggested
by comparison between dietary and larval fatty acid profiles (% total fatty acids). Nonetheless, genes related to eicosanoid production showed the highest expression in ARA0·4-fed fish, in particular PLA2. However, it is well known that PLA2is not
strictly required for ARA release from cellular stores since other enzymes, such as acyl-CoA synthetase 4 and acyl-CoA-thioesterase, may undertake this role(59). Despite a nearly complete suppression of PLA2gene expression and the
signifi-cant down-regulation of COX-2 and 5-LOX genes, high dietary ARA supply (3 %) or low EPA:ARA ratios in larval whole body (0·3) caused significantly higher LTB4production. It is possible
that reduced transcription of these genes was an adaptation, as a result of a negative feedback mechanism, to a transient increase in ARA-derived eicosanoids in groups supplied with dietary EPA:ARA ratios , 2·5, in order to maintain these metabolites within ‘normal’ physiological concentrations.
6·0 ARA0·4 ARA0·8 ARA1·5 ARA3·0 5·0 4·0 3·0 3·0 5·0 7·0 9·0 11·0 13·0 20: 4n– 6 (ARA; % TFA) 20: 5 n – 3 (EP A; % TF A)
Fig. 1. Correlation between EPA and arachidonic acid (ARA) levels (% total fatty acids (TFA)) in the whole body of sea-bream larvae fed diets containing graded ARA levels. y ¼ 2 0·3074x þ 6·9357; R20·9936.
Table 6. Pearson’s correlation coefficients (r) and slopes of linear regressions between selected fatty acid content in the microdiets and larvae, and differences (D) between fatty acid levels in larvae and in the corresponding experimental diets (% total fatty acids)*
Fatty acid r Slope DARA0·4 DARA0·8 DARA1·5 DARA3·0
16 : 0 0·2412 0·13 5·77 5·33 5·35 4·44 18 : 0 0·7593 0·39 6·57 5·94 5·93 5·50 18 : 1n-9 0·9775 0·52 28·41 28·16 28·06 27·68 18 : 2n-6 0·9981 0·39 210·77 29·48 26·36 24·60 20 : 4n-6 0·9884 0·53 2·23 1·21 0·16 24·48 18 : 3n-3 0·9984 0·16 26·27 25·36 25·22 20·52 20 : 5n-3 0·9965 2·04 25·26 25·49 25·97 26·45 22 : 6n-3 0·0412 0·10 13·95 12·00 12·55 12·41
* Negative values indicate lower fatty acid percentage in larval tissue total lipid than in dietary lipid (preferential metab-olism), whereas positive values indicate accumulation in the larvae relative to the diet (preferential retention).
British
Journal
of
Nutrition
https://www.cambridge.org/core . Universidade do Algarve , on 12 Mar 2019 at 16:51:47, subject to the Cambridge Core terms of use, available at
https://www.cambridge.org/core/terms
.
A study in 28 DAH sea-bream larvae showed cortisol peaks about 20 – 40 min past a similar type of stress(14). All groups
seemed to be able to cope with the acute stress imposed, as survival past 24 h was 84 – 90 %, overall, and cortisol levels did not differ significantly between groups at this time. Together, these data suggest that larval resistance to the stress test was not affected by the diets, which further support the idea that sea-bream larvae could adapt to changes induced by different fatty acid levels. Various studies in sea-bream larvae have reported positive effects of ARA on growth, survi-val(9) or stress resistance(12,14), although results may depend
much on the nature of the stressor applied, larval
stage(13,14), feed type, rearing conditions, genetic factors, as well as on the relative abundance of other fatty acids (n-3 LC-PUFA). Hence, a direct comparison between studies con-ducted in different laboratories may be difficult. For instance, an effect of EPA supply has been reported previously in sea-bream larvae survival to air exposure and temperature shock(60), whereas the present results showed no trend in stress resistance despite the reduction in larval EPA as ARA increased. However, the maintenance of elevated DHA levels in all groups (27 – 29 % total fatty acids) compared with previously cited studies could have masked effects potentially induced by ARA or other fatty acids on stress resist-ance. Studies in the larvae of other marine fish species also support the superior role of DHA as an essential fatty acid rela-tive to EPA and ARA in terms of growth and resistance to a vitality test(61,62). In the face of a stressor, efficient ATP
pro-duction is required to satisfy the extra energy demand. It is possible that larval cardiorespiratory performance, for example, could be affected by dietary DHA which is structu-rally important for cardiolipin, a phospholipid found abun-dantly in fish mitochondrial membranes(20).
The present experiment evidenced effects of fatty acid supply on the modulation of the expression of various genes
in undisturbed sea-bream larvae. The ability of metabolic factors to activate PPAR allows for these transcription factors to alter gene expression in response to the nutritional status of the animal(63). LTB4and ARA, but also C18unsaturates, are
import-ant ligands for PPARa(64), and therefore may have affected its transcriptional activity. This could potentially involve the regu-lation of the StAR gene(33)and, in fact, the expression pattern of the two genes among the experimental groups presented striking similarities. The implications of LC-PUFA and their derivatives in steroidogenesis, particularly cortisol synthesis, are numerous and complex, and have been addressed in recent years in sea-bream studies(24,25). Still, differences in StAR expression among the groups did not affect basal cortisol levels. In fact, the control of StAR activity even following acute stress or ACTH signalling in fish may be exerted at the post-transcriptional level(65 – 67), involving steps such as StAR protein
phosphorylation for the activation of the enzyme(68).
GR are central in mediating the genomic actions of cortisol and the present study clearly demonstrated a down-regulation of the GR gene expression with increasing dietary ARA supply. Various GR transcription factors, which are sensitive to fatty acid signalling, may mediate this effect. In mammals, NF-kB and activator protein 1, for example, can be directly activated by fatty acids such as LA and EPA, or by PPAR to regulate GR transcription(69 – 71). As previously noted, differences in larval
fatty acid profiles were not limited to ARA, and it is likely that gene expression results reflected the combined actions
ARA0·4 ARA0·8 ARA1·5 ARA3·0
30 35 25 20 15 10 5 0
Cortisol (ng/g wet weight)
Fig. 2. Whole-body cortisol levels in sea-bream larvae fed diets containing different arachidonic acid (ARA) levels before (basal, ) and 24 h ( ) after a handling stress (1 min stirring). Values are treatment means, with standard errors represented by vertical bars. Absence of letters denotes no statistical differences between the dietary treatments within the sampling times (P. 0·05; ANOVA). A significant effect of stress was found (P, 0·05; ANOVA). 70 (A) (B) 60 50 40 30 20 10 0
ARA0·4 ARA0·8 ARA1·5 ARA3·0
ARA0·4 ARA0·8 ARA1·5 ARA3·0
b a,b a,b a 12 10 4 6 2 0 8 PGE 2 (pg per larva) LTB 4 (pg per larva)
Fig. 3. Whole-body (A) PGE2and (B) leukotriene B4(LTB4) concentrations in
sea-bream larvae fed diets containing different arachidonic acid (ARA) levels. Values are treatment means, with standard errors represented by vertical bars.a,bMean values with unlike letters were statistically different between
the treatments (P, 0·05; ANOVA).
Fatty acids affect fish gene expression 871
British
Journal
of
Nutrition
https://www.cambridge.org/core . Universidade do Algarve , on 12 Mar 2019 at 16:51:47, subject to the Cambridge Core terms of use, available at
https://www.cambridge.org/core/terms
.
of other fatty acids (EPA, LA and LNA). In sea-bream larvae fed similar microdiets varying in lecithin source, up-regulation of the GR gene in soyabean lecithin-fed fish was associated with higher LA and slightly reduced ARA levels in the larval polar and total lipids(43). In comparison, the present results showed higher variation in the expression of the GR gene, which could be due to larger discrepancies between LA and ARA contents between the groups. Therefore, clear evidence exists that GR gene expression in sea bream can be affected by dietary LA and/or ARA supply.
Slightly increased HSL expression associated with higher GR expression was found in the ARA0·4-fed groups relative to the other treatments, as reported previously(43). In addition, high-est PEPCK transcript levels were found in these fish. The two genes are known to respond to GR activity in mammals, although, to our knowledge, a corticosteroid-responsive element has not been identified in fish HSL promoter(48,49). Both enzymes are responsible for the release of energy sub-strates into the blood stream. Given the differences in expression between the groups under basal conditions, particularly of the PEPCK gene, it would be interesting to assess their expression in response to an acute stress.
In summary, the present study demonstrated that gilthead sea-bream larvae adaptation to a wide range of dietary ARA levels involves changes in the expression of genes associated with eicosanoid synthesis, lipid metabolism and stress response. All genes analysed were significantly
down-regulated in sea-bream larvae presenting whole-body
EPA:ARA ratios , 1, but also lower LA and LNA levels relative to the ARA0·4 groups. Therefore, observed effects may not be due to the increase in ARA supply alone. Fatty acids and their derivatives can signal nuclear receptors and transcription fac-tors (such as PPAR), interact with StAR and GR, indirectly modulate metabolic pathways related to energetic metabolism (HSL and PEPCK), and ultimately affect stress-coping ability. It is possible that high larval DHA levels in all experimental groups contributed to the absence of differences in growth and survival after an acute stress challenge, masking potential effects of deficient/excessive ARA supply or of an inadequate dietary ARA:EPA ratio. Considering the increasing interest in promoting animal welfare under intensive farming conditions, and within the current context of research for alternative diet-ary lipid sources in aquaculture, this information may be valu-able for the optimisation of feeds containing vegetvalu-able oils rich in C18 fatty acids but lacking in LC-PUFA.
Acknowledgements
The authors wish to acknowledge Dr Luı´sa Valente (Centro Interdisciplinar de Investigac¸a˜o Marinha e Ambiental, Portu-gal) for kindly assisting in dietary composition analysis. This study was supported by ‘Fundac¸a˜o para a Cieˆncia e a Tecno-logia’, (FCT, Portugal; EFARFish – ‘A new method for the study of essential fatty acid requirements in fish larvae’ PTDC/MAR/67017/2006); ‘Consolider – Ingenio 2010’ pro-gramme (Plan Nacional I þ D þ I þ FEDER, Spain; ‘Aquage-nomics – Improvement of aquaculture production by the use of biotechnological tools’ CSD2007-00002); MCYT þ FEDER (Plan Nacional I þ D þ I, Spain; ‘Mejora del aprove-chamiento del alimento en primeras edades de peces marinos: funcionalidad del tubo digestivo y valoracio´n de la utilizacio´n de macronutrientes’ AGL2007-64450-C02-01); POCTEP Pro-gramme (0251-ECOAQUA-5-E). D. A. M. was supported by grant SFRH/BPD/32469/2006 (FCT, Portugal). The study also benefited from the LARVANET grants COST-STSM-FA0801-4496 and COST-STSM-FA0801-5429. The authors disclose no conflicts of interest. The authors’ contributions were as follows: D. A. M., S. M., M. Y. and L. E. C. C. designed the study; D. A. M. and M. Y. formulated and manufactured the diets; F. R. analysed the diets; F. R., F. C., D. A. M. and L. E. C. C. conducted the experiment; D. A. M. and F. C. conducted cortisol analysis; F. R. and G. M.-R. were responsible for gene expression analyses; D. A. M. and G. B. conducted eicosanoid determinations; F. R., N. B. and J. C. were involved in lipid and fatty acid composition analyses; D. A. M. and F. R. performed the statistical analysis; all authors contributed to manuscript writing, and D. A. M. had primary responsibility for the final content. All authors read and approved the manuscript.
ARA0·4 ARA0·8 ARA1·5 ARA3·0
ARA0·4 ARA0·8 ARA1·5 ARA3·0
5 (A) (B) 4 3 2 1 0 4 3 2 1 0 a a a a b b b b b b b b b b b b b b b,c b,c b b b b b a a a a b b c
Gene expression (SYBR –
∆∆
Ct
)
Gene expression (SYBR –
∆∆
Ct
)
Fig. 4. Whole-body expression of genes in sea-bream larvae fed diets containing different ARA levels. (A) Results relative to phospholipase A2( ),
5-lipoxygenase ( ), cyclo-oxygenase-2 ( ) and PPARa ( ). (B) Results relative to steroidogenic acute regulatory protein ( ), glucocorticoid receptor ( ), hormone-sensitive lipase ( ) and phosphoenolpyruvate carboxykinase ( ). Values are treatment means, with standard errors represented by verti-cal bars. a,b,cMean values with unlike letters were statistically different
between the treatments (P, 0·05; ANOVA).
British
Journal
of
Nutrition
https://www.cambridge.org/core . Universidade do Algarve , on 12 Mar 2019 at 16:51:47, subject to the Cambridge Core terms of use, available at
https://www.cambridge.org/core/terms
.
References
1. Conte FS (2004) Stress and the welfare of cultured fish. Appl
Anim Behav Sci 86, 205 – 223.
2. Barton BA (2002) Stress in fishes: a diversity of responses
with particular reference to changes in circulating corticos-teroids. Integr Comp Biol 42, 517 – 525.
3. Portz DE, Woodley CM & Cech JJ (2006) Stress-associated
impacts of short-term holding on fishes. Rev Fish Biol Fisher 16, 125 – 170.
4. Fletcher TC (1997) Dietary effects on stress and health. In
Fish Stress and Health in Aquaculture, pp. 223 – 246 [GK Iwama, AD Pickering, JP Sumpter and CB Schreck, editors]. Cambridge: Cambridge University Press.
5. Weirich CR & Reigh RC (2001) Dietary Lipids and Stress
Tol-erance of Larval Fish. Binghamton, NY: Food Products Press.
6. Montero D, Kalinowski T, Obach A, et al. (2003) Vegetable
lipid sources for gilthead seabream (Sparus aurata): effects on fish health. Aquaculture 225, 353 – 370.
7. Sargent J, McEvoy L, Este´vez A, et al. (1999) Lipid nutrition of
marine fish during early development: current status and future directions. Aquaculture 179, 1 – 4.
8. Cahu CL, Gisbert E, Villeneuve LAN, et al. (2009) Influence
of dietary phospholipids on early ontogenesis of fish. Aquac Res 40, 989 – 999.
9. Bessonart M, Izquierdo MS, Salhi M, et al. (1999) Effect of
dietary arachidonic acid levels on growth and survival of gilt-head sea bream (Sparus aurata L.) larvae. Aquaculture 179, 1 – 4.
10. Bell JG & Sargent JR (2003) Arachidonic acid in aquaculture
feeds: current status and future opportunities. Aquaculture 218, 491 – 499.
11. Koven W (2002) Gilthead sea bream, Sparus aurata. In
Nutrient Requirements and Feeding of Finfish for
Aquacul-ture, pp. 64 – 78 [CD Webster and C Lim, editors].
New York, NY: CAB International Publishers.
12. Koven W, Barr Y, Lutzky S, et al. (2001) The effect of dietary
arachidonic acid (20:4n-6) on growth, survival and resistance to handling stress in gilthead seabream (Sparus aurata) larvae. Aquaculture 193, 1 – 2.
13. Koven W, Van Anholt R, Lutzky S, et al. (2003) The effect of
dietary arachidonic acid on growth, survival, and cortisol levels in different-age gilthead seabream larvae (Sparus auratus) exposed to handling or daily salinity change. Aquaculture 228, 307 – 320.
14. Van Anholt RD, Koven WM, Lutzky S, et al. (2004) Dietary
supplementation with arachidonic acid alters the stress response of gilthead seabream (Sparus aurata) larvae. Aquaculture 238, 369 – 383.
15. Dhert P, Lavens P, Duray M, et al. (1990) Improved larval
survival at metamorphosis of Asian sea bass Lates calcarifer using omega-3 hufa-enriched live food. Aquaculture 90, 63 – 74.
16. Kraul S, Brittain K, Cantrell R, et al. (1993) Nutritional factors
affecting stress resistance in the larval mahimahi Coryphaena hippurus. J World Aquacult Soc 24, 186 – 193.
17. Kanazawa A (1997) Effects of docosahexaenoic acid and
phospholipids on stress tolerance of fish. Aquaculture 155, 1 – 4.
18. Kanazawa A (1998) Importance of dietary lipids in flatfish.
In Nutrition and Technical Development of Aquaculture, Proceedings of the Twenty-sixth US-Japan Aquaculture
Symposium, Durham, NH, 1997, pp. 181 – 186 [WH
Howell, BJ Keller, PK Park, JP McVey, K Takayanagi and Y Uekita, editors]. United States-Japan Cooperative Program in Natural Resources Technical Report 26.
19. Liu J-K, Wang W-Q, Li K-R, et al. (2002) Effects of fish oil,
DHA oil and lecithin in microparticulate diets on stress toler-ance of larval gilthead seabream (Sparus aurata). Chin J Oceanol Limnol 20, 338 – 343.
20. McKenzie DJ (2005) Effects of dietary fatty acids on the
physiology of environmental adaptation in fish. In Physio-logical and EcoPhysio-logical Adaptations to Feeding in Vertebrates, pp. 363 – 388 [JM Starck and T Wang, editors]. Enfield, New Hampshire: Science Publishers.
21. Wales NAM (1988) Hormone studies in Myxine glutinosa
-effects of the eicosanoids arachidonic-acid,
prostaglandin-E1, prostaglandin-E2, prostaglandin-A2, prostaglandin-F2,
thromboxane B2and of indomethacin on plasma cortisol,
blood pressure, urine flow and electrolyte balance. J Comp Physiol B 158, 621 – 626.
22. Tocher DR (2003) Metabolism and functions of lipids and
fatty acids in teleost fish. Rev Fish Sci 11, 107 – 184.
23. Calder PC (2009) Polyunsaturated fatty acids and
inflamma-tory processes: new twists in an old tale. Biochimie 91, 791 – 795.
24. Ganga R, Tort L, Acerete L, et al. (2006) Modulation of
ACTH-induced cortisol release by polyunsaturated fatty acids in interrenal cells from gilthead seabream. Sparus aurata. J Endocrinol 190, 39 – 45.
25. Ganga R, Bell JG, Montero D, et al. (2011)
Adrenocortico-trophic hormone-stimulated cortisol release by the head kidney inter-renal tissue from sea bream (Sparus aurata) fed with linseed oil and soyabean oil. Brit J Nutr 105, 238 – 247.
26. Stocco DM, Wang XJ, Jo Y, et al. (2005) Multiple signalling
pathways regulating steroidogenesis and steroidogenic acute regulatory protein expression: more complicated than we thought. Mol Endocrinol 19, 2647 – 2659.
27. Wang XJ, Dyson MT, Jo Y, et al. (2003) Involvement of
5-lipoxygenase metabolites of arachidonic acid in cyclic AMP-stimulated steroidogenesis and steroidogenic acute regulatory protein gene expression. J Steroid Biochem 85, 159 – 166.
28. Wang XJ, Dyson MT, Jo Y, et al. (2003) Inhibition of
cyclo-oxygenase-2 activity enhances steroidogenesis and steroido-genic acute regulatory gene expression in MA-10 mouse Leydig cells. Endocrinology 144, 3368 – 3375.
29. Wang XJ, Shen CL, Dyson MT, et al. (2006) The involvement
of epoxygenase metabolites of arachidonic acid in cAMP-stimulated steroidogenesis and steroidogenic acute regulat-ory protein gene expression. J Endocrinol 190, 871 – 878.
30. Desvergne B & Wahli W (1999) Peroxisome
proliferator-activated receptors: nuclear control of metabolism. Endocr Rev 20, 649 – 688.
31. Zhang Y & Mangelsdorf DJ (2002) LuXuRies of Lipid
homeo-stasis: the unity of nuclear hormone receptors, transcription regulation, and cholesterol sensing. Mol Interv 2, 78 – 87.
32. Xie YI, Yang Q & DePierre JW (2002) The effects of
peroxi-some proliferators on global lipid homeostasis and the poss-ible significance of these effects to other responses to these xenobiotics: an hypothesis. Ann NY Acad Sci 973, 17 – 25.
33. Kowalewski MP, Dyson MT, Manna PR, et al. (2009)
Involve-ment of peroxisome proliferator-activated receptor gamma in gonadal steroidogenesis and steroidogenic acute regulat-ory protein expression. Reprod Fert Develop 21, 909 – 922.
34. Borch J, Metzdorff SB, Vinggaard AM, et al. (2006)
Mechan-isms underlying the anti-androgenic effects of diethylhexyl phthalate in fetal rat testis. Toxicology 233, 144 – 155.
35. Pavlikova N, Kortner TM & Arukwe A (2010) Modulation
of acute steroidogenesis, peroxisome proliferator-activated receptors and CYP3A/PXR in salmon interrenal tissues by
Fatty acids affect fish gene expression 873
British
Journal
of
Nutrition
https://www.cambridge.org/core . Universidade do Algarve , on 12 Mar 2019 at 16:51:47, subject to the Cambridge Core terms of use, available at
https://www.cambridge.org/core/terms
.
tributyltin and the second messenger activator, forskolin. Chem-Biol Interact 185, 119 – 127.
36. Striggow F & Ehrlich BE (1997) Regulation of intracellular
calcium release channel function by arachidonic acid and
leukotriene B4. Biochem Biophys Res Commun 237,
413 – 418.
37. Shuttleworth TJ, Thompson JL & Mignen O (2004) ARC
chan-nels: a novel pathway for receptor-activated calcium entry. Physiology 19, 355 – 361.
38. Holmes AM, Roderick HL, McDonald F, et al. (2007)
Inter-action between store-operated and arachidonate-activated calcium entry. Cell Calcium 41, 1 – 12.
39. Meves H (2008) Arachidonic acid and ion channels: an
update. Br J Pharmacol 155, 4 – 16.
40. Prunet P, Sturm A & Milla S (2006) Multiple corticosteroid
receptors in fish: From old ideas to new concepts. Gen Comp Endocrinol 147, 17 – 23.
41. Pottinger TG & Brierley I (1997) A putative cortisol receptor
in the rainbow trout erythrocyte: stress prevents starvation-induced increases in specific binding of cortisol. J Exp Biol 200, 2035 – 2043.
42. Borski RJ (2000) Nongenomic membrane actions of
gluco-corticoids in vertebrates. Trends Endocrinol Metab 11, 427 – 436.
43. Alves Martins D, Este´vez A, Stickland NC, et al. (2010)
Diet-ary lecithin source affects growth potential and gene expression in Sparus aurata larvae. Lipids 45, 1011 – 1023.
44. Lee PC & Struve M (1992) Unsaturated fatty-acids inhibit
glu-cocorticoid receptor-binding of trout hepatic cytosol. Comp Biochem Phys B 102, 707 – 711.
45. Junzo K, Akiko T, Naoki M, et al. (1987) Modulation of brain
progestin and glucocorticoid receptors by unsaturated fatty acid and phospholipid. J Steroid Biochem 27, 641 – 648.
46. Viscardi RM & Max SR (1993) Unsaturated fatty acid
modu-lation of glucocorticoid receptor binding in L2 cells. Steroids 58, 357 – 361.
47. Hedman E, Widen C, Asadi A, et al. (2006) Proteomic
identification of glucocorticoid receptor interacting proteins. Proteomics 6, 3114 – 3126.
48. Le PP, Friedman JR, Schug J, et al. (2005) Glucocorticoid
receptor-dependent gene regulatory networks. PLoS Genet 1, 159 – 170.
49. Lampidonis AD, Stravopodis DJ, Voutsinas GE, et al. (2008)
Cloning and functional characterization of the 50 regulatory
region of ovine Hormone Sensitive Lipase (HSL) gene. Gene 427, 65 – 79.
50. Yu´fera M, Ferna´ndez-Dı´az C & Pascual E (2005) Food
microparticles for larval fish prepared by internal gelation. Aquaculture 248, 253 – 262.
51. Cohen Z, Vonshak A & Richmond A (1988) Effect of
environ-mental conditions on fatty acid composition of the red alga
Porphyridium cruentum: correlation to growth rate.
J Phycol 24, 328 – 332.
52. Bell JG, Tocher DR, MacDonald FM, et al. (1994) Effects of
diets rich in linoleic (18:2n-6) and alpha-linolenic (18:3n-3) acids on the growth, lipid class and fatty acid compositions and eicosanoid production in juvenile turbot (Scophthalmus maximus L.). Fish Physiol Biochem 13, 105 – 118.
53. Livak KJ & Schmittgen TD (2001) Analysis of relative gene
expression data using real-time quantitative PCR and the 2-[Delta][Delta]CT method. Methods 25, 402 – 408.
54. Ricker WE (1958) Handbook of computations for biological
statistics of fish populations. Can J Fish Aquat Sci 119, 1 – 300.
55. Araga˜o C, Conceic¸a˜o LEC, Lacuisse M, et al. (2007) Do
diet-ary amino acid profiles affect performance of larval gilthead seabream? Aquat Living Resour 20, 155 – 161.
56. Yu´fera M, Ferna´ndez-Dı´az C, Pascual E, et al. (2000)
Towards an inert diet for first-feeding gilthead seabream Sparus aurata L. larvae. Aquacult Nutr 6, 143 – 152.
57. Sargent J, Bell G, McEvoy L, et al. (1999) Recent
develop-ments in the essential fatty acid nutrition of fish. Aquaculture 177, 191 – 199.
58. Ganga R, Bell JG, Montero D, et al. (2005) Effect of dietary
lipids on plasma fatty acid profiles and prostaglandin and leptin production in gilthead seabream (Sparus aurata). Comp Biochem Phys B 142, 410 – 418.
59. Maloberti P, Maciel EC, Castillo AF, et al. (2007) Enzymes
involved in arachidonic acid release in adrenal and Leydig cells. Mol Cell Endocrinol 265, 113 – 120.
60. Liu J, Caballero MJ, Izquierdo M, et al. (2002) Necessity of
dietary lecithin and eicosapentaenoic acid for growth, survi-val, stress resistance and lipoprotein formation in gilthead sea bream Sparus aurata. Fisheries Sci 68, 1165 – 1172.
61. Zheng F, Takeuchi T, Yoseda K, et al. (1996) Requirement of
larval cod for arachidonic acid, eicosapentaenoic acid, and docosahexaenoic acid using by their enriched Artemia nauplii. Nippon Suisan Gakk 62, 669 – 676.
62. Ishizaki Y, Takeuchi T, Watanabe T, et al. (1998) A
preliminary experiment on the effect of artemia enriched with arachidonic acid on survival and growth of yellowtail. Fisheries Sci 64, 295 – 299.
63. Komar CM (2005) Peroxisome proliferator-activated
receptors (PPARs) and ovarian function – implications for regulating steroidogenesis, differentiation, and tissue remo-deling. Reprod Biol Endocrinol 3, 14.
64. Lin Q, Ruuska SE, Shaw NS, et al. (1999) Ligand selectivity of
the peroxisome proliferator-activated receptor a. Biochemis-try 38, 185 – 190.
65. Geslin M & Auperin B (2004) Relationship between changes
in mRNAs of the genes encoding steroidogenic acute regulat-ory protein and P450 cholesterol side chain cleavage in head kidney and plasma levels of cortisol in response to different kinds of acute stress in the rainbow trout (Oncorhynchus mykiss). Gen Comp Endocrinol 135, 70 – 80.
66. Hagen IJ, Kusakabe M & Young G (2006) Effects of ACTH
and cAMP on steroidogenic acute regulatory protein and P450 11b-hydroxylase messenger RNAs in rainbow trout interrenal cells: relationship with in vitro cortisol production. Gen Comp Endocrinol 145, 254 – 262.
67. Castillo J, Castellana B, Acerete L, et al. (2008) Stress-induced
regulation of steroidogenic acute regulatory protein
expression in head kidney of Gilthead seabream (Sparus aurata). J Endocrinol 196, 313 – 322.
68. Arakane F, King SR, Du Y, et al. (1997) Phosphorylation of
steroidogenic acute regulatory protein (StAR) modulates its steroidogenic activity. J Biol Chem 272, 32656 – 32662.
69. Dichtl W, Nilsson L, Goncalves I, et al. (1999) Very
low-density lipoprotein activates nuclear factor-kappa B in endothelial cells. Circ Res 84, 1085 – 1094.
70. Yudt MR & Cidlowski JA (2002) The glucocorticoid receptor:
coding a diversity of proteins and responses through a single gene. Mol Endocrinol 16, 1719 – 1726.
71. Jia Y & Turek JJ (2005) Altered NF-kappa B gene expression
and collagen formation induced by polyunsaturated fatty acids. J Nutr Biochem 16, 500 – 506.
British
Journal
of
Nutrition
https://www.cambridge.org/core . Universidade do Algarve , on 12 Mar 2019 at 16:51:47, subject to the Cambridge Core terms of use, available at
https://www.cambridge.org/core/terms
.