Adding intelligence to a smartphone
application prototype for exchanging
public transport information among
travelers
Luís Carlos Moreira Dias
Mestrado Integrado em Engenharia Informática e Computação Supervisor: Teresa Galvão
Second Supervisor: António Nunes
prototype for exchanging public transport information
among travelers
Luís Carlos Moreira Dias
4
Mestrado Integrado em Engenharia Informática e Computação
Approved in oral examination by the committee:
6
Chair: Doctor Rui Camacho
External Examiner: Penousal Machado Supervisor: Doctor Teresa Galvão
The increasing number of private owned cars in urban areas is contributing to the increase of urban mobility problems. Thus, the need for expanding of the public transport utilization is imminent,
4
and one of the main decisions to be made centres in improving the traveller’s experience.
At the same time, the massification of the social networks’ use and the increase on the number
6
of smartphones available is changing the way we share information and everyday the mobility of the user is less of a problem.
8
The increase of users in public transports connected to social networks in their journey allows them to share in real time information regarding their travel. This information can be useful to
10
other users, giving relevant knowledge that can influence behaviour, and to the transport company managers, providing reliable data to be used on decision making.
12
With a better understanding of the travellers’ travel patterns and the similarities with other travellers’ routines, the relevance and efficiency of the information shared in a public transport
14
can be largely improved. At the same time, the behaviour of the user can be understood with this information, providing the identification of an unique user profile.
16
In the context of this problem, this dissertation aims to propose the implementation of algo-rithms that identifies travel patterns of public transport users, which allows the sharing of
infor-18
mation with improved efficiency and relevance. These goals are achieved by inferring travellers’ destinations and predicting future travels, modelling travel patterns and creating networks of users
20
who share similar travel routines.
The results of this work will improve an existing prototype of a smartphone application for
22
the exchange of public transport related information between travellers that was developed in the context of the same project. It will allow users to automatically connect with travellers with similar
24
O crescente número de carros privados em áreas urbanas está a contribuir para o o crescimento de problemas de mobilidade urbana. Assim, a necessidade de expandir a utilização de transportes
4
públicos é iminente, e uma das principais decisões a ser feita centra-se em melhorar a experiência de viagem do utilizador.
6
Ao mesmo tempo, a massificação do uso das redes sociais e o crescimento do número de smartphonesutilizados está a mudar a forma como trocamos informação e a cada dia a mobilidade
8
da comunicação é menos um problema.
O aumentar de utilizadores ligados a redes sociais dentro dos transportes públicos durante a sua
10
viagem permite-lhes partilhar em tempo real informação acerca da sua viagem. Esta informação pode ser útil para outros utilizadores, dando conhecimento relevante que pode influenciar o seu
12
comportamento, e para os administradores de empresas de transportes, providenciando informação fiável que pode ser útil para tomadas de decisão.
14
Percebendo melhor os padrões de viagem dos viajantes e as semelhanças com as rotinas de outros, a relevância e eficiência da informação partilhada em transportes públicos pode ser
alta-16
mente melhorada. Ao mesmo tempo, o comportamento do utilizador pode ser percebido com esta informação, permitindo a identificação de um perfil de viagem.
18
No contexto deste problema, esta dissertação tem como alvo propor a implementação de al-goritmos que identifiquem padrões de viagem em utilizadores de transportes públicos, permitindo
20
assim a partilha de informação com melhor de eficiência e relevância. Estes objectivos são atingi-dos inferindo destinos de viagens atingi-dos utilizadores e prevendo futuras viagens com base nestas
22
inferências, utilizando os seus dados de viagem, modelando assim padrões de viagem e criando redes de utilizadores cujas rotinas são semelhantes.
24
Estes resultados levarão ao melhoramento de um protótipo existente duma aplicação para smartphonesexistente para troca de informação relacionada com transportes publicos entre
uti-26
lizadores, que foi desenvolvida previamente no contexto do mesmo projecto. Irá permitir aos utilizadores conectar-se automaticamente com outros viajantes com rotinas semelhantes, obtendo
28
This work wouldn’t be possible without help of a lot of people I am grateful.
First of all, I would like to thank my family. Without their comprehension, support and
mo-4
tivation the result surely wouldn’t be the same. They were who took all my frustrations in home, and I’m sure it wasn’t easy to deal with at some hard times. For that, I am immensely grateful. To
6
my dog also, for never obeying me.
For my friends, for always being there, even when I wasn’t. They were the ones who helped
8
me having strength to carry on on my course, and without them I probably wouldn’t be writing this now.
10
To my supervisor, Prof. Teresa Galvão, for all the support, to get time on her schedule to help me in my difficult times, giving me valuable suggestions and understanding some difficulties in
12
the management of my time due to my part-time job.
To Eng. António Nunes, my co-supervisor, for always being there to help me, giving great
14
advices and great ideas for the development of this work. His project idea has great potential and I hope this work can help him achieving good results.
16
To the rest of the people in CAS for taking me and making me comfortable, giving me good moments and providing a great place to work.
18
To Strongstep, my contractors at the time of this work, that always were available for me and had an incredible understanding of my need of time to finish this work. Their comprehension had
20
a great impact on the success of the final results, and I am grateful.
And to STCP and OPT, for gently providing the data used for this research and making it
22
possible.
1 Introduction 1 1.1 Context . . . 1
4
1.2 Motivation and Goals . . . 2 1.3 Document Structure . . . 3
6
2 State of The Art 5
2.1 Introduction . . . 5
8
2.2 Social networks for travelers . . . 5 2.2.1 A smartphone application prototype for exchanging public transport
infor-10
mation among travelers . . . 5 2.3 Origin-Destination Inference . . . 7
12
2.4 Knowledge discovery from data . . . 8 2.4.1 Data Pre-Processing . . . 8
14
2.4.2 Data Mining . . . 9 2.4.3 Clustering . . . 10
16
2.5 Relevance in information retrieval . . . 12 2.6 Summary and Conclusions . . . 12
18
3 Travel path inference 15
3.1 Introduction . . . 15 20 3.2 Architecture . . . 16 3.3 Data description . . . 17 22 3.4 Data pre-processing . . . 18 3.5 Origin-Destination matrix inference . . . 20
24
3.5.1 Class diagram . . . 20 3.5.2 Nested loop structure . . . 22
26
3.5.3 Distance-to-Stop matrix pre-calculation . . . 23 3.5.4 Destination inference . . . 24
28
3.5.5 Time of arrival inference . . . 27 3.6 Results . . . 28
30
3.7 Evaluation . . . 31 3.8 Summary and Conclusions . . . 33
32 4 Temporary networks 35 4.1 Introduction . . . 35 34 4.2 Architecture . . . 36 4.3 Full-process overview . . . 37 36
4.5 Network creation structure . . . 44 2
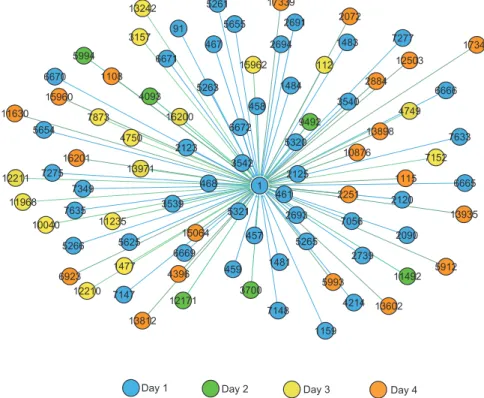
4.6 User-centred temporary networks . . . 44 4.7 Results and Evaluation . . . 46 4
4.7.1 Single-day experience . . . 46 4.7.2 Five-day experience . . . 53 6
4.8 Summary and Conclusions . . . 57
5 Conclusions and Future Work 59 8
References 63
A Data analysis - Porto public transport system 67 10
A.1 Zonal system . . . 67 A.1.1 Statistics and data analysis . . . 68 12
B Temporary networks 73
B.1 Single-day temporary networks . . . 74 14
B.1.1 Temporary networks at 08:00 . . . 74 B.1.2 Temporary networks at 08:15 . . . 76 16
B.1.3 Temporary networks at 08:30 . . . 78 B.1.4 Temporary networks at 08:45 . . . 80 18
B.2 Five-day temporary networks . . . 84 B.2.1 Traveller 1 temporary network on 11/01/2010 . . . 84 20
B.2.2 Traveller 1 temporary network on 12/01/2010 . . . 87 B.2.3 Traveller 1 temporary network on 13/01/2010 . . . 89 22
B.2.4 Traveller 1 temporary network on 14/01/2010 . . . 92 B.2.5 Traveller 1 temporary network on 15/01/2010 . . . 95
3.1 Travel inference architecture . . . 16 3.2 Pre-processing procedure flowchart . . . 19
4
3.3 Pre-processing results for the validations dataset . . . 20 3.4 Origin-Destination inference class diagram . . . 21
6
3.5 Nested loop structure adapted from Zhao et al. [ZRW07] . . . 23 3.6 Destination Inference algorithm flowchart adapted from Gordon [Gor12] . . . 25
8
3.7 Passenger changes route between two (1 and 2) consecutive travels . . . 26 3.8 Time of arrival inference steps adapted from Gordon [Gor12] . . . 27
10
3.9 Inferred travels for one passenger on the course of the day . . . 30 3.10 Simulation of trip segments for one the traveller T during one day . . . 32
12
3.11 Results from the inference algorithm on the simulated dataset . . . 33 4.1 Temporary network basic architecture . . . 36
14
4.2 Temporary network creation architecture . . . 37 4.3 Real-time full process overview for the passenger process when using the
applica-16
tion [NDGC14b] . . . 38 4.4 Comparison between relevant and non-relevant travels for one passenger [NDGC14b] 39
18
4.5 Asymmetry between travel relevance for two passengers [NDGC14b] . . . 41 4.6 Different levels of complementarity between two passengers’ travel paths . . . . 42
20
4.7 Structure overview for the network creation process . . . 45 4.8 Temporary network creation process for one passenger . . . 47
22
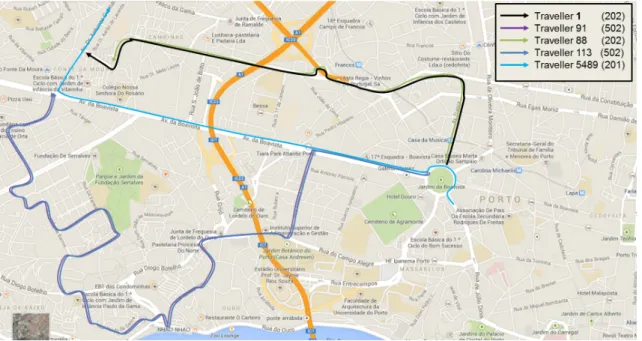
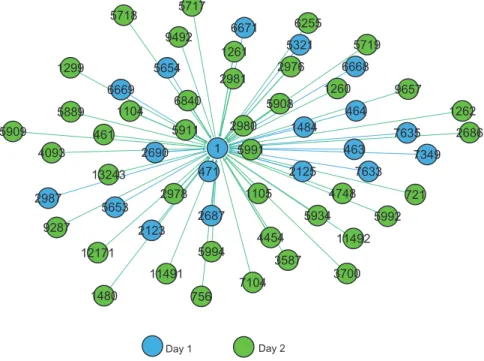
4.9 Cloud of inter-connected temporary clusters at 08:00 . . . 48 4.10 Initial temporary network for traveller 1 at 08:00 . . . 49
24
4.11 Traveller 1’s temporary network with member relevance at 08:15 . . . 49 4.12 Traveller 1’s temporary network with member relevance at 08:30 . . . 49
26
4.13 Traveller 1’s temporary network with member relevance at 08:45 . . . 49 4.14 Traveller 91’s temporary network at 08:00 . . . 50
28
4.15 Traveller 88’s temporary network at 08:00 . . . 50 4.16 Traveller 43’s temporary network at 08:00 . . . 50
30
4.17 Map representation of traveller 1’s temporary network connections at 08:00 . . . 50 4.18 Map representation of traveller 1’s temporary network connections at 08:15 . . . 51
32
4.19 Map representation of traveller 1’s temporary network connections at 08:30 . . . 52 4.20 Map representation of traveller 1’s temporary network connections at 08:45 . . . 53
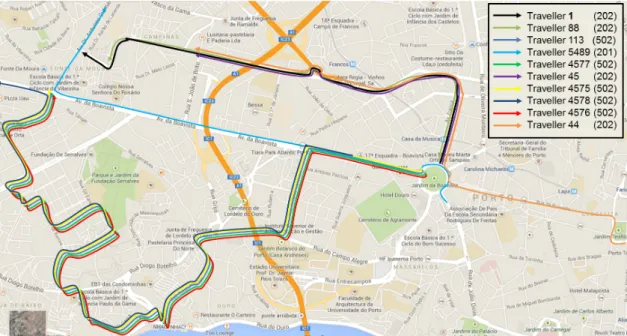
34
4.21 Map with travels performed by passenger 1 before 8:00 during the five days . . . 54 4.22 Temporary temporary network for traveller 1 at 08:00 on January 11st . . . 55
36
4.23 Temporary temporary network for traveller 1 at 08:00 on January 12nd . . . . 55
4.24 Temporary temporary network for traveller 1 at 08:00 on January 13rd . . . 56
38
4.26 Temporary temporary network for traveller 1 at 08:00 on January 15th . . . 57 2
A.1 Andante zones worked by STCP . . . 68 A.2 Andante zoning rings from zone C1 . . . 68 4
A.3 Validations with Andante cards versus other cards on January . . . 69 A.4 Validations per zone on January . . . 69 6
A.5 Validations from January . . . 70 A.6 Unique users per day on January . . . 70 8
A.7 Travelled routes on January . . . 71 A.8 Bus stops with validations on January . . . 71 10
3.1 Results for running the inference algorithm on the case study data for January . . 29 3.2 Non-inferences due to network changes . . . 29
4
3.3 Journeys made by one random passenger on January 6th. . . 30 4.1 Traveller 1’s temporary network with member relevance at 08:00 . . . 50
6
4.2 Traveller 1’s temporary network with member relevance at 08:15 . . . 51 4.3 Traveller 1’s temporary network with member relevance at 08:30 . . . 52
8
4.4 Traveller 1’s temporary network with member relevance at 08:45 . . . 52 4.5 Temporary network patterns for the five-days experience . . . 57
10
B.1 Traveller 1’s temporary network with member relevance at 08:00 . . . 74 B.2 Traveller 43’s temporary network with member relevance at 08:00 . . . 74
12
B.3 Traveller 91’s temporary network with member relevance at 08:00 . . . 74 B.4 Traveller 42’s temporary network with member relevance at 08:00 . . . 75
14
B.5 Traveller 7918’s temporary network with member relevance at 08:00 . . . 75 B.6 Traveller 88’s temporary network with member relevance at 08:00 . . . 75
16
B.7 Traveller 1’s temporary network with member relevance at 08:15 . . . 76 B.8 Traveller 43’s temporary network with member relevance at 08:15 . . . 76
18
B.9 Traveller 113’s temporary network with member relevance at 08:15 . . . 76 B.10 Traveller 91’s temporary network with member relevance at 08:15 . . . 77
20
B.11 Traveller 5489’s temporary network with member relevance at 08:15 . . . 77 B.12 Traveller 7918’s temporary network with member relevance at 08:15 . . . 78
22
B.13 Traveller 88’s temporary network with member relevance at 08:15 . . . 78 B.14 Traveller 1’s temporary network with member relevance at 08:30 . . . 78
24
B.15 Traveller 113’s temporary network with member relevance at 08:30 . . . 79 B.16 Traveller 91’s temporary network with member relevance at 08:30 . . . 79
26
B.17 Traveller 5489’s temporary network with member relevance at 08:30 . . . 79 B.18 Traveller 88’s temporary network with member relevance at 08:30 . . . 80
28
B.19 Traveller 1’s temporary network with member relevance at 08:45 . . . 80 B.20 Traveller 4575’s temporary network with member relevance at 08:45 . . . 81
30
B.21 Traveller 3279’s temporary network with member relevance at 08:45 . . . 81 B.22 Traveller 45’s temporary network with member relevance at 08:45 . . . 81
32
B.23 Traveller 113’s temporary network with member relevance at 08:45 . . . 82 B.24 Traveller 44’s temporary network with member relevance at 08:45 . . . 82
34
B.25 Traveller 5489’s temporary network with member relevance at 08:45 . . . 82 B.26 Traveller 4577’s temporary network with member relevance at 08:45 . . . 83
36
B.27 Traveller 4576’s temporary network with member relevance at 08:45 . . . 83 B.28 Traveller 88’s temporary network with member relevance at 08:45 . . . 84
B.29 Traveller 1’s temporary network with member relevance on 11/01/2010 . . . 84 2
B.29 Traveller 1’s temporary network with member relevance on 11/01/2010 . . . 85 B.29 Traveller 1’s temporary network with member relevance on 11/01/2010 . . . 86 4
B.29 Traveller 1’s temporary network with member relevance on 11/01/2010 . . . 87 B.30 Traveller 1’s temporary network with member relevance on 12/01/2010 . . . 87 6
B.30 Traveller 1’s temporary network with member relevance on 12/01/2010 . . . 88 B.30 Traveller 1’s temporary network with member relevance on 12/01/2010 . . . 89 8
B.31 Traveller 1’s temporary network with member relevance on 13/01/2010 . . . 89 B.31 Traveller 1’s temporary network with member relevance on 13/01/2010 . . . 90 10
B.31 Traveller 1’s temporary network with member relevance on 13/01/2010 . . . 91 B.31 Traveller 1’s temporary network with member relevance on 13/01/2010 . . . 92 12
B.32 Traveller 1’s temporary network with member relevance on 14/01/2010 . . . 92 B.32 Traveller 1’s temporary network with member relevance on 14/01/2010 . . . 93 14
B.32 Traveller 1’s temporary network with member relevance on 14/01/2010 . . . 94 B.32 Traveller 1’s temporary network with member relevance on 14/01/2010 . . . 95 16
B.33 Traveller 1’s temporary network with member relevance on 15/01/2010 . . . 95 B.33 Traveller 1’s temporary network with member relevance on 15/01/2010 . . . 96 18
AFC Automatic Fare Collection CO2 Carbon Dioxide
CSV Comma Separated File ETA Estimated Time of Arrival GPS Global Positioning System IR Information Retrieval JVM Java Virtual Machine NFC Near Field Communication PoI Points of Interest
PTAL Public Transport Accessibility Level REST Representational State Transfer
STCP Sociedade Portuguesa de Transportes do Porto SQL Structured Query Language
TIP Transportes Intermodais do Porto USA United States of America
Introduction
4
1.1
Context
The massification of social networking is undoubtedly one of the main reasons for the actual
6
evolution on communication between people. Just in the USA, 81% of adults (ages 30-49) go on-line, and 47% use social networks [LPSZ10]. At the same time, the evolution of comunication
8
technology and devices has allowed this communication to be made anywhere. 81% of adults (ages 30-49) are wireless Internet users, and 93% of that age class have a cell phone [LPSZ10].
10
While we communicate easier, the mobility of people in urban areas keeps getting harder due to the number of private owned vehicles in these areas. This along the escalation in CO2 12
emissions, that suggests that a 50% reduction is needed by 2050 "to avoid a 2 degrees increase in global temperatures and sea level rise" [GB13], have been one of the main reasons of the growing
14
importance of public transports. This ultimately calls for actions to be made regarding the use of these vehicles and improving the travellers’ experience should be one of the main focus to
16
successfully promote the expansion of their use.
Communication through social networks can improve the user experience while travelling on
18
public transports. Major transport companies are already on-line, offering information regarding events or vehicle schedules and are present on the main social networks providing a way for their
20
users to exchange information on their travels. However, this information is highly scattered and in big quantities [NGCP11], and consequently finding relevant information for one specific traveller
22
riding on one specific route in real-time is extremely difficult as users need to search for what is relevant to them.
24
This work appeared in the the context of a current PhD project concerning the co-creation of value in urban public transport between travellers [Nun12], and following an MSc thesis that
26
consisted of the implementation of a prototype of a smartphone application for the exchange of public transport related information between travellers [Gon12], extending it to improve network
28
The data used came from Porto’s public bus transport network, gently provided by STCP 2
and OPT for investigation purposes, and its attributes quality regarding vehicle, time and location information benefit this thesis final results quality. 4
1.2
Motivation and Goals
Travellers who use public transports on their lives tend to develop some routines in their daily 6
journeys. Using the potential of easy communication, public transport companies try to help their travellers providing information in social platforms like Twitter and Facebook that helps them in 8
their travels. This kind of procedure works both ways, since company managers can use data shared by travellers in these social networks to improve their service. 10
During the travels, a big portion of users are connected to the Internet [Gon12] and use it, among others, to share information regarding their current travel. This information is usually 12
sparse and hard to deliver to friends to whom that information could be valuable if delivered
timely and efficiently. 14
Information capture regarding passenger transit information on an open system has been his-torically associated to an expensive task [Gor12]. Individual information regarding origin-destination 16
pairing for one travel on a bus route could be gathered through the combination of boarding counts and traveller surveys samples [BAMH85]. However, survey response rates are shown to be de- 18
clining, thus increasing the cost and losing reliability [Sto08][Sim10] and it has been studied that public transports’ card systems can "provide similar OD [Origin-Destination] information at larger 20
scales and at lower cost [PYKL08] [Gor12].
Origin-destination pairing for riders’ travels can provide enough data to predict future travels 22
from the passengers given a time interval of the day. Information about regular public transport users can thus, through this information, be clustered though similarity among historical travels or 24
travel paths in a way that allows merging the most similar travels in networks which provide a mean to find passengers with similar travel patterns and to interchange valuable real-time information 26
among them.
This dissertation aims to use the previously dissertation work on a smartphone application to 28
share public transport information among travellers [Gon12] and improve it so that the application uses travel data to detect user travel patterns, infer previous destinations and predict future travels. 30
Through this adaptation, it is expected that, in the future, this smartphone application will be able to integrate the algorithms developed in this work and be tested in the real world, with real 32
passengers.
The scientific objectives of this work are the creation of a framework that efficiently deter- 34
mines users’ travel destinations, allowing inference of users’ travel patterns and the identification of users’ travel profiles recurring to users’ travel data mining, using different techniques and al- 36
relevance among user travels, will allow the creation of networks of users with similar and
rele-2
vant travel routines, providing automatic insertion on these networks and feeding them with more relevant and efficient information.
4
1.3
Document Structure
Along with this introduction, this dissertation has 4 more chapters and is organized as follows:
6
In chapter2, the state of the art for the fields related to this work is defined. Contains a detailed explanation of the previous work on which this thesis is based alongside with literature about
8
destination inference, relevance searching and major clustering algorithms and their attributes. In chapter3, the problem of inferring the passengers’ destinations is presented, along with
10
the methods proposed to solve it. It contains the implementation and explanation of several main decisions to estimate travel destinations, along with a proposed evaluation method based on the
12
inference of a simulated dataset.
Chapter4 details the implementation of the second phase of this work, the creation of
tem-14
porary networks. In this chapter the concept of relevance among travellers and its measurement methods are deeply explained, and from it the creation of temporary networks is detailed and the
16
results analysed, along with the conclusions obtained from them.
Chapter 5 presents the conclusions and the future work to be done on the context of the
18
State of The Art
4
2.1
Introduction
In the last years, due to the evolution in communication and social interaction, some work related
6
to social networking for travellers has appeared. The application on which this work revolves is one of those works, and will be detailed in the following section2.2.1.
8
The amount of Geo-tagged data existent on networks like Flickr or Twitter [FS10] provides also the possibility of detection of user patterns in multiple areas. Studies to detect patterns on
10
travels, mobility or even points-of-interest visit in some regions have been made, and this work will present its main concepts and the possibilities of improvement to provide a good background.
12
Public transports that run on open systems, in which users only validate their travel when boarding, exist in many cities on the world and thus transport companies have with them big sets
14
of information regarding those travels. Using this data, studies have been made in order to obtain passenger flows, travel behaviour or peaks of travel in certain areas. Work related to the inference
16
of origin-destination matrices exists, providing ways to obtain destinations from data on which only boarding is described, and is analysed on this section.
18
This chapter presents the most relevant concepts to this thesis and the related work performed in this area.
20
2.2
Social networks for travelers
2.2.1 A smartphone application prototype for exchanging public transport
infor-22
mation among travelers
To respond to the needs of improvement of user experience in public transports, a platform was
cre-24
ated and implemented [Gon12] in the context of a PhD work by António Nunes [Nun12] [NGCP11]. This prototype service "enables collaborative exchanges on information in real-time among public
26
Being a social network a set of "connections between groups of people" [Mit69], with the 2
massification of Internet it became defined as a platform in which users are allowed to communi-cate and share information [Dic14]. These networks are, therefore, formed by groups of people 4
who know each other in some way, or that have some kind of personal connection or even mu-tual interests. Hereupon, to travellers who ride public transports, this kind of connections are 6
rarely found, since in their journeys they share the different vehicles with different people every day. Regarding this foundation, the implemented application uses the concept of temporary net- 8
work [NGCP11][NGC12], being this network one with temporary connections, in which for each travel a user may have different sets of "friends", i.e, connections. This temporary attribute is 10
defined by the current location of each user, by grouping all users currently in a given route and direction in the same network, dissimilar from users in different routes at the same time. The im- 12
provements proposed by this thesis work are directly related with this component, aiming to add intelligence to this process of temporary networks creation. 14
With this application the traveller can rate aspects of his current journey. After the manual check-in in the vehicle, where the user indicates the route in which the vehicle operates, he can 16
"rate aspects of the current journey, rate recent comments provided by others in the same route, read spatially referenced comments that match his or her travel profile and intentions, check points 18
and available rewards, see which users are in the same temporary network, and plan a journey according to his or her recorded travel profile and intentions" [NGCP11]. This information may 20
be of different types such as seating availability, crowding, progress, punctuality, temperature,
noise or driver skills. 22
Furthermore, there are two kinds of information: (i)structured by type and restricted to the options on the application or (ii) free content input, with the possibility of writing comments, 24
referenced by route and type [NGCP11]. The access to this data is only available to travellers in the same network, providing effective information in a way that only users to whom that information 26
is relevant can see it and rate it as good or bad. The effectiveness of this information is improved by a rating system, which consists in that, for a given information being shared, it must be rated 28
by a small random set of users and validated before being shared with the remaining network
elements, improving its reliability. 30
Travellers are encouraged to share relevant data and rate other travellers’ information through a rewards model [NGCP11]. This system would "enhance the game-like nature of the proposed 32
model of social network interaction, making it more appealing as as serious real-life game" [NGCP11]. Users that provide good information and rate others accordingly are rewarded with virtual points, 34
based on parameters defined by transport network managers. Thus, good information and rating earns points, whereas irrelevant input incurs in a penalty. With enough points, transport managers 36
could reward the users that provide best information with discounts or other kinds of gain for the traveller. On the other side, from a business model perspective, this information can help the 38
same managers to improve service quality, possibly increasing revenue. With the gathered data, transport companies can cut off in satisfaction surveys, since with the rewarding system they are 40
2.3
Origin-Destination Inference
2
Inference represents the process of deriving conclusions based on premises assumed true. In the context of this work, these assumptions allow the inference of origins and/or destinations, when
4
only one or none of them is previously known, for each trip segment of one user’s day in the public transport system. Inferring the trip segment origin and destination becomes mandatory to reveal
6
each user’s full travel path, allowing future work on the detection of patterns among travels. Regarding related work, Barry et al. [BNRS02] use New York metro data (MetroCard1) with
8
the objective of infer destinations for each travel, since New York’s is, as in Porto, an open tem, i.e, one system in which the passengers are only required to register their entry on the
sys-10
tem through their card, being allowed to navigate freely until the final destination. The main application of this work is "to describe travel patterns for service planning and to create
Origin-12
Destination trip tables" [BNRS02] to determine volume of crowdedness on trains at peak load points, using the MetroCard’s gathered data. This dataset has information regarding time and
14
location of the sequence of trips’ origins performed by each user in the system, and a set of algo-rithms is applied to this data to estimate each trip segment destination. As an inference, this work
16
follows two premisses: first, "a high percentage of travellers return to the destination station of their previous trip to begin their next trip" [BNRS02] and second, "a high percentage of travellers
18
end their last trip of the day at the station where they began their first trip of the day" [BNRS02]. Gordon [Gor12] uses London Oyster2farecardvalidations and iBus3 automatic vehicle
loca-20
tion (AVL) system to infer origin and interchange locations between trips of various public modes, constructing full origin-interchange-destination matrices. The dataset is composed of spatial
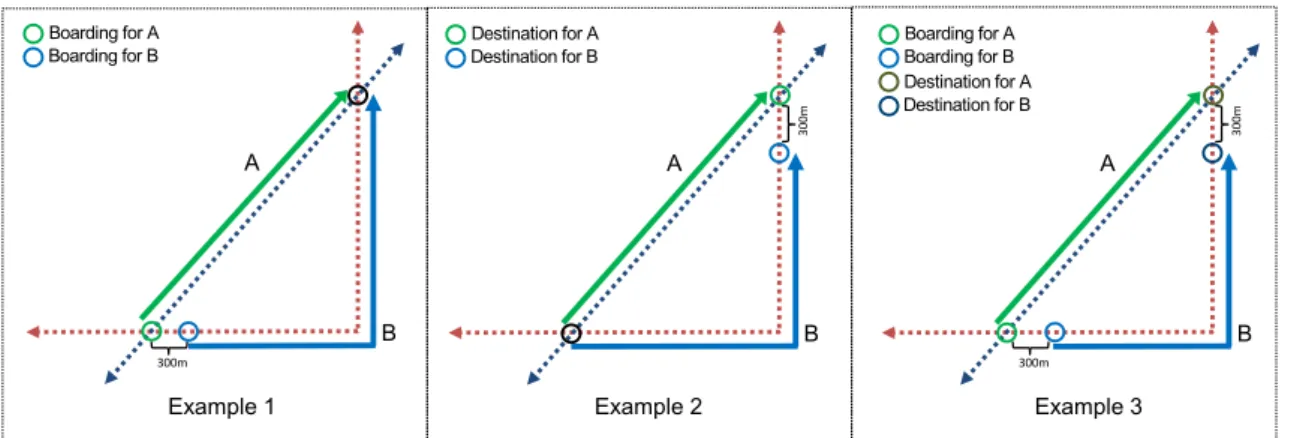
co-22
ordinates relative to the travellers path. Using this data, this work calculates distances between travellers coordinates and stop locations. Gordon’s [Gor12] goal is to estimate passengers’ flows
24
in the London’s public transport network for each time period (early morning, morning peak, evening peak), and based on the assumption that the sample’s time spans for the travels are a
26
proxy for those of the population.
The automatic fare collection (AFC) system of the Chicago Transit Authority4is used by Zhao
28
et al. [ZRW07] to develop a method to infer passengers’ origin-destination for each trip. Its tick-eting system runs, as in Barry et al. [BNRS02], on an open system, which means that the data
30
gathered also provides only the boarding location for each trip. The dataset contains spatial and temporal information for each boarding validation on each card, as the route and sequence number
32
of the boarding stop on that route. To infer the origin-destination matrix, this work follows the premise that "a high percentage of users stay at, or return to, the destination station of their
pre-34
vious trip segment to begin their next trip segment" [ZRW07], taking advantage of each person’s consecutive trip segments. For that, three assumptions are made: there is no private transportation
1http://web.mta.info/metrocard/ 2http://www.tfl.gov.uk/tickets/14836.aspx
3http://www.tfl.gov.uk/static/corporate/media/newscentre/archive/11573.html 4http://www.transitchicago.com/
mode between each consecutive trip, passengers don’t walk long distances (assuming the accept- 2
able walking distance as 1320 feet [400 meters]) and passengers end their last trip of the day at the station where they began their first trip of that day. This works tries to obtain results with the 4
objective of demonstrate the potential of this study to replace expensive origin-destination surveys
and help improving decision making. 6
Summarizing, there’s some work done on the inference of origin-destination matrices, provid-ing some reliable and useful information to this document’s work. However, none of the literature 8
contains zonal validation for the inferred origin and/or destination, and as detailed in chapter 3 this component provides an useful improvement on the inference final quality assurance. 10
2.4
Knowledge discovery from data
Regarding this work, a big set of validations data was provided by STCP public transport system 12
for research purposes. This consisted in nearly 30 million records for the months of January, April and May of 2010, from which we could extract information regarding the vehicle internal identi- 14
fier, journey start time, location and time of boarding from the passenger, among other important
data. 16
Hereupon, since we were dealing with such amounts of data, work around discovering the relevant information from data was studied for this thesis, and the next sections present the state 18
of the art regarding these concepts.
2.4.1 Data Pre-Processing 20
Data analysis is considered to be the base of investigation in many fields of knowledge [FS97]. Through this analysis, researchers can get a better understanding of the problems and improve de- 22
cision making to solve them. Thus, perfecting data quality is of major importance to its reliability, and in most cases [FS97] imperfections in data are not noticed until the analysis begins. 24
Considering this problem, the main objectives of data pre-processing are to improve data qual-ity and solve problems such as missing attributes, duplicates, corrupt data or data structure modi- 26
fication. Furthermore, this phase’s results are indispensable to the final success of the work, as can
be found in some work described below. 28
In Prasad et al. [PRA10], data pre-processing is shown to be critical to successfully extract useful and reliable information in large volumes of data from web-based organizations. The impact 30
of data pre-processing on the analysis and optimization of web-based educational systems and its learning content is analysed in Sato et al. [SMS+11], comparing the extracted results. Alcalá- 32
Fdez et al. [AFSG+08] presents KEEL, a software tool specialized in Data Mining problems along with the integration of different pre-processing techniques. The importance of this preparation is 34
discussed as one of the main contributions to the algorithms results and it is shown as a complex component of knowledge discovery from data. Gordon [Gor12] works on the the estimation of 36
origin and destination of user travels based on spatial data from the users’ cards. This data is referred as propitious to invalid information such as unfinished entries, duplicate transactions and
corrupt travel segments, and requires special handling of data, making data pre-processing one of
2
the major factor of success for the inference.
Summarizing, when facing large datasets the impact of data quality is severe. Thus,
pre-4
processing and elimination/transformation of corrupt, incomplete or unstructured data reveals it-self as one of the most important components to ensure good results. Because this work uses
6
large volumes of data from travellers’ validations, pre-processing this information is the first step towards the proposed solution.
8
2.4.2 Data Mining
Data mining is "the entire process of applying computer-based methodologies", through either
au-10
tomatic or manual methods, with the main goal of "knowledge discovery" from "large collections of data" [Kan11]. This knowledge if often hidden in the data, and "to act on that knowledge is
12
becoming increasingly important in today’s competitive world" [Kan11], as we live in data-driven times, in which data mining" is a fast growing application area in business" [BM01].
14
The process of data mining tends to have two main objectives:
• Prediction: used to predict unknown of future values of variables of interest. Predictive
16
miningproduces a model for the system based on the given data set, and this model can be used to classification, prediction or estimation, among other tasks.
18
• Description: used to find patterns described in the data, in a way that can be interpreted by humans. Descriptive mining produces new, non-trivial information based on the given set.
20
This information uncovers patterns and relationships in the data set, with the goal of deeply understand the system.
22
The goals mentioned above are achieved using different data mining techniques. These are applied, as showed in [Kan11], [Jia06], [MH09], for the following tasks:
24
• Classification and Regression: Given a range of predefined classes, discovers a predictive function classifying data into on of the classes (classification) or mapping the data to a
26
real-value prediction variable (regression).
• Clustering: Technique that groups similar objects in the same sub-group. Different objects
28
belong to different sub-groups.
• Summarization: Finds and discriminates a compact description for characteristics or
fea-30
tures of subsets of data.
• Dependency Modelling: Models dependencies between features in a data set, predicting
32
values of some attributes based on another.
• Change and Deviation Detection: Discovers items that exhibit unexpected changes and
de-34
2.4.3 Clustering 2
Clustering is "the process of grouping a set of physical or abstract objects into classes of similar objects" [Jia06]. This groups of data have the name of cluster, and a single cluster is formed by 4
objects "that are similar to one another" and at the same time "are dissimilar to the objects in other
clusters" [Jia06]. 6
Regarding the proposed problem, with the need to find patterns from unlabelled data such as the location of the travellers’ journeys, clustering becomes one approach to analyse. Grouping 8
of similar patterns among travellers could answer the need of creating networks of similar trav-els, provided a data set of travel intentions. Furthermore, the techniques of spatial and temporal 10
clustering, as described ahead in this document, could provide algorithms capable of geo-spatial
aggregations. 12
There is some work that can be analysed regarding the finding of travel patterns using cluster-ing methods. Xiaolei et al.[MWW+13] uses density-based clustering to identify travel patterns, 14
along with partition based clustering to classify travel regularities. Travellers’ information is ob-tained from smart card data collected, which contains spatio-temporal characteristics of each trip 16
chain. Based on these chains, this work applies clustering algorithms along with rough-set theory to cluster and classify travel pattern regularities. 18
A density-based approach is also used by Zheng et al.[ZLZC11] to discover tourist regions of attraction based on photography location patterns. Photos from Flickr have temporal and ge- 20
ographical meta-data, and so this geo-tagged data is used to find photographers’ spatio-temporal paths. Using a dataset with geo-tagged photos, with the aim to find people’s travel patterns within 22
a local tour destination, results in a statistical dataset of peoples’ trails to identify regions of
at-traction. 24
Lee [LCL13] also uses geo-tagged photographs from Flickr and its spatio-temporal charac-teristics to investigate association between points-of-interest(PoI) through the analysis of peoples’ 26
travel paths from one PoI to another, resulting in a study that reveals PoI that are frequently visited along with other PoI. This work is also based on the use of a density based method. 28
Summarizing, the literature suggests that the main approach to find spatio-temporal pattens is related to partitioning and density based algorithms. Thus, in the following section we will 30
describe the most relevant types of cluster analysis used in the literature regarding travel patterns and travel prediction, along with a detailed examination and description of the most relevant algo- 32
rithms.
34
Partitioning Clustering
Partitioning algorithms organize a given data set into a previously chosen number of uniform 36
clusters. The partitioning method creates an initial partitioning, and then iteratively "attempts to improve this partition by moving objects from one group to another" [Jia06]. After the last 38
to another clusters. This similarity is calculated based on a distance function and the cluster is
2
formed to optimize a partition criteria.
The most commonly used and well-known algorithm for this method is k-means. [Jia06]. "The
4
k-means algorithm takes the input parameter, k, and partitions a set of n objects into k clusters so that the resulting intra-cluster similarity is high but the inter-cluster similarity is low" [Jia06]. This
6
method defines a centroid or center of gravity as a mean value of the objects in a cluster, and thus comparing the distance of each point to the centroid, assigns it to the most similar cluster based on
8
that distance. This process iterates until the criterion function converges, and the calculus of the variation inside the cluster to calculate cluster quality in each iteration is defined by a square-error
10 criterion, defined as E= k
∑
i=1 k∑
p∈Ci |p − mi|2 (2.1)Above, E is the sum of the square error for the whole data set; p is an object of cluster Ci. mi 12
is the mean of the cluster, therefore "for each object in each cluster, the distance from the object to its cluster center is squared, and the distances are summed" [Jia06]. This results in k clusters,
14
each as inner compact and separated from each other as possible.
16
Density-Based Clustering
Clustering methods based on density are those that search areas of higher density, and define a
18
cluster as being the objects on those areas. To separate clusters, these methods search for regions of low density. Thus, the algorithms that follow these methods can be used to filter noise (outliers),
20
allowing the modelling of clusters of arbitrary shape, being suitable to problems where the limit to circular clusters can be a constraint.
22
DBSCAN [SjRkG13] is the most well-known and used density-based methods "that grow clusters according to a density-based connectivity analysis" [Jia06]. This method is based on data
24
intensity. It searches for areas of high density, and makes clusters of objects of those areas. This search is done with two parameters, a given area (Eps) of a ε-neighborhood and the minimum of
26
points contained in the ε-neighborhood (MinPts) [LCL13]. If the ε-neighborhood of an object contains at least MinPts, then this object is named core object [Jia06] and it’s part of the cluster.
28
A point p1 is directly density-reachable from a point p2 if it is within the Eps area of the
ε-neighborhood and if Eps has at least MinPts. If there is a sequence p1, p2... pn, where p1=pand 30
pn=q, and each pi+1 is directly density-reachable from pi, then p is density-reachable. A set of
density-reachable object forms a cluster.
32
If the input Eps and MinPts are appropriately defined, this algorithm is effective finding clus-ters of arbitrary-shape. The computational complexity of DBSCAN is O(n2), where n is the
num-34
with O(n log n). 2
2.5
Relevance in information retrieval
Information retrieval (IR) is an interdisciplinary research field that includes, among others, rele- 4
vance rankings, search engines and evaluation measures. IR systems are the "predecessors of Web and search engines" [ZN14], designed to retrieve documents and digital collections. In IR, similar- 6
ity is used to measure semantic and syntactic similarity, comparing meanings or syntax [JRK13], and its ranking algorithms are used to obtain "high-recall documents" [ZN14]. These measures 8
constitute a classical approach [JRK13] to information retrieval, being applied for the course of many years with increase in the spatial information (geographic) domain [SCH08]. 10
Information retrieval is "about computing the degree of relevance between a set of objects and the search parameters" [JRK13], and its major appliance is related to web search engines [ZN14] 12
using user-specified keywords and returning lists of web pages sorted by relevance to the user query [ZN14]. This information can be entered directly, through keywords, or inferred from im- 14
plicit data and used for the relevance rankings [SCH08].
These concepts can be aligned with this work’s problem. The degree of relevance could be 16
measured between travel validations provided from STCP for this research, given that the full travel path could be inferred to be able to match against the ones from the remaining travellers. 18
Through the bus network data collected in the context of this project [Nun12], with data from bus routes and bus stops present on the bus network, and taking advantage of the attributes on the 20
validations data, like boarding location and number of zones allowed to travel with that card, the full journey of the passenger can be estimated and an algorithm to measure the relevance between 22
the travels can thus be created. This way, the concept of relevance could rank each travel path, matching against the others and score through relevance measures, resulting in a list of high-recall 24
passenger travels for each computed travel path, i.e, the "input-query" of the relevance scoring. The adaptation of the information retrieval relevance ranking concept to our work and the 26
detailing of its main features and attributes are presented further on this document, on chapter4.
2.6
Summary and Conclusions
28Data Pre-Processing is of major importance to the final efficiency of the results obtained, and its methods application needs to be carefully studied according to the work’s dataset. 30
Trip Inference is the subject of inferring, for each trip segment of one traveller, its origin or destination (or both if both needed). This process, as an inference, often relies on premisses 32
assumed true to obtain effective results. This work’s data is entry-only, thus to estimate trip des-tinations, some assumptions had to be made based on the literature. This process will be detailed 34
The process of clustering, i.e, grouping of similar data within the same cluster, and at the
2
same time dissimilar from data in the other clusters has wide applications, and can be used as a stand-alone data mining tool or to pre-process data for other algorithms.
4
Clustering methods used to travel patterning found in literature can be classified as partitioning or density-base. Some may belong to more than of of these categories.
6
Partitioningmethods divide a set in k partitions, and iterates to improve partitioning moving objects among groups.
8
Density-based methods groups data based on density, and creates clusters according to the density of its neighborhood.
10
The problem of pattern identification and the need to find similarities between the patterns of travellers was studied and considered as one where clustering techniques would be used. To use
12
these techniques, a distance function is used in order to define the similarity between the different objects in the dataset, to result in the final clusters. In particular, to cluster based on geographical
14
distance - through DBSCAN - this distance signified the distance between the location of two points.
16
Furthermore, using this clustering technique for the two columns "origin location" and "des-tination location" would answer the question "Which travellers board and arrive in similar
loca-18
tions?", and would need two distance functions, one for each column (origin and destination). This approach involves two main issues. First, the answer to the previous question does not
20
provide the wanted relation between travellers full paths, but only clusters from each passenger boarding and destination locations. This happens mainly because through clustering the main goal
22
is to group a set of points, whereas in our problem we have a sequence of points that result in a path for each traveller.
24
Second, each distance function results in the calculation of a dissimilarity matrix, that consists on the set of distances between the observations on the dataset that is used to find the most similar
26
(less distant) objects to create one cluster. The size of these matrices is the number of records being clustered, and in our work we have sets of millions of records, with thousands for each day
28
of the month. Computational and memory wise, computing this matrices would result in huge amounts of memory being used and thus not realistically possible for our dataset.
30
These two main problems resulted in an approach to the problem that would not be directly related with the clustering algorithms. Along with the similarities found in the concept of relevance
32
ranking on the Web search engines, a new concept was decided as the way to solve our problem: relevance among user travels. This concept is detailed in chapter 4.
Travel path inference
4
This chapter presents in detail the first stage of development on this thesis, the inference of travel paths from riders validations in an open system.
6
The next sections provide deeper analysis on the needed data and its essential attributes, data pre-processing and transformation needed to guarantee data quality and the proposed solution
8
along with its main decisions.
In the last section, the obtained results are analysed and a evaluation solution is proposed,
10
based on a simulated dataset with previously known real destinations and a comparison with the ones obtained through the destination inference procedure provided.
12
3.1
Introduction
Being an open system, Porto public transport system Andante requires validation only at entrance
14
on the system, meaning that riders board vehicles through the validation of their cards and then leave at their desired destination. Consequently, information regarding passengers travel path is
16
found incomplete, since we don’t have the destination, and thus obtaining similar travel patterns becomes a task not doable in these conditions.
18
Regarding this problem, a solution is proposed on the next sections. Given a day, the data from Andante system for bus riders validations is able to provide all the travels for each traveller,
20
for that day. Knowing this, the goal is to obtain an origin-destination matrix that will provide, for each travel validation found in the training dataset, its estimated destination.
22
To achieve this, an algorithm is proposed based on [BNRS02], with some innovative steps developed in the context of the project this work relates to [Nun12], and implemented as part of this
24
thesis, such as zonal verification, and other additional work not found in the literature [NDGC14a]. Through the proposed solution the goal of obtaining riders’ travel paths is achieved and therefore
26
The next section provides detailed explanation on the architecture of the proposed solution to 2
the travel path inference.
3.2
Architecture
4Three major components are part of the travel path inference, seen in figure 3.1: the datasets with validations and Andante network data, data pre-processing and the origin-destination matrix 6
inference algorithm. Validations Andante network data Pre-processing Origin-destination matrix inference Origin-Destination paths
Figure 3.1: Travel inference architecture
The datasets of validations and Andante network are part of a MySQL1 local server, used in 8
this work to feed the algorithms. The database used was MySQL since, in addition to being an open source technology, has great scaling capabilities and is able to support stored procedures. 10
To pre-process the data MySQL procedures were created, allowing transformation of the datasets. Using SQL allowed working with the database in a more efficient way in order to improve 12
the following implementation of the origin-destination inference algorithm. This algorithm, de-veloped to infer each travel destination, was implemented using the Java programming language. 14
This choice was mainly influenced by its class-based and object-oriented structure and since it runs in any Java Virtual Machine (JVM), it is cross-platform and it compiles regardless of the computer 16
architecture, making it very flexible. Using Java, the algorithm can use its capabilities to collect and store in memory all the data from the database as objects, speeding the process comparing to 18
the execution time it would take using a procedure language through SQL.
The final result is a new dataset with mandatory validation attributes and the inferred
desti-2
nation as a new one. To store the inferred set of travels the same local MySQL database was used.
4
The next two sections provides detailed description for the datasets used and each of its essen-tial attributes in order to allow the reader to be able to have a better understanding of the proposed
6
methods, along with the necessary data transformation procedures to guarantee incorruptions on the identified attributes.
8
3.3
Data description
Each time one traveller validates his card, a series of data is registered and recorded in the STCP
10
system’s database. This is data containing information regarding a set of components, many of them needed in the context of this work. In order to use this data for research purposes, STCP
12
gently provided a dataset of nearly 30 million ticketing validations, each record obtained in real-life travels with the needed attributes.
14
Below are listed the main attributes extracted from each of the dataset’s records, from vehicle data to card information, along with a succinct explanation of its role in our work:
16
• Vehicle number: serial number of the vehicle, one of the attributes necessary to identify one full journey along with journey start time;
18
• Journey start time: starting time of the vehicle’s current journey, one of the attributes neces-sary to identify one full journey along with the vehicle’s number;
20
• Serial Number: card’s unique serial number, responsible to identify anonymously each pas-senger in the system;
22
• Ticketing type: defines what kind of ticketing this card follows. At the time when these val-idations were registered in the system, there was more than one ticketing system in service.
24
In this work, only the Andante zonal system was analysed.
• Number of zones: gives how many zones this card’s current travel is allowed to run. As
26
described in appendixA, the number of zones can be 2 (Z2), 3 (Z3), until a maximum of 9 (Z9) zones [STC14];
28
• Route: vehicle’s current route, composed by the current line and direction, necessary to identify the current travel;
30
• Start stop: stop where the traveller validated his card, composing the current travel along with route;
32
• Validation time: time of validation at the start stop, provides data necessary to infer destina-tion time;
• Zone: zone of the current validation, i.e, zone where the start stop belongs. Used to validate 2
the destination stop zone;
All this data concerns users’ validations and is of critical importance for this work. Further- 4
more, information on the routes and stops of the Andante network has already been collected in the scope of this project [Nun12] and was used to map with the validations’ data, namely: 6
• Lines: Contains the total of 85 lines of the Andante network and its unique identifiers;
• Stops: Set of 2534 stops in the Andante network, including bus, metro and train, with 8
information regarding its name, location, unique code and Andante zone.
• Route stops: Mapping of all the stops with the lines to which they belong, with the sequence 10
of each stop, allowing to obtain the ordered path of bus stops for each route. One route is defined by the line name and its direction, with at most two directions per line. Contains 12
5664 records, including bus, metro and train.
The above data is mandatory to get results from the implemented algorithms. Furthermore, 14
data with corruption in any of these attributes or irrelevant information like data regarding metro and train systems, provided imperfections on future stages of work. The following section analyses 16
deeper this constraints.
3.4
Data pre-processing
18From the nearly 30 million records provided by STCP for this research, from this stage onwards we will only consider data from January, mainly due to the high amount of data. 20
At the time the data was collected, Andante was not the only mandatory card system at STCP. Because the proposed algorithm points towards the system running nowadays, early data analysis 22
and comparison was mandatory - data from other systems couldn’t be verified by the proposed zoning verification step on the inference algorithm, and so imperfect data would lead to imperfect 24
results. This way, a study was made for the validations of January - seen in appendix A- in order to be able to assure that using only the Andante records would still provide enough quality data to 26
feed the algorithms. From this study, the conclusion was that 35% of January’s travels belonged to bus riders using the Andante ticketing system and those validations provided good quality data. 28
Thus, validations from other ticketing systems were discarded as they were not relevant to this
study. 30
The Andante sample needed proper examination and pre-processing to find any possible flaws in the validations that could lead to incorrect results and conclusions. One of the factors of greatest 32
concern was related with the volatility of the routes and stops at the STCP system, since routes paths and/or stops from those lines are subject to frequent changes. This impacts our work because 34
the collected data dates from 2010, while the sets of routes and stops were gathered at the time of this work, in 2013, resulting in possible inconsistencies among the data.
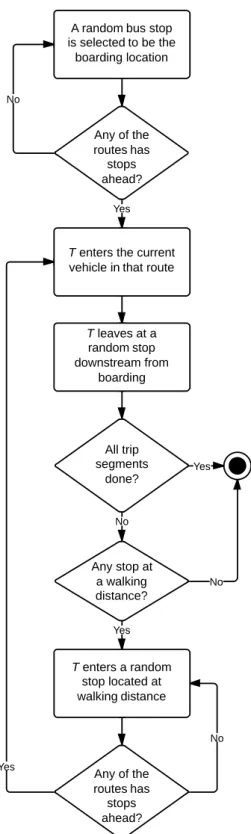
Therefore, a pre-processing procedure was implemented, as seen on the diagram on figure 3.2,
2
aiming to efficiently process the data in a way that, in the end, the resulting validations would be the most correct for the algorithm training. The entire process is now described and its result on
4
the validations dataset can be seen on figure3.3.
Figure 3.2: Pre-processing procedure flowchart
The first step of the dataset processing passed by the verification of missing attributes. After
6
reviewing the dataset, the key fields were defined - as seen on3.3 - and so records with any of those attributes missing or corrupted were discarded from further processing. At the end of this
8
step, 3% of January’s validations were discarded.
After these verifications the datasets were cleaned of imperfect and missing data. Afterwards,
10
two more situations were identified on the validations set: unmapped bus stops and routes. This could happen because, as explained before, the STCP system is quite volatile, meaning that on a
12
short time interval routes could change its course, bus stops could be added to another route or removed from previous ones or even bus lines or stops set aside from the network. This happens
14
other short/medium-time impediments on the roads that happen frequently in a city. This results 2
in outdated datasets from one year to another (or even in shorter spans), and in this work the difference is of major importance - from 2010 to 2013. To achieve this verification, a cross search 4
between the 2010 validations set from January and the 2013 data for bus lines and bus stops was performed. Validations whose stop or line were no longer found in the network were thus 6
discarded. This stage cleaned 18% of incorrect records relatively to the original dataset.
Finally, when all the verifications defined to clean the data were performed, the last data need- 8
ing filtering was related to duplicate validations. Duplicates are cases in which users validate more than once while in the same vehicle in the same journey. One of these situations is related 10
to the time of travel, since when validating the card the machine presents the time left, and so the passengers sometimes validate more than one time to check on the remaining time. This way, 12
was decided to previously remove that data in the pre-processing stage since these records were providing incorrect results. Although the result was a total of only 0,3% removal on the January 14
set, this records provided unnecessary complications for the origin-destination algorithm.
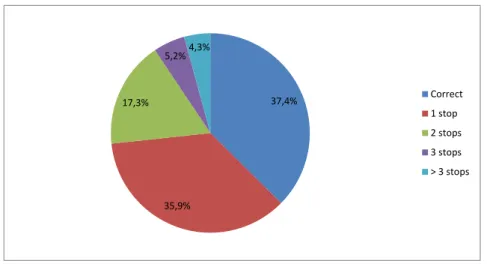
2,9% 21,0% 0,3% 75,7% Missing attributes Mapping failure Travel duplicates Valid records
Figure 3.3: Pre-processing results for the validations dataset
Now that the data was pre-processed and cleaned of record imperfections and potential misin- 16
terpretations, the final result was a total of around 2.4 million validations on the January month,
supported by 74 bus lines and its 2120 bus stops. 18
3.5
Origin-Destination matrix inference
3.5.1 Class diagram 20
To implement the algorithm to infer travellers’ destinations, a set of necessary classes were im-plemented in order to follow the object-oriented programming defined as the approach to this 22
problem. Using Java’s class-based and object-oriented capabilities, and recurring to the data from the datasets to create the objects, the classes seen on 3.4formed the main part of the program.
Figure 3.4: Origin-Destination inference class diagram
Four major classes were created: Validation, Line, Stop and StopLine. Follows a brief
descrip-2
tion for each of them:
• Validation: A Validation object was created for each traveller, with its mandatory members
4
and the respective getters. An array of validations is created to hold all the validations in memory, and through getStopLine() we obtain the respective StopLine from the
linhaPub-6
lico, sentido and paragem fields originally on the validation dataset.
• StopLine: Because each line may have multiple stops and each stop is assigned to multiple
8
lines, this class helps to map them to one another and define the sequence of the stop on that route. An HashMap is used to hold all the "StopLines" in memory, mapping for each line
10
its respective array of stops.
• Stop: Each stop from the bus network is loaded to memory creating an object with its
12
ticketingCode, that maps to the code system present on the Validation, its visibleCode which defines the "known" code on the Andante network, the zone in which it is present and its
14
location coordinates.
• Line: Each line object contains the line name and direction, being that each line may have
16
at most two directions (some have only one as they are circular).
Furthermore, to help in some methods two other classes were created, MySQLConnection and
18
several Arrays in memory. Recurring to the MySQL packages from Java, this class executed all 2
the SQL queries and thus was essential to create the all the objects for the validations, lines and
stops. 4
The second one was needed to write the final set of inferred validations to a CSV file to import later to an MySQL table. This decision was made due to the high number of transactions 6
that would be made while computing the algorithm if the travels were immediately inserted in the database as soon as computed, slowing the process. Writing to an CSV in the hard drive 8
beforehand became a more efficient way to handle the high amount of data.
3.5.2 Nested loop structure 10
To run through all the validations in the dataset, this nested loop structure was adapted from a study by Zhao et al. [ZRW07] in the context of this project, and was used to aid the implementation of 12
the algorithm. For each serial number (SN), for each day, the algorithm should be able to infer all its validations, one at a time. To that purpose, three nested loops were determined: the outer 14
loop cycles through each SN, the middle loop through each day and the inner loop through each validation (flowchart in figure3.5). In other words, for each SN, for each day, we can infer all its 16
validations, one at a time.
For this principle, the entire validations dataset was sorted with two main keys: using the SN 18
as primary key and the day as secondary key. Furthermore, all the validations were sorted by date of validation, resulting in a dataset of validations in which for each serial number, and for each 20
day, the validations are sorted from the beginning to the end of the day, providing the needed daily travel history. This sorting became mandatory because of the consecutive trip segments method 22
used in the algorithm. This method has as base idea that "a high percentage stay at, or return to, the destination station of their previous trip segment to begin their next trip segment" [ZRW07]. 24
Following this, four assumptions were established, adapted from [BNRS02], in order to take
into account the specificities of this work: 26
• There no other transport type (public or private), except bus, between trip segments;
• There is a limited amount of distance that can be made by passengers on foot, i.e, after 28
leaving one bus, the passenger will not walk a too long distance to the next station (trip segment). In this work, it was assumed as 640 meters, or 8 minutes on foot at 4,8 km/h, 30
speed used to calculate the public transport accessibility level (PTAL) [fL10]. This distance is considered as the maximum walking distance for bus stops in the Great London and is 32
used as a reference for this work;
• The best estimate destination for one trip segment is the stop closest to that passenger’s next 34
origin (if within walking distance);
• The last trip of the day has as destination the origin of the first trip of the day. In other 36
words, the assumption is that at the end of the passenger’s day, his last trip is the return to where his day began.
Figure 3.5: Nested loop structure adapted from Zhao et al. [ZRW07]
3.5.3 Distance-to-Stop matrix pre-calculation
2
The destination inference procedure studied in this work requires knowledge of the closest stop to some identified target location. Each stop is identified mainly by its unique network identifier and
4
from the geo-spatial coordinates (latitude and longitude). Calculating this closest stop for each of the validations can become costly, and if this distance calculation would be computed for each of
6
these validations the computation would not be nearly efficient [Gor12].
Rather than doing this for each validation, distance between stops are calculated only once
-8
from each stop to all stops. If the calculated distance is superior to the maximum on-foot distance (640 meters), it is discarded. This way, previously identified non-selectable stops won’t delay the
10
![Figure 4.3: Real-time full process overview for the passenger process when using the applica- applica-tion [NDGC14b]](https://thumb-eu.123doks.com/thumbv2/123dok_br/18895914.934600/58.892.120.742.444.952/figure-real-process-overview-passenger-process-applica-applica.webp)
![Figure 4.4: Comparison between relevant and non-relevant travels for one passenger [NDGC14b]](https://thumb-eu.123doks.com/thumbv2/123dok_br/18895914.934600/59.892.153.788.472.835/figure-comparison-relevant-non-relevant-travels-passenger-ndgc.webp)