Web LogVisualizer for Communication and Information Management
José Nunes
Dep. of Communication and Art, University of Aveiro, Portugal [email protected]
Florin Zamfir
Dep. of Computer Science, University of Craiova, Romania [email protected]
Óscar Mealha
Dep. of Communication and Art, University of Aveiro, Portugal [email protected]
Beatriz Sousa Santos
Dep. of Electronics and Telecommunications/IEETA, University of Aveiro, Portugal [email protected]
Abstract
This paper describes an application intended to help a usability specialist to analyze a web site. Details like the site map, page information distribution and hotspot location on the pages, for the general site view, but also information like site statistics and user session selection and analysis are offered to the user. In the single session analysis, if more information (like mouse or eye tracking information) is available, it can be added to the information extracted from a LOG file and used appropriately.
Key Words: System Usability; Data Visualization; Web Logs; User Graphical Interfaces;
Communication and Information Management.
1. Introduction
Technologically mediated scenarios are becoming more and more pervasive in the day-to-day activity of a growing number of individuals and institutions. Specifically, internet/web technologies and services have a strong presence in institutions worldwide. Internal web sites (intranets) are developed in conformance with internal communication strategies, and reflecting internal information and workflow. An emerging problem concerns the management of these constantly growing intranets/extranets. Organizational communication specialists lack the efficient tools to analyze (activity and behavioral patterns) and understand what is really going on inside the institutions. Answers for what’s wrong or right and why, usually are not delivered by traditional web analysis instruments [Tauscher and Greenberg 1997], [Bieber et al. 1997]. In fact, these instruments tend to be biased by classical technical metrics, in most situations, for technical tuning and not for organizational communication and information analysis. Unfortunately, information and communication systems design nowadays are not always user compliant, in fact too many times users are asked to get more and more training in order to use
technology. Doesn’t look like this process is inverted? Shouldn’t the effort be in system design, in order to adapt technology to the various user singularities and consequently induce on an overall efficient system usage?
Personal computer (PC) technical literacy should not have anything to do with everlasting change in operating systems, architectures and applications. Where is the coherency of the information and communication system business? Why doesn’t the PC market take some lessons from game console strategies, in terms of easy of use? Do kids have to get engaged with long lasting training programs to use their game consoles? These are also hi-tech devices, and it is very common to find the latest evolutions of the technology included on these game consoles.
Efficient analysis and diagnostic tools must be designed to cope with these sophisticated network environments. The problem lies in identifying user-system mismatch at the human-computer communication level, which must be rigorously identified, and problems pinpointed to the design team. The system must serve the organization, adapt perfectly to its internal communication strategies, and sustain efficiently its information and workflow patterns. Good feedback instruments on problem identification are fundamental.
The human-computer communication process is very complex and difficult to evaluate. When it is needed to evaluate the information and workflow patterns, there are new challenges to face, and extra variables to evaluate and analyze.
Users must be able to use the internal/external organizational information and communication systems in a “minimal cognitive effort” state of mind.
This work describes a prototype and its conceptualization process. The proposed instrument is supposed to analyze, on a usability perspective, some details about web site usage. The main target is an organizational web site comprising information and synchronous/asynchronous communication features. Inherent to the analysis process, and besides site architecture, are user behavioral issues. It is intended to be possible to explore in at least three different perspectives:
1) Site structure/architecture, allowing exploration/browsing on a goal based
orientation;
2) Statistical information collection and analysis base on 2D/3D visually formatted outputs;
3) Identification of user session for individual and multi-session selection and detailed analysis of the selected session.
This instrument can also be used to make some analysis on a user session from a controlled experiment, where it could be possible to capture and analyze added information like eye gaze tracking, mouse movement tracking or even other biometric information.
The main goal resides in producing a complementary tool to empower decision-making concerning system design problems or organizational communication and information management.
In section 2, the goals of this work and the methodology to get them will be discussed. Then, in section 3, the conceptual model for the visualization process of a web site will be presented. Later, in section 4, the conceptualization of a prototype will be explained. Finally, in section 5, some details about the prototype will be given.
2. Methodology and goals
The conceptualization and prototyping of an instrument capable of helping in the management of organizational communication and information scenarios has to be situated in a
trans-disciplinary approach. Expertise related to server technologies and instruments will have to be taken into account and possibly integrate other usability analysis and registration instruments. The proposed tool is directed to management staff with conditioned technical literacy. The adoption of a visually oriented interface, comprising statistical visually formatted outputs, is strategic in terms of efficiency of use with high learning rates, aiming at an optimal complementary diagnostic tool. Expertise for the elaboration of the various visualization schemes is directly related to the scientific visualization representation and visualization area. The use of direct manipulation techniques in the interface interaction procedures could be particularly useful when associated to a statistical visually formatted feedback, used to inspect and analyze individual and organizational communication and information behavior patterns. In the sequence of this conceptual framework some specific goals can be enumerated:
i) The final technical instrument must:
• Represent a coherent and integrated interface environment for the
minimization of context loss through the synchronization of different views of the information [North and Schneiderman 1999], [North and Schneiderman 2000];
• Be a robust management tool in terms of multi-platform server technology input and flexible goal-result inspection output;
• Be flexible in order to comply with later server data
enhancements/upgrades, at the input level, and with new inspection methods and/or techniques, at the output level.
ii) The interface for manipulation and analysis procedures should use a direct manipulation approach [Schneiderman 1998, pp.186-229];
iii) The various functions and tools must be designed according to the correlated visual inspection strategies [Tufte 1994];
iv) Statistical output must, preferably, be done in an integrated visual environment [North and Schneiderman 1999], [North and Schneiderman 2000], using color code schemes, coded 2D/3D objects and be based on spatial occupation and distribution rules and schemes inherited from traditional scientific visualization [Catarci and Cruz 1996], [Card et al. 1991], [Robertson et al. 1993], and new Web site visualization techniques [Eick 2001], [Cugini 1999];
v) The various analysis and visualization schemes adopted must be easily used to support decisions [Mealha et al. 2001];
vi) Complementary data can be obtained from specific usability measurement technological instruments (e.g. eye gaze, mouse tracking, etc), and can be used to enrich session analysis;
3. A Conceptual Model
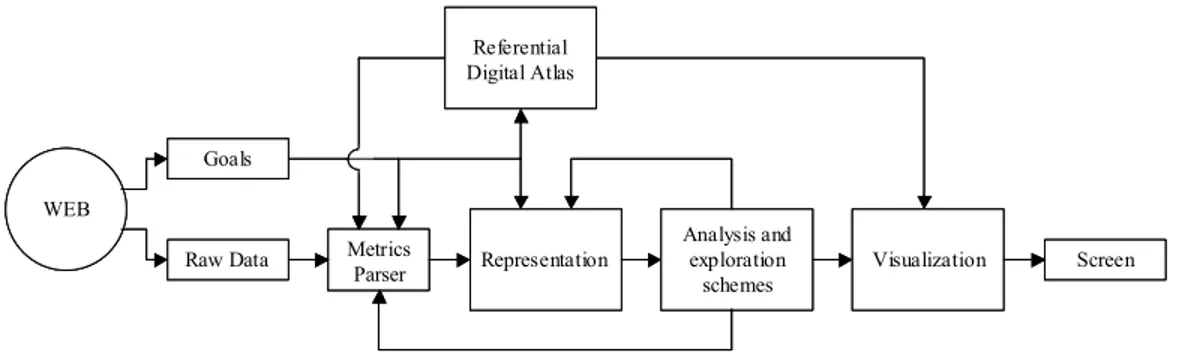
The proposed tool is an implementation of a conceptual model for the visualization process, shown on Figure 1. The following blocks can be identified:
• WEB – Web site and its pages;
• Goals – What is wanted, the objectives of visualization;
• Raw Data – LOG data, obtained from the Web server, which contains unprocessed information about web site usage;
• Referential Digital Atlas – A database containing information concerning every web site page. This information must be compiled previously, and is produced from web site data;
• Metrics Parser – Module that parses the raw data using a metrics modulated by the Goals, the Referential Digital Atlas and the Analysis and Exploration Schemes; • Representation – The parsed data will be represented in a way that depends on the
Goals and the Analysis and Exploration Schemes;
• Analysis and Exploration Schemes – The representation of data will be subject of some analysis and allows the user to use some exploration Schemes;
• Visualization – The analyzed and explored information will be combined with the Referential Digital Atlas to produce the final image that will be presented to the user;
• Screen (Display) – The produced image is presented to the user screen or display.
WEB
Goals
Raw Data Metrics Representation Parser
Referential Digital Atlas
Analysis and exploration
schemes Visualization Screen WEB
Goals
Raw Data Metrics Representation Parser
Referential Digital Atlas
Analysis and exploration
schemes Visualization Screen WEB
WEB
Goals Goals
Raw Data
Raw Data Metrics RepresentationRepresentation Parser Metrics Parser Referential Digital Atlas Referential Digital Atlas Analysis and exploration schemes Analysis and exploration
schemes VisualizationVisualization ScreenScreen
Figure 1 – Conceptual model for the visualization process of a site.
The model begins with the web site to be analyzed. It contains all the information available to the site user (pages).
First, it is necessary to build the Referential Digital Atlas, using the information available on the site. This Atlas should contain a detailed description of every component on every site page. All objects, information blocks, links, etc., should be properly identified and classified. This work is done only once per site. After that, it can be used for all the visualizations needed afterwards.
Usually, web servers can be configured to produce some kind of LOG files. These files could contain details about every request processed by the server. The more common information logged is: date and time of the request, file requested, who has done the request, referring information, some information concerning the request and server status, and some details about the client (identity, browser, etc). Some times not all this information is available to the server, and other times the server is configured to log only part of it. The information is logged into a text file, usually a request by line, which must be processed to extract all the needed details about the request.
The goals are the objectives of the visualization defined by the application user (the one’s analyzing the site); they depend on the web site being analyzed, and have some impact on the information needed by the referential digital atlas. Different goals imply different needs of information, which means a different set of information needed by the referential digital atlas. When the goals are changed, some properties in the parser and/or some metrics are certainly
also changed. Another aspect that can be changed as well, is the representation used to the processed data.
The Metrics Parser is the block responsible for parsing the raw data obtained from the web server log files, applying some kind of metrics and sends the processed/formatted information for representation. The parsing process depends on the format of the raw data, and on what information is needed for the remaining blocks. During the parsing process, some metrics defined by several factors will be applied: the goals, the referential digital atlas, and user settings (applied at the analysis and exploration schemes module).
The representation module, converts the data sent by the parser module into some visual representation. The way the information is represented depends on the goal specification and on the manipulation the user has done (at the analysis and exploration schemes module).
The analysis and exploration schemes module captures the user interaction so that it is possible to change some parameters to obtain different visualizations of the same data. When the user selects a page from a user session, this module is responsible for changing the metrics parser parameters (e.g. to select the appropriate page), as well as the representation (e.g. from a list of pages to a detailed page view).
The visualization module is responsible for the construction of the final image, taking the information manipulated by the analysis and exploration schemes module and mixing it with the information kept in the referential digital Atlas.
Finally, the image is ready to be displayed to the user.
4. Conceptualization of a prototype
The prototype application is a simple usability visualization tool for analyzing web sites from the point of view of the site manager that tries to observe the site users behavior.
The application offers three major functionalities:
- The analysis of the entire site where the application user can get information about the hierarchical structure of the site and a complex analysis of each page of the site; - A statistical analysis of how users are using the site;
- The analysis of a single user session.
Each of these three parts is presented in a way that gives the application user the possibility to get some feedback and simple statistical observations about how the site users are using it. The site analyzer offers the application user some information about the site structure and the possibility of performing a detailed analysis of each page of the site.
The statistical analysis gives the opportunity to analyze the way site users are browsing the site under study. Details like how users get into a page, what links they use more on that page, the most visited page on the site, the more common path that users take to achieve a goal can be obtained through this statistical study. This information is presented in an innovative way, allowing the connection with the site structure whenever needed.
The single session feature gives the application user the possibility to analyze how a single user browses the site. Here it is possible to find information about how the user follows the page links, how s/he moves the mouse cursor, how s/he moves the eyes, etc., if this information is available. The visual representation of the hotspots list, mouse and eye movement traces is expected to help the web site designers to solve some usability problems.
5. The Prototype
Currently, a prototype for Windows platform is under development, using MS Visual C++, which implements part of the model presented in previous section. Next this prototype will be briefly presented, showing its capabilities and presenting some illustrative screen capture pictures.
Before the application can be used, the user is prompted to introduce some details about the site under analysis. After that, the application is ready to start and show some results to the user. The results are organized in three major categories: site, statistical and single session analysis. Each category has some different views, which can be selected to get the corresponding sub-window (inside the application’s main sub-window). Figure 2 is a manipulated view of the application in order to show the available options.
Figure 2 – Available view options.
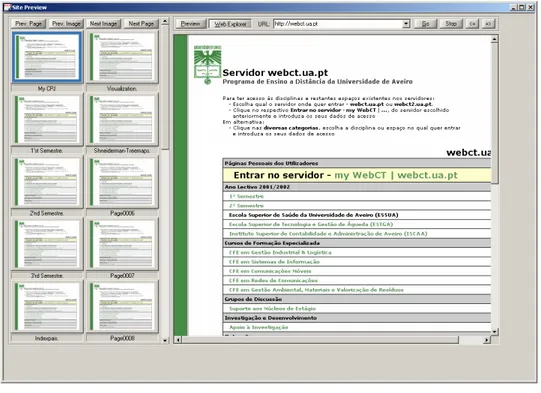
Figure 3 is an example of site preview. This view has two areas: on the left all the site pages are viewed in a reduced scale; on the right the selected page is displayed in full scale. If necessary, it is possible (pressing a button) to switch from the pictures to the “real” web page, since the application has a real web browser embedded.
Figure 3 – Site preview.
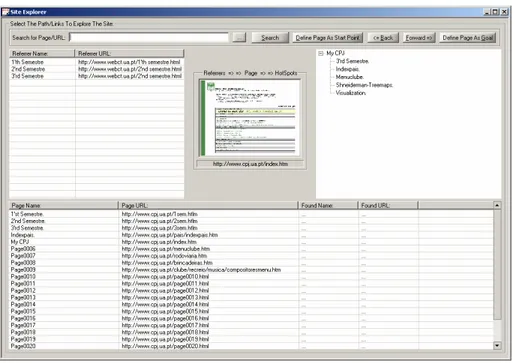
Another way to explore the site is offered to the user through the Site Explorer. Here, it is possible to identify two main areas. In the top half, the selected page is displayed in the middle
of the list of all links in the page (on the right) and the list of all identified referrer pages, pages that have link pointing to this page (on the left). In the bottom half, a list of all site pages is displayed. Figure 4 gives an example of how this view can look like.
Figure 4 – Site Explorer.
Figure 5 – Site Statistics.
The application also allows some statistical analysis of the site usage. Figure 5 shows an example of results obtained on such analysis. Here it is possible to choose between some statistical analysis and select what results should be presented either textually or graphically.
The obtained results could correspond to the entire site or only to a selected page. In this way, it is possible, for instance, to identify what are the most used links of a page.
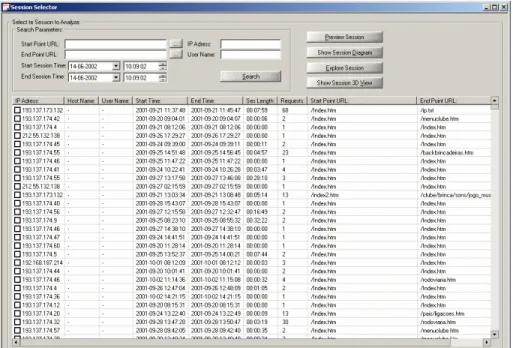
The first step to use the Single Session is to select a session. The Session Selector shows all the identified sessions and allows searching for a particular session. Several criteria could be used on this search, as shown in Figure 6.
Figure 6 – Session Selector.
After selecting a session, it is possible to browse all pages inside that session using the Session Preview, which is similar to Site Preview but has some extra functionality. If extra information about selected session is available, then it can be selected and viewed superimposed on the page. Information like mouse or eye tracking can be acquired during usability experiments and viewed separately or together, as shown in Figure 7.
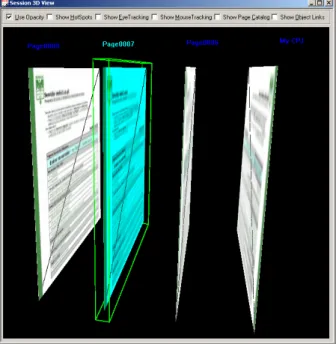
Figure 8 shows an alternative integrated 3D view of a session. This view could allow a deeper analysis to some aspects of page zones consistency, like user interaction, content type or where the site user spends more time reading/looking.
Figure 8 – 3D Session Viewer.
6. Conclusion and Future Work
It was described a conceptual model for a Web Log Visualizer. Currently the application implementing this model is under development and obviously it will be subjected to many changes after iterative evaluation.
Using the prototype briefly described in this paper it was already possible to identify, on one hand, some aspects that result easier with this application then with traditional approaches and on the other hand, some areas where improvement will be necessary.
Technologically mediated scenarios of communication can be analyzed and understood more easily with the help of tools like this one, since it allows a new point of view to the obtained data from a web server log file. The possibility to mix this information with the structure of the site and user-computer interaction monitoring data seems to be a big step toward a deeper understanding of the communication process, impossible with most available applications. We can already identify as future work the following enhancements to the presented tool:
• Site Diagram Views: site representations, like tree maps, are not suitable to all kinds of sites and further investigation is needed. Alternative 2D and 3D approaches would be developed and evaluated. The main objective will be to get a deeper understanding on the site contents and its distribution on each page.
• Statistical Analysis: it would be interesting to have more detailed information about session characteristics and user behavior during site navigation. 3D representations will be developed and evaluated for analysis of user navigation data such as different paths used and time spent to achieve a predefined goal.
• Session Analysis: it could be interesting to produce an integrated view of more than one session, to compare different users or the same user in different occasions. Once again, new 2D and 3D views could be interesting to get a better understanding of the relation between the information distribution inside a page and user behavior.
7. Bibliography
Bieber, M., F. Vitali, H. Ashman, V. Balasubramanian, H. Oinas-Kukkonen, "Forth generation hypermedia: some missing links for the World Wide Web", Int. J. Human-Computer Studies, 47, pp. 31-65, 1997.
Card, S.K., G.G. Robertson, J.D. Mackinlay, "The Information Visualizer, an Information Workspace", Proceedings of the ACM Conference on Computer Human Interaction, CHI’91, 1993, pp. 181-188.
Catarci, T. and I. F. Cruz (eds.), "Special Issue on Information Visualization", ACM Sigmod Records, 25(4), 1996.
Cugini, J. and Scholtz J., “VISIP: 3D visualization of paths through Web sites”, Proceedings of the International Workshop on Web-based Information Visualization (WebVis’99), IEEE Computer Society Press, Los Alamitos, CA, 1999, pp. 259-263.
Eick, S. G., "Visualizing Online Activity", Communications of the ACM, 44(8), Aug 2001, pp. 45-50.
Mealha, O., J. Nunes, B.S. Santos, "Modelo de Análise da Comunicação Humano-Computador: uma proposta", I Congresso Ibérico das Ciências da Comunicação, Málaga, 7-9 Maio 2001.
North, C., B. Schneiderman, "Snap-Together Visualization: Coordinating Multiple Views to Explore Information", University of Maryland Computer Science Dept. Technical Report #CS-TR-4020, 1999.
North, C., B. Schneiderman, "Snap-Together Visualization: Can Users Construct and Operate Coordinated Views?", Int. J. Human-Computer Studies, 53, 2000, pp. 851-866.
Robertson, G.G., S.K. Card, J.D. Mackinlay, "Information Visualization Using 3D Interactive Visualization", Communications of the ACM, 26(4), April 1993, pp. 56-71.
Schneiderman, B., Designing the user Interface: Strategies for Effective Human-Computer Interaction, Addison Wesley Longman, 1998.
Tauscher, L., S. Greenberg, "How people revisit web pages: empirical findings and implications for the design of history systems", Int. J. Human-Computer Studies, 47, 1997, pp. 97-137. Tufte, E.R., Envisioning information, Cheshire, Connecticut: Graphics Press, 1994.