Influence of Cryogenic Treatment on the Tribological Behaviour of AISI H21 Tool Steel
Dileep Koradea,b,* , Kavuluri Venkata Ramanaa, Kirankumar Jagtapb
Received: August 21, 2017; Revised: April 18, 2018; Accepted: October 03, 2018
The aim of the present work was to find out the optimum cryosoaking duration of deep cryogenic treatment to reduce the wear rate. The AISI H21 hot work tool steel specimens were hardened at 1195 ºC, cryotreated at -185 ºC for 6 to 30 h, double tempered at 540 ºC and soft tempered at 100 ºC. The hardness, impact toughness, wear rate and microstructural characteristics of the cryotreated specimens were studied. Wear test parameters were optimized by using Taguchi technique. Analysis of variance and signal to noise ratio were carried out in order to find significant parameters affecting the dependent parameter. The results show that load is the most influencing parameter followed by sliding velocity and cryosoaking duration. The linear mathematical model has been developed for wear rate using a regression analysis technique which will be useful for predicting results for new experiments.
Keywords: H21 tool steel, deep cryogenic treatment, hardness, impact toughness, wear rate.
*e-mail: dileepkorade@gmail.com
1. Introduction
The effective employment of heat treatments on tool steel depends on the ability of a material to meet service life requirements in engineering applications. The cryogenic treatment is one of the effective heat treatment usually employed after the conventional heat treatment. The cryogenic treatment has been categorized into shallow cryogenic treatment and deep cryogenic treatment (DCT). It has been reported that the wear resistance by deep cryogenic treatment is very high compared to the shallow cryogenic treatment1. DCT
improves not only the surface but also an entire cross-section of material or specimen or component2, with the objective of
improving the carbide distribution pattern, as this modification has a positive effect on hardness, wear resistance, fracture toughness by causing structural homogeneity3. Also, DCT
could improve the service life by improving the wear resistance of the tool steels1,4. The cryogenic treatment used as an add-on treatment to conventional heat treatment to improve the wear resistance of tools2,5.
DCT is presently employed for the various tool steels and in the fields like aerospace and manufacturing industries, sports and musical instruments, firearms, etc. for performance enhancement of various components made from the tool steels6.
Dhokey and Nirbhavne7 examined the effect of DCT on
AISI D3 tool steel and reported that the wear rate reduces by 93 % compared to the conventional heat treatment. Gao et al.8 concluded that the DCT for WC-Fe-Ni cemented carbides
reduces the wear rate by ≈ 56 % and increases hardness by 20 %. Das et al.6,9,10 reported that the application of DCT on
AISI D2 tool steel at -196 ºC for 36 h cryosoaking duration,
wear resistance reaches a maximum and deteriorated by further holding time. This might be due to refined size, increased the amount and density of secondary carbides, homogeneous distribution of fine secondary carbides and decrease in the retained austenite. The hardness of the cryotreated specimens increases marginally compared to the conventional heat treatment. Almost similar findings have been observed by Akhbarizadeh et al.11 for AISI D6
tool steel. But the inverse effect of DCT on the hardness of D3 tool steel has been reported by Dhokey and Nirbhavne7.
Shinde and Dhokey12 employed DCT on AISI H13 tool
steel at -185 ºC for different cryosoaking durations from 8 h to 32 h. It has been reported that the carbide density and hardness reaches a maximum at 16 h. The surface roughness and thereby wear rate affected by carbide density. Wang et al.13 employed DCT on bainitic steel. The obtained result
shows that the DCT improves wear resistance and mechanical properties (hardness, toughness, strength, and elongation). DCT eliminates unstable retained austenite which reduces the blocky martensite/austenite constituents and improves the stability of retained austenite. Koneshlou et al.14 observed
that DCT resulted in more uniform precipitation and fine carbide particles. Molinari et al.4 investigated the effect of cryogenic treatment on AISI M2 and AISI H13 tool steel. It has been reported that DCT improves the hardness and hardness homogeneity, diminishes the tool consumption and downtime of equipment for the tool set up, and reduces the cost about 50%. Dhokey et al.15 reported that the DCT enhance
the impact energy with the increase of hardness compared to the conventional treatment for both D3 and SAE8620 steel. For D3 steel, the impact energy is very less compared to the
aDepartment of Mechanical Engineering, Koneru Lakshmaiah University, Vaddeshwaram, 522002,
India
bDepartment of Mechanical Engineering, Sinhgad Institute of Technology & Science, Pune, 411041,
SAE8620 steel; it may be due to the more hardness because of the higher carbide density in D3 tool steel.
Nurbanasari et al.16 studied the double tempered
microstructure of AISI H21 tool steel consisted of tempered martensite, lower bainite, and carbides. The hardness after double tempering increases with increasing hardening temperature and decreases with increasing double tempering temperature. So double tempering temperature of the AISI H21 hot work tool steel should be carried out below 650 °C. Nurbanasari et al.17 investigated that the ferrite and Fe
3W3C
primary coarse carbides were present in H21 hot work die steel. It was noted that the hardness not only affected by the type and amount of carbides but also the size and distribution of carbides. The mean size of the primary Fe3W3C carbides
of as-cast H21 hot work dies steel were noted ≈ 0.3±0.1 µm. Nurbanasari et al.18 observed that after hardening at 1100 ºC
followed by hot deformation at 1000 ºC for H21 hot work die steel the most dispersed and finest of Fe3W3C carbides
with the average size of 0.2 µm.
Taguchi robust orthogonal design is a simple, systematic, reliable and more efficient tool for the test parameter optimization19,20. The Design of Experiment (DOE) combined
with regression techniques may be useful for modelling the behaviour of response functions depending on several parameters or variables. In order to develop mathematical models based on the experimental results, regression analysis is frequently applied21. This can be carried out in an efficient
way with less number of experiments without a loss of experimental data5,20,22,23. Taguchi optimization technique
is an effective technique for optimizing the desired outputs. Many researchers19,20,24 has developed the prediction model
for cutting force, surface roughness, wear rate etc. The AISI H21 hot work tool steel is used in applications like hot extrusion dies, hot blanking dies, hot forging dies, hot rolling mill rolls, hot punches, dummy blocks and die-casting dies for non-ferrous metals where dies are subjected to a very high load, contact pressure and wear, promote early failure of dies16,25.
In order to improve the service life of the dies prepared by AISI H21 hot work tool steel, different ways were suggested in the literature but the effect of cryotreatment has not reported yet. After conducting an extensive literature survey, it is observed that the most of the authors had taken a particular crysocking period for cryotreatment without optimising it. It is also observed that the optimised cryosoaking duration was different which affetcs the conclusions regarding the holding time of DCT for differnet tool steel materials. In the present investigation the attempt has been made to study the effect of DCT on AISI H21 hot work tool steel in terms of microstructural feature, impact energy, hardness and wear rate (WR). Also, the attempt has been made to optimize the
cryosoaking duration for AISI H21 tool steel. The Taguchi’s experimental design approach was used to optimize wear test parameters (applied load, sliding velocity and cryosoaking
time) and to find most significant factors and corresponding levels to improve wear rate. In addition to this, an attempt has been made to correlate the variation of wear rate with the hardness and variation in mean spherical diameter, mean inter-particle spacing and population density of carbides.
2. Material and Experimental Details
2.1 Material
The AISI H21 hot work tool steel was selected for the present work. The chemical composition of procured material was analysed by Optical Emission Spectrometer (Model: Metavision 1008i, Make: Metal Power India Pvt Ltd). The chemical composition of analysed material confirms to the AISI specification of H21 tool steel is shown in Table 1.
2.2 Heat treatment
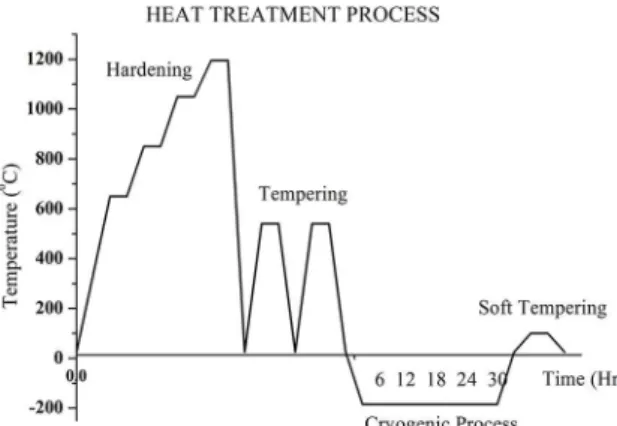
The prepared specimens were employed various heat treatments include hardening, double tempering, DCT and soft tempering as shown in Figure 1.
2.2.1 Hardening
Hardening of specimens was done in a vacuum furnace (Systherms, Germany) to reduce the oxidation of the surface of specimens. To reduce distortion, specimens were preheated before heating to the final hardening temperature25. The
hardening was done by controlled heating in stages of 650 °C, 850 °C and then 1050 °C, and finally 1195 °C for 10 min at each temperature. Subsequently, the specimens were quenched with uniform high pressure nitrogen gas to room temperature.
2.2.2 Tempering
Tempering of specimens was done in a vacuum furnace (Systherms, Germany). To improve toughness and microstructural stability, it is strongly recommended to temper hardened hot work tool steel at least twice25. After hardening,
specimens were immediately employed to first tempering
Table 1. Chemical composition of investigated AISI H21 hot work tool steel.
Elements Weight %
Observed Values AISI specification of H21 steel
C 0.30 0.30-0.40
Mn 0.39 0.20-0.40
Si 0.16 0.15-0.30
S 0.016 0.030 max
P 0.018 0.030 max
Cr 3.50 3.00-3.75
V 0.41 0.30-0.50
W 9.75 8.50-10.00
at 540 °C with 2 h soaking time, followed by air cooling to room temperature. After first tempering the specimens were employed to second tempering at 540 °C with 2 h soaking time, followed by air cooling to room temperature. The specimens treated in this way are designated as HTT.
2.2.3 Cryogenic treatment
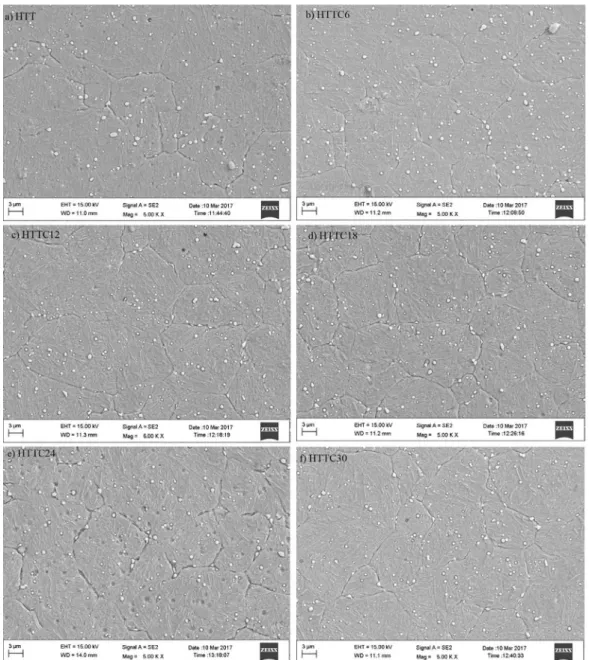
Cryogenic treatment was employed on HTT specimens in a computer controlled cryo-processor (Sanmar, Mumbai). Figure 2 shows the schematic overview of a cryo-processor. The cryogenic treatment was done using controlled liquid nitrogen as a medium. As per the experimental requirement, the groups of different specimens were prepared and kept in the cryo-bath at room temperature. The cryobath temperature was brought down at a uniform cooling rate of 3 ºC/min to a temperature of -185 ºC by supplying controlled liquid nitrogen through solenoid valve. A bunch of specimens was removed from the cryo-bath after regular interval of 6 h starting from 6 h to 30 h crysoaking time and immediately stored in an insulated thermocol box until the specimen attained room temperature. Then the specimens were employed soft tempering at 100 °C for 1 h to relieve the compressive stresses developed during cryogenic treatment. The specimens treated in this way are designated as HTTC6, HTTC12, HTTC18, HTTC24, and HTTC30. The numbers in the designation code represent the cryosoaking time in hours.
2.3 Metallography
The specimens prepared of diameter 10 mm and length 10 mm were surface levelled on endless emery belt paper (80/0). Then specimens were polished with the emery paper of grit 1/0, 2/0, 3/0 and 4/0, to make surface free from scratches. To achieve better finish on the polished surface, lapping was done on velvet cloth polishing machine with intermittent application of fine suspensions of alumina. A freshly prepared etchant of 5 % picric acid, 2 % HCl with 100 ml ethyl alcohol was used for revealing micro-constituents of polished specimens with etching time 15-20
sec. The microstructural analysis was carried out using both optical microscope (Make: Conation, Model: SuXma-Met B I) and Scanning Electron Microscope (Make: ZEISS, Model: SIGMA HV) operated at 15 kV on polished and freshly etched specimens. The SEM - Energy Dispersive Spectroscopy (EDS) analysis had been carried out to confirm the existence of fine carbides in the conventionally treated and cryotreated specimens. The number of carbides was counted and expressed as the number of carbide per unit area.
2.4 Hardness measurement
The hardness of the specimens of diameter 10 mm and length 10 mm was measured by using a Rockwell hardness tester with C scale. Initially, a minor load of 10 kg was applied to seat indenter. Then the major load of 150 kg was applied for 15 s and resistance to indentation was recorded on dial gauge indicator. For calibration, standard block with hardness of 61.2 HRC was used. Minimum of 10 readings has been taken to calculate the average value of hardness.
2.5 Impact energy test
The Charpy impact test was carried out to measure impact toughness or impact energy using the impact test setup (Make: Fine Instru., least count: 2J). For the impact test, standard test specimen with V-notch was prepared as shown in Figure 3. An average of 3-5 readings was considered as a measure of impact toughness or impact energy.
2.6 Wear test
The pin-on-disc wear test machine (Ducom: TR 20LE, India) was used for dry sliding wear test. In this test, the specimens of diameter 10 mm and length 30 mm were kept stationary and slide against rotating disc for a sliding distance of 5000 m. The diameter of the counter face disc was 170 mm with a hardness of 61 HRC. Wear test was repeated three times to calculate the average of wear rate. The surface roughness of the rotating disc was maintained uniformly by polishing it with 600-grit paper7. Also, a
fresh surface of test specimens and new track radius of the counter disc was used for every test. Before and after wear test, specimens and counter disc were cleaned with acetone to remove surface contaminants.
Figure 1. Time-Temperature diagram illustrates the heat treatment employed on H21 tool steel
2.7 Design of experiment
The Taguchi optimization method has been used to identify the optimum control factors that yield lowest wear rate. It includes DOE, which is used to minimize the efforts for the experimental work as well as it helps in the analysis of the result obtained. In the present work DOE, graphs and analysis have been carried out with the help of Minitab 17 statistical software. Here DOE was used with the objective to minimize wear rate as a response function or dependent variable; cryosoaking duration, sliding velocity, and applied load were selected as an independent variable. The factors and corresponding levels selected for DOE are summarized in Table 2.
In the present work, 16×23 fractional factorial design
was chosen. Orthogonal array (OA) is an arrangement of the factors used in the DOE to gain maximum information with the least number of tests without loss of experimental data5,20. According to the Taguchi method total degree
of freedom (DOF) of selected OA must be equal to or greater than the total DOF required for the experiments26.
So standard L18 OA was selected to conduct wear test and
statistical analysis of variance (ANOVA) technique used for optimization of parameters and signal to noise (S/N) ratio values. The interaction of factors was neglected in the analysis. For minimum wear rate, smaller the better S/N ratio is always chosen. The smaller the better S/N ratio, one can obtain as Eq. (1)19,20,23.
(1)
Where, n is the number of repetitions, here n = 3; yj is
the individual measured wear rate.
3. Results, Analysis and Discussion
3.1 Microstructural feature
To study the effect of DCT on carbide density, carbide size and the inter-particle distance between carbides; SEM study was carried out. The SEM images of different heat-treated specimens are as shown in Figure 4(a-f) which depicts the carbides precipitated in tempered martensite. Figure 4(a) shows most of the retained austenite was converted into martensite. Bensely et al.1 reported that the presence of
retained austenite is harmful to the components which are under service. The carbides are distributed along the grain boundaries and in the tempered martensite matrix of the HTT specimens. In HTT specimens most of the carbides are distributed at the grain boundaries because of nucleation at grain boundaries the diffusivity of carbon atoms is higher along grain boundaries than its volume diffusion.
Figure 3. Impact test specimen
Table 2. Factors and corresponding levels.
Level Cryosoaking Time (h) Sliding Velocity (m/s) Load Applied (N)
1 0 1.5 75
2 6 2 100
3 12 2.5 125
4 18
5 24
6 30
log
N
S
n
y
10
1
jj n
2
1
=-=
The carbide precipitation mechanism could be explained as follows: The DCT induces compressive residual stresses on the material due to cryogenic temperature. Also, DCT converts most of the retained austenite into martensite, with the minimum disorder. The large numbers of alloying elements are available for nucleation. After DCT, the specimens are kept in a thermocol box and subsequent soft tempering was employed. During this warming-up period, the atomic movement increases with the stress relaxation of the matrix. It makes a helpful situation for the precipitation and growth of carbides, thus leading to a higher nucleation rate results in fine carbides and more homogenous carbide distribution4,14,27.
The population density of carbides, spherical diameter of carbides and the average interparticle distance between
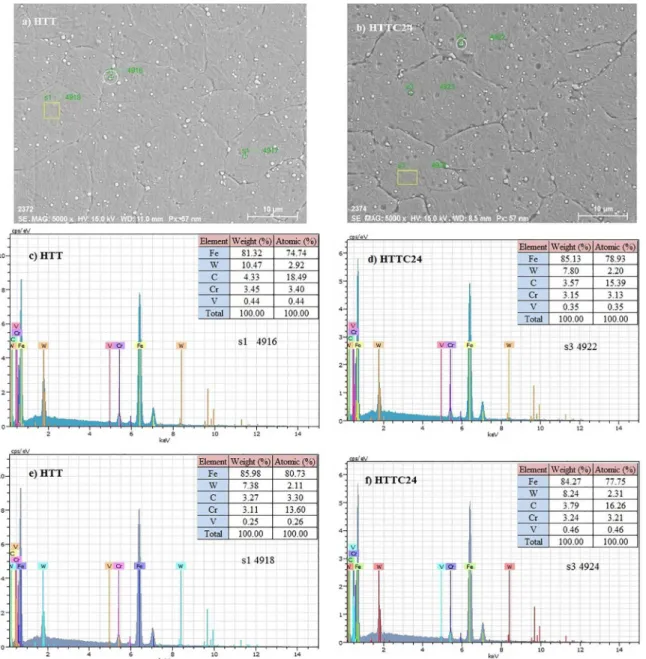
carbides was measured. Table 3 describes the carbide density as a function of cryosoaking period. It is clearly observed from Table 3 and Figure 4(a-f) that the application of DCT improves population density of carbides, reduces the carbide size and inter-particle distance. The SEM-EDS analysis of conventionally treated and cryotreated specimens shown in Figure 5(a-f) which confirms the availability of different alloying elements in the HTT and HTTC24 specimens. The presence of alloying elements forms the carbides and precipitate in the tempered martensite.
As revealed in Table 3 and Figure 5(c-d), application of DCT improves the carbide density and reduces the carbide size due to the reduction in the alloy elements and carbon content of carbides which may be used in the precipitation of relatively fine carbides. This results diffusion of alloy
elements and carbon towards the carbides occurred more easily28. As described by Dhokey et al.27, the cryotreatment
can influence the precipitation of finer carbides termed as tertiary carbides. It is observed from Figure 5(e-f) the alloy elements and carbon content is richer in the metal matrix after the application of DCT. Therefore, the precipitation of the fine carbides after the DCT made easier.
It is obviously observed from Table 3, Figure 4 and Figure 5 that the carbide density attains maximum for HTTC24 specimens (average 257×10-3 carbides/µm2) as
a result of precipitation of finer carbides as compared to HTT specimens (average 135×10-3 carbides/µm2). The finer
carbides have the size less than 1 µm. As noted by Molinari et al.4, Dhokey and Nirbhavne7, and Das et al.29; in the present
work also the fine carbides in tempered martensite matrix are increased due to the cryogenic treatment, as shown in Table 3 and Figure 4(b-f). For HTTC24 specimens the population density of carbides increased by 90%, average spherical diameter of carbides reduced by 23% and inter-particle distance reduced by 51% compared to HTT specimens. This clearly shows that DCT refines the carbides. With an increase in cryosoaking time up to 24 h, the carbide density increased, the average spherical diameter of carbides and average inter-particle distance reduced but beyond the 24 h cryosoaking time carbide density slightly decreased, average spherical diameter of carbides and average inter-particle distance slightly get increased. This is due to the availability of more alloying elements for nucleation and increased carbide nucleation during the warming up period up to 24 h cryosoaking period but beyond the 24 h cryosoaking time it slightly reduced. It may be due to the less availability of alloying elements12,28 at the grain boundaries for nucleation
of carbides which leads to the formation of coarse carbides by merging the smaller carbides. Due to the formation of coarse carbide beyond 24 h cryosoaking duration, the carbide density slightly gets reduced29. This is due to the less
availability of carbide network at the grain boundaries up to the 24 h cryosoaking time but beyond the 24 h cryosoaking time the carbide network at the grain boundaries slightly increased which weakening the grain boundaries. Also, at higher cryosoaking period greater compressive stresses can
be added in the matrix which relieved partly by coarsening of carbides27. Up to the 24 h cryosoaking time, the kinetics
of carbide precipitation is proportional to cryosoaking time. In the opposite sense cryogenic treatment effects on average spherical diameter and average inter-particle distance.
3.2 Hardness
The hardness test results infer that the hardness of the cryotreated specimens was increased 3.3 % for 24 h cryosoaking time compared to the conventional heat treated specimens as shown in Figure 6. The hardness of cryotreated specimens attains maximum for 24 h cryosoaking time is due to the enhancement in the carbide density and a reduction in average carbide size as well as average inter-particle distance as shown in Table 3. It is due to the high rate of nucleation of fine carbides compared to the other cryosoaking duration. The enhancement in hardness for cryotreated specimens may be due to the increased transformation of retained austenite to martensite1,18,29-31. But due to the slightly decreased carbide density, coarsening of carbides and increased average inter-particle distance beyond 24 h cryosoaking time, the hardness slightly reduced. Nurbanasari et al.17 reported that
the hardness of tool steel influenced by type, size, amount and distribution of carbides. As stated by Bensely et al.1 and
Dhokey et al.15, in addition to the conversion of retained
austenite to martensite, DCT encouraged the precipitation and the finer distribution of carbides during warm up period which improves the wear resistance and hardness. Shinde and Dhokey12 investigated the hardness reaches a
maximum at 16 h cryosoaking time for H13 die steel. Das et al.6 established that the 36 h cryosoaking time provides the highest hardness of AISI D2 tool steel. Das et al.32 and
Korade et al.33 reported near about 5 % improvement in the
hardness of cryotreated AISI D2 tool steel. In the study of the influence of cryotreatment on H13 die steel, Shinde and Dhokey34 observed that approximately 10 % improvement
in hardness. The hardness of the conventionally treated specimens is less compared to the cryotreated specimens, which can cause the high wear rate.
3.3 Impact energy or impact toughness
The impact test results reveal that the impact energy of the cryotreated specimens for 24 h cryosoaking time is reduced up to 17 % than that for the conventional heat treated specimens as shown in Figure 7. The HTT specimens attain maximum impact energy. Also, it is observed that the impact energy gradually reduced up to 24 h cryosoaking time and attain lowest at 24 h cryosoaking duration, beyond 24 h cryosoaking duration impact energy slightly increased. It is due to the increased hardness because of increased carbides count and their size refinement of cryotreated specimens. Das et al.29 reported that the toughness values of AISI D2
tool steel decreases with increase in hardness, increase in carbide counts and refined carbide distribution. The impact
Table 3. Summary of population density of carbides.
Specimen
Avg. No.
of carbides
(×10-3/µm2)
Avg. spherical diameter
(µm)
Avg. inter particle dist.
(µm)
HTT 135 0.375 1.497
HTTC6 189 0.339 1.3965
HTTC12 237 0.328 0.9159
HTTC18 196 0.308 1.1012
HTTC24 257 0.287 0.735
Figure 5. a) SEM image of HTT specimen, b) SEM image of HTTC24 specimen, c) EDS analysis of encircled carbide of HTT specimen, d) EDS analysis of encircled carbide of HTTC24 specimen, e) EDS analysis of metal matrix of HTT specimen, f) EDS analysis of metal matrix of HTTC24 specimen
energy result shows the inverse relationship with hardness. The impact energy depends on the carbide density, grain size and ductility of the matrix15.
3.4 Wear rate (W
R)
The plan of experiments was prepared with the objective of relating the effect of applied load, sliding speed and cryosoaking time with the wear rate. In this work DOE, plots and analysis were carried out using Minitab 17 software. As per the experimental design, eighteen experiments were conducted using Taguchi (L18) experimental design with the
combination of parameter levels are shown in Table 4. Three replicates for each experiment were carried out to find the average of WR. The wear volume is expressed as:
(2)
Where, W = wear volume (mm3), ΔH = change in length
(mm), A = cross section area of pin (mm2).
The wear rate has been estimated as wear volume loss (mm3) per unit sliding distance (m). The W
R is commonly
expressed as:
(3)
Where, WR = wear rate (mm3/m), W = wear volume
(mm3), L= sliding distance (m).
The wear rate for all wear test has been calculated as per Eq. (2), and Eq. (3); are summarised in Table 4.
3.5 Analysis of results
Analysis of variance has been used to determine the optimum combination of wear test parameters and corresponding levels, to identify the statistical significant parameters and to find percent involvement of these parameters on wear rate19,20.
The S/N ratio of the wear rate is calculated and shown in Table 4. The main effect plot for S/N ratio and main effect plot for means of the wear rate are plotted as shown in Figure 8(a-b). In case of smaller the better, highest S/N ratio response indicates the best response which results in lowest noise. The main effect plot for S/N ratios and main effect plot for means indicate that the load is the most significant parameter followed by sliding velocity and cryosoaking duration which is in agreement with the ANOVA.
The comparative significance of the selected parameters with respect to the wear rate was examined to find the optimum combinations of the selected parameters by using ANOVA. The combined effect of parameters was observed very less so it neglected in this experimentation. Table 5 and 6 indicate the response table for S/N ratios and response table for means respectively. The results of ANOVA for wear rate are summarized in Table 7. It includes the degree of freedom (DF), the sum of square (SS), mean square (MS), F-value, percentage contribution and probability value (P-value). As
far as wear rate is concerned, load is the most significant parameter having maximum contribution followed by sliding velocity and cryosoaking time as shown in Table 5-7. It is also observed from main effect plot for S/N ratios and main effect plot for means as shown in Figure 8(a-b). The percent contributions of the load, velocity and cryosoaking time on the wear rate are 74.42, 14.58, and 10.33 respectively. No any interaction effects having a significant effect on wear rate. Here the R-square and R-square adjusted values are above 90%, indicates that the model fit is within the acceptable limit35. Also, as the P-values of ANOVA are less than 0.05,
the developed model is statically significant20. The results
obtained in ANOVA shows that the lowest load (75 N), lowest sliding velocity (1.5 m/s) and 24 h cryosoaking time are optimum parameters in order to obtain minimum wear rate.
The results depicted in Table 4 clearly describe the effect of varying holding duration of DCT on the wear rate. The high wear rate in HTT specimens could be attributed to coarse carbide. As stated by Lal et al.2 and Dhokey and Nirbhane7,
in this experiment also there is a definite reduction in wear rate due to a reduction in inter-particle spacing and increase in fine carbides nucleated during cryogenic treatment up to 24 h cryosoaking time. Whereas WR increased beyond the
24 h cryosoaking time due to the coarsening of carbides as revealed in Table 3 and 4; also drop in hardness as shown in Figure 6.
In this study, the hardening, double tempering, and cryogenic treatment were carried out on H21 hot work tool steel. The highest carbide density, highest hardness, and lowest wear rate were observed at 24 h cryosoaking duration. Therefore, 24 h cryosoaking duration is selected as the optimum cryosoaking duration for AISI H21 tool steel (Fe-0.3C-0.39Mn-0.16Si-3.5Cr-0.41V-9.75W). Das et al.6,9,10
carried out hardening, cryotreatment and single tempering for AISI D2 cold work tool steel (Fe-1.49C-0.29Mn-0.42Si-11.38Cr-0.8Mo-0.68V). It was reported that the optimum cryosoaking duration of 36 h to maximize hardness and to minimize the WR. The AISI H13 hot work tool steel (Fe-0.40C-0.30Mn-0.40Si-5.50Cr-1.40Mo-1.00V) hardened, oil quenched, double tempered and cryotreated by Shinde and Dhokey12. The cryosoaking duration was optimised at
16 h and at optimum cryosoaking duration highest carbide density, highest hardness, and lowest wear rate was reported. In the study of the effect of cryotreatment on mechanical properties of 1.2542 tool steel (Fe-0.48C-0.33Mn-0.99Si-1.12Cr-1.57W), Farhani et al.3 carried out hardening, oil or
air quenching, single tempering and cryotreatment. It was reported that the 48 h cryosoaking duration improves the tensile strength, hardness, and ductility. So here, it can be concluded that for the different ferrous materials as per their chemical composition, different combinations of hardening, quenching, tempering, and cryotreatment and corresponding temperature are required to be selected to improve the properties of materials.
W
=
D
H
#
A
Table 4. L18 OA with response and S/N ratio.
Expt. No. HT Velocity
(m/s) Load (N)
Wear Rate (mm3/m)
S/N Ratio MEAN
WR1×10
-3 W
R2×10
-3 W
R3×10
-3
1 0 1.5 75 1.2454 1.2399 1.2375 -1.87500 1.24093
2 0 2.0 100 2.4527 2.3778 2.4264 -7.67331 2.41897
3 0 2.5 125 3.0178 3.0427 3.0342 -9.63339 3.03157
4 6 1.5 75 1.2121 1.0848 1.1902 -1.31678 1.16237
5 6 2.0 100 2.4232 2.3186 2.3267 -7.44589 2.35617
6 6 2.5 125 2.7628 3.1305 2.9661 -9.41691 2.95313 7 12 1.5 100 1.9069 2.0927 1.6083 -5.48278 1.86930
8 12 2.0 125 2.3935 2.8256 2.7449 -8.50183 2.65467
9 12 2.5 75 1.8362 1.4286 1.3533 -3.82854 1.53937 10 18 1.5 125 1.8854 2.1473 2.2819 -6.49098 2.10487 11 18 2.0 75 1.1774 1.2176 1.1864 -1.53954 1.19380
12 18 2.5 100 2.2918 2.2107 2.2361 -7.02996 2.24620
13 24 1.5 100 1.5584 1.5463 1.3251 -3.40810 1.47660
14 24 2.0 125 2.2017 2.1713 2.1772 -6.78282 2.18340
15 24 2.5 75 1.3172 1.4253 1.4044 -2.81703 1.38230
16 30 1.5 125 2.5128 2.5002 2.4328 -7.89667 2.48193
17 30 2.0 75 1.4781 1.4393 1.3237 -3.01648 1.41370 18 30 2.5 100 2.4919 2.5141 2.6281 -8.11512 2.54470
Figure 8. (a) Main effects plot for S/N ratios and (b) Main effects
plot for means
Table 5. Response table for S/N ratio.
Level HT Velocity Load
1 -6.394 -4.412 -2.399 2 -6.052 -5.827 -6.526 3 -5.938 -6.807 -8.120
4 -5.020
5 -4.336
6 -6.343
Delta 2.058 2.395 5.722
Rank 3 2 1
Comparing the present results with the results of published work as mentioned above. It can be conclude that in addition
to the conventional heat treatment, the cryogenic treatment at optimum soaking duration improves carbide density and hardness and reduces the wear rate due to conversion of retained austenite into martensite as well as precipitation of fine carbides in the matrix of tempered martensite of AISI H21 tool steel.
Based on experimental data, regression analysis is frequently used in order to build a mathematical model21.
The relationship between wear test parameters and wear rate were modelled by the regression equation. The regression equation for wear rate was obtained to analyse the significant parameter for various wear rate. The developed regression equation is as follows.
(4)
.
.
*
.
*
.
*
.
%
W
HT
Velocity
Load
R
1 454
0 00962
0 560
0 02492
99 33
R
2
=-
-
+
Where, R2 is the determination coefficient, which
measures the degree of fit.
The mathematical model developed as shown in Eq. (4) using a regression analysis technique for predicting the wear rate will be useful at new levels of selected parameters. As R2
value approaches unity, the developed model fits the actual data22. Figure 9 illustrates the percentage error in measured
and predicted values of WR. The maximum error between measured and predicted value of WR for experiment number 18 was found to be around 15.5 %, while average percentage error was 7.9 %. Bartarya and Choudhury24 developed
regression equations to find cutting forces and reported maximum error of 25 % in the prediction of cutting forces. In present work the obtained percentage errors between measured and predicted values found to be in good agreement with
Table 6. Response table for means.
Level HT Velocity Load
1 2.230 1.723 1.322
2 2.157 2.037 2.152
3 2.021 2.283 2.568
4 1.848
5 1.681
6 2.147
Delta 0.550 0.560 1.246
Rank 3 2 1
Table 7. ANOVA for means of wear rate.
Source DF Seq SS Adj SS Adj MS F-Value Contribution P-Value
HT 5 0.67070 0.67070 0.13414 24.60 10.33 % 0.000*
Velocity 2 0.94614 0.94614 0.47307 86.75 14.58 % 0.000* Load 2 4.83002 4.83002 2.41501 442.84 74.42 % 0.000*
Error 8 0.04363 0.04363 0.00545 0.67 %
Total 17 6.49048 100 %
S = 0.07385; R-Sq = 99.3%; R-sq(adj) = 98.6%; R-sq(pred) = 96.6% *Significant Influence (P Value < 0.05), Hypothesis supported
the percentage error reported by Bartarya and Choudhury24.
The mathematical model developed for prediction of wear rate produced more error in predicted value may be due to unexpected nature of measured values used to develop the model. This unexpected nature of measured values is due to experimental errors, variation in hardness values at different locations in workpiece and non-uniformity of material24.
3.6 Validation test
The statistical analysis result validated by confirmation test which was conducted at the optimized parameters. For the confirmation test, experiments are carried out only at significant factors5,23. Then, with the help of developed
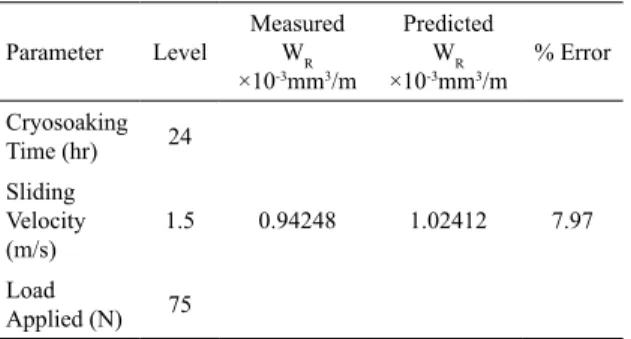
model and optimized parameters the values are calculated. Finally the experimental and calculated values are compared. The results of statistical analysis are acceptable when the experimental and calculated values are close to each other. In the present work, the confirmation experiment was conducted for wear test. The measured WR was reported an average of three wear test results at optimized parameters. Also, the WR is calculated with the help of developed model and optimized parameters. The measured WR, predicted WR and percent error are summarized in Table 8. The percentage error in prediction of wear rate at optimized parameters was found 7.97 %, which is equal to the average error obtained in the preliminary experimental test results as shown in Table 8 and Figure 9. This is in a good agreement with the confirmation experiment results of Oppenkowski et al.5
and Lodhi and Agarwal19. Oppenkowski et al.5 conducted
validation test for predicting the wear rate and reported 35 % error in the study of optimization of cryosoaking duration for AISI D2 tool steel. Lodhi and Agarwal19 reported that
the developed model for surface roughness has an error of 3.042 % at optimum machining parameters.
The WR obtained using developed mathematical model and experimental test at optimized parameter level was found to be 1.02412×10(-3) mm3/m and 0.94248×10(-3) mm3/m
respectively. This result shows the reduction in WR of 24 %
compared with the lowest WR obtained for HTT specimens during the preliminary experiment as shown in Table 4. It indicates that the experimental results for optimized parameters and corresponding levels give better WR than preliminary experimental test results.
Table 8. Confirmation test results.
Parameter Level
Measured WR
×10-3mm3/m
Predicted WR
×10-3mm3/m
% Error
Cryosoaking Time (hr) 24
0.94248 1.02412 7.97 Sliding
Velocity
(m/s) 1.5
Load
Applied (N) 75
4. Conclusions
The effect of DCT on hardness, impact toughness, wear rate and microstructure of AISI H21 hot work tool steel was studied. The Taguchi optimization approach based on S/N ratio was used to optimize the cryosoaking time and to identify the most influencing parameters and corresponding levels to accomplish minimum wear rate. Following conclusions can be drawn from this study.
1. The deep cryogenic treatment improves carbide density and reduces average spherical diameter and average inter-particle distance of carbides which improves hardness and wear behaviour. The hardness of deep cryogenically treated specimen increases marginally and attain a maximum at 24 h cryosoaking time.
2. The impact toughness values of the deep cryotreated specimen decrease due to increase in hardness compared to the conventionally treated specimens. 3. The wear test results obtained from experimental
trials which were performed using Taguchi orthogonal array indicate that the optimized cryosoaking time is 24 h to minimize wear rate.
4. As per the ANOVA results for S/N ratio the most significant factors influencing the wear rate are applied load followed by sliding velocity and cryosoaking duration with optimized parameters level of 75 N, 1.5 m/s and 24 h respectively. 5. The optimized cryosoaking duration will be helpful
to reduce the wear rate of AISI H21 dies in the production line.
5. Acknowledgments
The authors are very much thankful to Dr. N. B. Dhokey of Department of Metallurgical Engineering, Government College of Engineering, Pune, India-411005; for providing laboratory facilities and valuable suggestions.
6. References
1. Bensely A, Prabhakaran A, Lal DM, Nagarajan G. Enhancing the wear resistance of case carburized steel (En 353) by cryogenic
treatment. Cryogenics. 2005;45(12):747-754.
2. Lal DM, Renganarayanan S, Kalanidhi A. Cryogenic treatment
to augment wear resistance of tool and die steels. Cryogenics.
2001;41(3):149-155.
3. Farhani F, Niaki KS, Vahdat SE, Firozi A. Study of effects of deep cryotreatment on mechanical properties of 1.2542 tool
steel. Materials & Design. 2012;42:279-288.
4. Molinari A, Pellizzari M, Gialanella S, Straffelini G, Stiasny KH. Effect of deep cryogenic treatment on the mechanical
properties of the tool steels. Journal of Materials Processing Technology. 2001;118(1-3):350-355.
5. Oppenkowski A, Weber S, Theisen W. Evaluation of factors influencing deep cryogenic treatment that affect the properties
of tool steels. Journal of Materials Processing Technology.
2010;210(14):1949-1955.
6. Das D, Dutta AK, Ray KK. Optimization of the duration of cryogenic processing to maximize wear resistance of AISI D2
steel. Cryogenics. 2009;49(5):176-184.
7. Dhokey NB, Nirbhavne S. Dry sliding wear of cryotreated multiple tempered D-3 tool steel. Journal of Materials Processing Technology. 2009;209(3):1484-1490.
8. Gao Y, Luo BH, Bai Z, Zhu B, Ouyang S. Effects of deep cryogenic treatment on the microstructure and properties of WC-Fe-Ni cemented carbides. International Journal of Refractory Metals and Hard Materials. 2016;58:42-50.
9. Das D, Dutta AK, Ray KK. Influence of varied cryotreatment on the wear behavior of AISI D2 steel. Wear.
2009;266(1-2):297-309.
10. Das D, Dutta AK, Ray KK. Correlation of microstructure with wear behaviour of deep cryogenically treated AISI D2 steel.
Wear. 2009;267(9-10):1371-1380.
11. Akhbarizadeh A, Shafyei A, Golozar MA. Effects of cryogenic treatment on wear behavior of D6 tool steel. Materials & Design.
2009;30(8):3259-3264.
12. Shinde T, Dhokey NB. Influence of carbide density on surface roughness and quasi-stable wear behaviour of H13 die steel.
Surface Engineering. 2017;33(12):944-952.
13. Wang K, Tan Z, Gu K, Gao B, Gao G, Misra RDK, et al. Effect of deep cryogenic treatment on structure-property relationship in an ultrahigh strength Mn-Si-Cr bainite/martensite multiphase
rail steel. Materials Science & Engineering: A.
2017;684:559-566.
14. Koneshlou M, Asl KM, Khomamizadeh F. Effect of cryogenic
treatment on microstructure, mechanical and wear behaviors of AISI H13 hot work tool steel. Cryogenics. 2011;51(1):55-61.
15. Dhokey NB, Hake AR, Thavale VT, Gite R, Batheja R. Microstructure and Mechanical Properties of Cryotreated SAE8620 and D3 Steels. Current Advances in Materials Sciences Research. 2014;1(1):23-37.
16. Nurbanasari M, Tsakiropoulos P, Palmiere EJ. A study of
Carbide Precipitation in a H21 Tool Steel. ISIJ International.
2014;54(7):1667-1676.
17. Nurbanasari M, Tsakiropoulos P, Palmiere EJ. Solidification
Behaviour of a H21 Tool Steel. Advanced Materials Research.
18. Nurbanasari M, Tsakiropoulos P, Palmiere EJ. Influence of high
temperature deformation and double tempering on the microstructure of a H21 tool steel. Materials Science & Engineering: A. 2013;570:92-101.
19. Lodhi BK, Agarwal S. Optimization of Machining Parameters in WEDM of AISI D3 steel Using Taguchi Technique. Procedia CIRP.
2014;14:194-199.
20. Bensouilah H, Aouici H, Meddour I, Yallese MA, Mabrouk T,
Girardin F. Performance of coated and uncoated mixed ceramic
tools in hard turning process. Measurement. 2016;82:1-18. 21. Benardos PG, Vosniakos GC. Predicting surface roughness in
machining: a review. International Journal of Machine Tools and Manufacture. 2003;43(8):833-844.
22. Puertas Arbizu I, Pérez CJL. Surface roughness prediction by factorial design of experiments in turning processes. Journal of Materials Processing Technology. 2003;143-144:390-396.
23. Hamdan A, Sarhan AAD, Hamdi M. An optimization method of the machining parameters in high-speed machining of stainless steel using coated carbide tool for best surface finish. International Journal of Advanced Manufacturing Technology. 2012;58(1-4):81-91.
24. Bartarya G, Choudhury SK. Effect of Cutting Parameters on Cutting Force and Surface Roughness During Finish Hard Turning AISI52100
Grade Steel. Procedia CIRP. 2012;1:651-656.
25. Roberts G, Krauss G, Kennedy R. Hot-Work Tool Steels. In: Roberts
G, Krauss G, Kennedy R. Tool Steel. 5th ed. Materials Park: ASM International; 1998. p. 219-250.
26. Sachdeva G, Khanna R, Yadav P, Nara A, Singh N. Experimental study of H-21 punching dies on wire-cut electric discharge
machine using Taguchi's method. International Journal of Scientific & Engineering Research. 2013;4(5):569-577.
27. Dhokey NB, Hake A, Kadu S, Bhoskar I, Dey GK. Influence of Cryoprocessing on the Mechanism of Carbide Development in Cobalt-Bearing High-Speed Steel (M35). Metallugical and Materials Transactions A. 2014;45(3):1508-1516.
28. Vahdat SE, Nategh S, Mirdamadi S. Microstructure and tensile properties of 45WCrV7 tool steel after deep cryogenic treatment.
Materials Science & Engineering: A. 2013;585:444-454.
29. Das D, Sarkar R, Dutta AK, Ray KK. Influence of sub-zero treatments on fracture toughness of AISI D2 steel. Materials Science & Engineering: A. 2010;528(2):589-603.
30. Dhokey NB, Dandawate J, Gangurde H, Harle A. Metallurgical investigation of cryogenically cracked M35 tool steel. Engineering Failure Analysis. 2012;21:52-58.
31. Zhirafar S, Rezaeian A, Pugh M. Effect of cryogenic treatment on the mechanical properties of 4340 steel. Journal of Materials Processing Technology. 2007;186(1-3):298-303.
32. Das D, Dutta AK, Toppo V, Ray KK. Effect of Deep Cryogenic
Treatment on the Carbide Precipitation and Tribological
Behavior of D2 Steel. Materials and Manufacturing Processes.
2007;22(4):474-480.
33. Korade DN, Ramana KV, Jagtap KR, Dhokey NB. Effect of Deep Cryogenic Treatment on Tribological Behaviour of D2 Tool Steel - An Experimental Investigation. Materialstoday:
Proceedings. 2017;4(8):7665-7673.
34. Shinde T, Dhokey NB. Influence of Tertiary Carbides on Improving Fatigue Limit of H13 Die Steels. Metallography, Microstructure, and Analysis. 2017;6(5):398-406.
35. Rao CJ, Rao DN, Srihari P. Influence of Cutting Parameters on Cutting Force and Surface Finish in Turning Operation.