Development of an experimental unit for studying the solar drying
process
Daniel Parente - [email protected]
Engineering Faculty, University of Beira Interior
Luís Pires - [email protected]
Engineering Faculty, University of Beira Interior
Pedro D. Silva - [email protected]
Engineering Faculty, University of Beira Interior
José Nunes - [email protected]
Agriculture School, Polytechnical Institute of Castelo Branco
Abstract
The removal of moisture by drying, prevents the growth and reproduction of these microorganisms, which cause rotting, and minimizes many of the reactions of deterioration from moisture, revealing itself a crucial preservation method. Portugal is a country with great potential for exploitation of solar energy, the implementation of a drying system based on this renewable source, facing devices with high energy consumption and hence more expensive, is attractive. With this, the present work emerges, in order to, by building a sustainable drying model, evaluate their performance, so that can be a good solution. First, were done characterization tests with the dryer unload, studying the temperatures and the relative humidity (RH) inside the drying chamber. The influence of various air gap heights and of operation modes, under natural and forced convection were studied. The developed unit was subsequently used in cherry drying. The first drying test, allowed dry 15 kg cherry in 124 hours. The second with 25 kg was carried out under adverse conditions, therefore presented an additional drying time of 25 hours from the first. The results of the studies realized indicate great potential of the drying mechanism proposed, capable of reaching temperatures of 55 °C inside the drying chamber, for an ambient temperature and humidity of 31,7 ºC and 28%, respectively, and an intensity of solar radiation of 918 W/m2.
Keywords
Development of an experimental unit for studying
the solar drying process
1. Introduction
The water contained in food allows the proliferation of micro-organisms and/or the development of chemical reactions which damage it. A strategy to solve this problem is the production of dehydrated fruit by drying. This allows the removal of moisture, preventing the growth and the reproduction of microorganisms, which makes it a crucial method of conservation [1]. The stronger population growth has impact in food balance. In present, in order to establish an equilibrium between the production and the consumption of food products, appears the necessity of its conservation [2]. Currently the dehydrated products appear on market in the form of innovative ideas, for example snacks. Therefore, it is increasingly important to safeguard the nutritional quality of products to put value added products in market [3]. A simple way to dry a product is exposing it in a warm steam whose conditions of temperature and humidity allows the water evaporation from product [4]. In drying industry there are many solutions that carry out this process, methods as freeze drying, spray drying and drum drying are some of the technologies used. The main advantages of these methods include the speed of process, no degradation by dust and animals, process consistency to be independent of adverse environmental conditions, control of the drying process [5]. However, their greatest obstacle it is involving an intensive and an expensive energy consumption for heating and transportation of air, which increase the price of products [6]. The open air drying is economically advantageous, it brings some limitations that makes it less marketable. These factors establish it as a bad alternative to drying that involves operation costs [7]. The developing of drying systems with focus in energy savings have increased in all world, especially in areas where the presence of renewable energy is abundant [1]. Portugal presented, between January of 2006 and January of 2016, an average value of 2239,3 hours of sun, with a daily average of 7,9 hours. In other countries of Europe, for example Germany, for the same period the average number of hours of sun was of 1653,8 and the daily average was of 4,6 hours [8]. Portugal is a country whose availability of solar energy is high in analogy with center and north countries of Europe, reflecting it in a huge potential for sun exploration as energy source, namely for the drying process. To overcome the disadvantages of the above methods, without throw out the assumption of take advantage of the solar energy, that doesn’t make noise, doesn’t pollute e doesn’t involve operational costs studies have been performed, in the last decade, involving the structure, building and operation of solar dryers for large scale applications. For a Mediterranean country like Portugal, where sunlight is abundant, the projection and the development of a drying method combined with thermal solar energy is attractive. The cherry, a fruit appreciated by consumers for their organoleptic and nutritional qualities, has not been employed in studies using solar dryers. This, a product of excellence in the Beira Interior region, contributed with a production of 6634 t (62.7%) from a total of 10,577 t in 2014. Part of these products after harvest are placed in cooling chambers for extend the time to market. However, with this storage mode, cherries deteriorate in a short period of time, contributing to high economic losses. One way to minimize such waste is by drying [9]. Combining abundance of solar radiation and the lack of studies involving the cherry came the ambition to build a solar dryer and evaluate their behavior and the cherry drying process. Therefore, given the abundance of solar radiation and the absence of a consensus in the literature about the height of the air gap, this work falls on the projection, construction and instrumentation of a prototype of solar drying for cherries with a varying height collector. Through this, solving the economic loss problem by deterioration of the products and by energy consumption of refrigeration chambers through the exclusive use of solar energy, which doesn’t include operating costs. Given the collector variable geometry features characterization tests were performed, in order to evaluate the performance of the dryer under different air gaps heights and under natural and forced convection. In a second step it was studied the cherry drying process to different climatic conditions developed by unit.
2. Material and Methods
2.1. Experimental unit
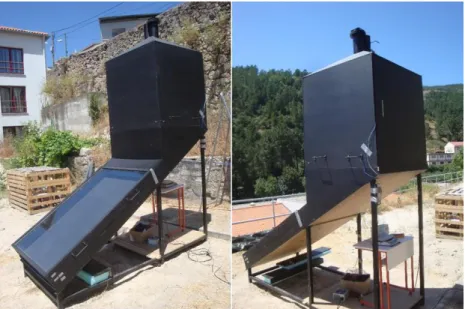
The solar dryer (Figure 1) of indirect type is a flat plate solar air heater coupled to the drying chamber. The support of the entire system was conducted by a metallic structure. For this, was used a pipe hollow square profile steel with 40 mm side and 3 mm of thickness. At the bottom of the frame was attached 6 square flat bases in steel with 170 mm of side and 5 mm thick, which come into contact with the ground and provide stability to the structure. In the upper ends of six vertical pipes was placed the flat base of the dryer made in 12 mm MDF with a total length of 2925 mm and a width of 1025 mm.
Figure 1 – Indirect solar dryer of variable collector height
The value of 33º as used to the collector slope in order to increase the efficiency of the dryer throughout the year. The variable height collector has a total length of 1635 mm and a width of 1025 mm. This element was designed and constructed to allow the study of the dryer with 3 different air gap heights (5, 10 and 15 cm) in the collector. It was chosen a top-flow collector for facilitating the incorporation of the variable geometry mechanism. The variation air gap system has been achieved by several joint modules. In total were made 3 pairs of joints, each one has a height of 50 mm and a length of 1635 mm, symbolizing the collector length. The cover consists in a glass of 1602 mm long, 995 mm wide and 5 mm thick. In the module of cover was inserted two handles made from steel bars with a diameter of 8 mm, on each side, allowing two people to change the joints to vary the height of collector. The absorber plate, responsible for increase the temperature inside the collector was made of aluminum with a length of 1635 mm, a width of 953 mm and a thickness of 0,5 mm. This was sprayed with a high emissivity black paint in order to maximize absorption of solar radiation. Given the variable nature of the collector height, it was built 3 different lids that were made of wood and extruded polystyrene. The parallelepiped drying chamber was constructed with dimensions 1040 mm height, 1025 mm wide and 980 mm deep. The chamber was made of MDF 12 mm thick, using the same methodology of the collector joints to facilitate the transport of the system. Inside the chamber were designed five different levels, spaced from 15 cm to support the 5 trays constructed. The upper part of the dryer, responsible for exhausting the air has a pyramidal shape. On top of this were coupled two PVC pipes with 300 mm height, and outer and inner diameter of 130 mm and 120 mm, respectively. In one of these pipes was attached an axial fan Papst 4212 4.3 W and a rated voltage of 12 V DC. In the other pipe was
coupled a butterfly valve for regulating the flow rate of air. This type of chimney allows that the dryer can operate under natural or forced convection.
2.1. Instrumentation and experiments
The solar dryer after construction was positioned next to the building of Engineering College of UBI, with the front of the collector oriented towards the south, thus providing a higher capture of solar radiation throughout the day. Experimental tests were conducted during the summer of 2016. For this the dryer was instrumented, and thus the various parameters were evaluated. Weather data like intensity of radiation, relative humidity (RH), temperature and the wind speed were given the weather station, Davis Wireless Vantage Pro 2, located close to the drying unit. This model has a rain collector, a temperature sensor (± 0.5 °C), a humidity sensor (± 3%), a solar radiation sensor that provides information about solar radiation intensity captured horizontally (± 5% of the value), an ultraviolet sensor and an anemometer, which gives information about the speed (± 1 m/s) and wind direction (± 3º). The temperature and RH inside the drying chamber was measured with seven data-loggers EL-USB-2-LCD + LASCAR eletronics. These devices measure relative humidity in the range 0 to 100% and temperatures from -35 to 80 ºC. In the experimental tests was used a range of 5 minutes to log values. In terms of accuracy the devices in RH readings has an error of ± 2% in the range from 0 to 90% and 90 ± 4% to 100%. In the temperature readings the maximum error is 1.5 °C.
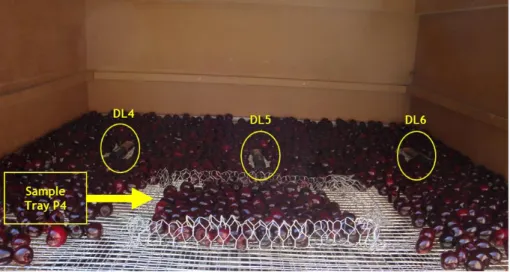
Given the behavioral evaluation of the dryer were done two different types of testes. First, the dryer was tested without fruit in its interior. After that the dryer was loaded with cherry, in order to evaluate if this type of dryer is a good solution for drying this type of fruit. For the characterization tests with the dryer empty was used an air gap of 10 cm and during the drying process was used a height of 15 cm. The layout of the data-loggers in the dryer was distinct in the various tests. The dryer characterization experiments in order to evaluate the distribution of temperature in the dryer, and to study the effect of varying the air gap and the type of convection were performed using only two trays. To facilitate its identification, the various positions was numbered, where P1 corresponds to the tray located below and P5 to the tray situated above. The characterization tests were followed by two drying processes under different climatic conditions. As in the characterization tests, in the first drying experiment, that occurs under favorable climatic conditions and with cherries without pre-treatment, they were placed on positions P2 and P4. In this set of tests were placed 3 data-loggers in each tray, identifying them as DL1, DL2, DL3, DL4, DL5 and DL6. The Figure 2 shows the data-loggers DL4, DL5 and DL6 of position P4, in position P2 the DL1 positions, DL2 and DL3 correspond to the positions of data-loggers DL4, DL5 and DL6, respectively.
Figure 2 – Disposition of data-loggers DL4, DL5, DL6 on tray located on position P4 and sample made of malleable aluminum mesh
In the second drying process, where the cherries were pretreated with ascorbic acid and experienced under adverse weather conditions, five trays were used, i.e., the maximum load of the dryer. For this situation was placed a logger in the center of each tray and a data-logger in the exit of collector. In drying tests to determine the initial moisture content of cherries was used a Ohaus MB35 moisture analyzer. This device indicates that the product moisture content on dry basis. To determine the evolution of the mass loss along the process was used an Ohaus FDseries balance. Its range of measurement scale goes from 0 to 15 kg. In order to perform the measurement within the limits of the scale were used two trays made with a malleable aluminum mesh, as shown in Figure 2. Measurements were carried out outdoors, which involved a greater care in weighing that could be influenced by the wind.
3. Results and Discussion
3.1. Temperature and relative humidity evaluation as function of position
in the drying chamber
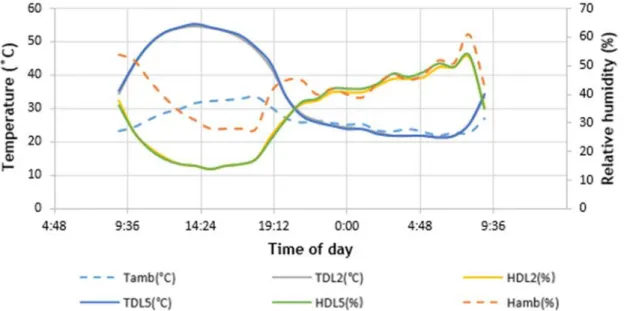
This test lasting 24 hours began at 09:00AM and ending in the next day at the same time. Through the data-loggers prepared as described back was studied the effect of the movement along the drying chamber at the temperature and RH. The variation of these parameters with time in the dryer was analyzed by comparing the measured values between DL2 and DL5 which are spaced by 30 cm. To analyze the variation of these parameters in the same tray, was evaluated the data from DL1, DL2 and DL3. To this day the graph of solar radiation showed a parabolic shape during the day, with its maximum value at 01:30PM, with a value of 918 W/m2. The ambient temperature varied from 21.7 ºC to 34.2 °C. RH showed an inverse tendency to the solar radiation, it decreases when the solar radiation increases (early in the day) and increases when the radiation intensity decreases (end of day). The lowest RH was found at 06:00PM with a value of 28%, and the highest was found at 08:00AM with a value of 61%. The test took place under natural convection, and thus the air flow velocity within the dryer was only affected by the wind speed, that presented an average value of 1.9 m/s during the experiments. The Figure 3 shows the variation of temperature and RH along the test to the central data-loggers of each tray, and the respective environmental values. The opposite behavior is evident between the temperature and humidity inside the dryer, that is, when is present the higher temperature value, show up the lower in terms of humidity.
Figure 3 – Ambient temperature (Tamb) e ambient RH (Hamb), and temperature and RH on data-loggers DL2 e DL5, TDL2, TDL5, HDL2 e HDL5 respetively, corresponding to central data-loggers positions
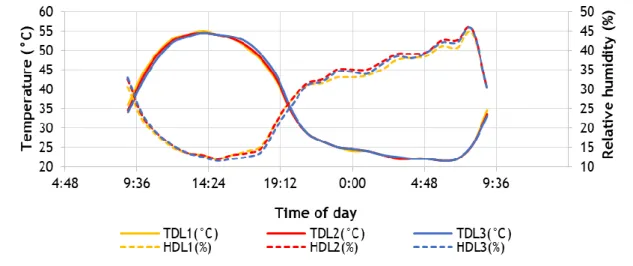
The maximum temperature reached by the dryer was 55.5°C in DL5 at 02:00PM, coinciding with the period of greatest intensity of solar radiation and with an ambient temperature of 31.7 °C. Near of this moment was presented the lowest RH, with 11.5%, for an ambient RH of 28%. At first 12 hours of experiments the DL2 showed an average temperature of 45.9 °C compared to the 46.9 °C of DL5 when in exterior was 29.2 °C. In the last 12 hours that slight supremacy doesn’t recanted, with an average temperature of 24.6 °C for the two data-loggers, with the environment with an average temperature of 24.2 °C. In terms of RH, at first 12 hours the average RH was 19.3 and 19.0% for DL2 and DL5, respectively. As expected the DL2 with a lower temperature reached a slightly higher average humidity. During the night, caused by proximity to the air outlet the DL5 had a higher average RH with 37.7%, against the 37.3% of the DL2. This parameter in exterior showed average values of 38.1% and 45.9% for the first and last 12 hours respectively. In the first period the RH decrease 19% while during the night was 8%. To analyze the performance of the dryer with the lateral displacement along the tray were placed 3 data-loggers in line with equal spacing between them, as visible in Figure 2. In Figure 4 it is visible the variation of temperature and RH for 24 hours of tests according to the position in tray located in position P2.
Figure 4 - Temperature and RH variation on DL1, DL2 and DL3, placed on lower tray
Thus, these data are indicative of a substantially uniform flow. Watching with detail are visible four distinct periods. The first from 09:00 AM to 03:00 PM, with DL1 to record higher temperatures, establishing a difference of 1 °C to DL2 and 2 °C to DL3. The second period from 03:00 PM to 04:00 PM where temperatures were similar in the 3 data-loggers. The third from 04:00 PM to 07:00 PM where the DL3 recorded the highest temperatures, with differences between 1 ºC to 1.5 °C for DL2 and DL1, respectively. Finally, in the last period, characterized by the absence of solar radiation, the temperatures were equal in the three positions. These small variations result from the movement of the sun from East to West, which makes in the morning the wall close of DL1 (East side) is exposed to radiation, unlike the wall adjacent to DL3 is shaded. During the afternoon it gives the inverse phenomenon, because of that the data-loggers had different behaviors. The RH values are related with the temperature results, during the day when RH values were lower the temperature values were higher. During the night DL1 evidenced the smaller value of RH.
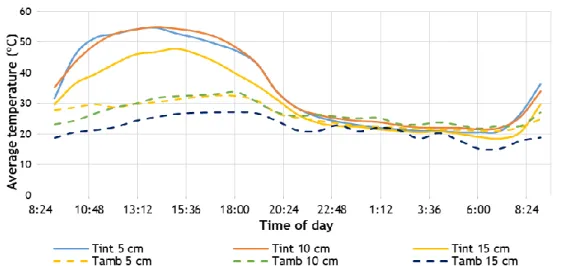
3.2. Temperature and RH evaluation as function of air gap height
A little explored point, in relation to the study of solar dryers is their performance comparing different air gap heights. Aiming this behavioral analysis was performed a study with heights of 5, 10 and 15 cm. For the present study was carried out a test with 24 hours for each height. During the 3 days of experiments the weather conditions were different. In terms of solar radiation, the experiments with 5, 10 and 15 cm showed maximum values of 1167 W/m2
at 11:50 AM, 918 W/m2 at 01:30 PM and 944 W/m2 at 01:40 PM, respectively. The fact that the peak time of the first test being offset from the other it is due to the considerable cloudiness reflected on that day. The maximum ambient temperatures were 32.6, 33.6 and 27.1 ºC for the test with 5, 10 and 15 cm, respectively. In terms of average relative humidity values during the test were 50.2, 42.0 and 36.4% for the test with 5, 10 and 15 cm. The Figure 5 shows the temperature changes inside and outside the drying chamber during the 24 hours for each height. It is apparent that significant thermal gain was obtained in all tests. During the day, from 09:00 AM to 07:00 PM average temperature within the chamber was 48.5, 49.1 and 41.3 °C, to a height of 5, 10 and 15 cm, respectively. Given the environmental temperature occurred increments of 18.1 °C, 19.4 °C and 17.0 °C for 5, 10 and 15 cm on the collector, respectively. Despite the dryer with a height of 10 cm in the collector having a higher heat gain, it should be noted the high variability in terms of radiation that the test with 5 cm showed. As expected overnight the temperature interior and exterior is similar.
Figure 5 – Average temperature in the interior of dryer (Tint) and in ambient (Tamb) with 5, 10 and 15 cm of air gap In terms of relative humidity, the behavior of dryer for each height is showed in the Figure 6. During the day there is a similarity in the RH curves within the chamber (Hint), unlike that what is exposed during the night. The lowest RH inside the chamber was 11.9% for the height of 10 cm, followed by 12.0 with 15 cm and 13.4% with 5 cm. It should be noted the frequent presence of clouds throughout the day test 5 cm. Overnight, in terms of RH the average values in this period were 17.6, 10.2 and 7.4% lower in the drying chamber compared to the 58.7, 45.55 and 36.5% recorded in the exterior for test with 5, 10 and 15 cm, respectively. This results, allow conclude that the profile with lower section area becomes somehow less sensitive to night RH present in the outside environment.
Figure 6 – Average relative humidity in the interior of dryer (Hint) and in ambient (Hamb) with 5, 10 and 15 cm of air gap
3.3. Solar drying process
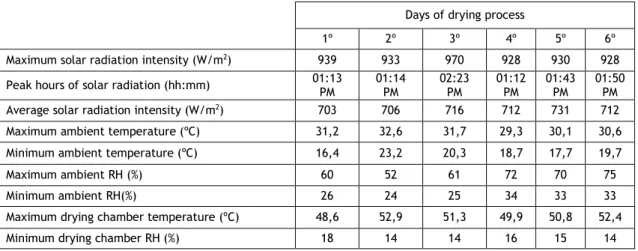
The cherry harvest takes place between the months of May to July, allowing it to dry in the months of highest peak of solar radiation, making the process faster. To evaluate the solar drying process were performed for two different tests. It was opted for the use of an air gap of 15 cm in both experiments, this because of the relation between the temperature achieved in the drying chamber and the flow rate required for the exhaust of humidity inside cherry under natural convection. In the first drying process were ginned 15 kg of fresh cherries of type "De Saco" and placed evenly on two trays located on positions P2 and P4. The drying process started at 10:50 AM on June 27, 2016, ending on July 2, 2016, having taken place continuously, i.e. overnight cherries were not removed from the dryer. The initial moisture content of the cherries was 74.22% measured on a dry basis through a moisture analyzer based on 5 different samples in order to reduce the measurement error associated with the different size of the products. By the data disclosed in the Table 2 can be seen that this first drying test occurred under favorable solar conditions. In general, the 1st drying process was characterized by the existence of few fluctuations of daily solar radiation. To this are excluded the 1st and 3rd days of trial where there was some interference from clouds, thus these days have higher frequency variations. For this reason, the 1st day despite having the second largest peak of solar radiation has the lower average values of the same parameter. The 3rd day although presenting the highest peak of solar radiation evidence the second highest average radiation peaks. More it is apparent that it was the second day the drying chamber that reached higher temperatures with a maximum of 52.9 °C. On the first day there was the lowest average radiation intensity and ambient temperature. Coupled with the high moisture content of cherry at the beginning, contributed to produce lower temperatures within the chamber, with a maximum of 48.6 °C. The day that had the largest minimum RH value inside the chamber was the first, it is result of the combination of lower radiation intensity presented on that day with the superior moisture content released by product. This can be explained by the fact that the last 3 days has shown the highest air RH values.
Table 2 - Weather data, RH and temperature in the drying chamber for the first drying process Days of drying process
1º 2º 3º 4º 5º 6º
Maximum solar radiation intensity (W/m2) 939 933 970 928 930 928
Peak hours of solar radiation (hh:mm) 01:13 PM 01:14 PM 02:23 PM 01:12 PM 01:43 PM 01:50 PM
Average solar radiation intensity (W/m2) 703 706 716 712 731 712
Maximum ambient temperature (ºC) 31,2 32,6 31,7 29,3 30,1 30,6
Minimum ambient temperature (ºC) 16,4 23,2 20,3 18,7 17,7 19,7
Maximum ambient RH (%) 60 52 61 72 70 75
Minimum ambient RH(%) 26 24 25 34 33 33
Maximum drying chamber temperature (ºC) 48,6 52,9 51,3 49,9 50,8 52,4
Minimum drying chamber RH (%) 18 14 14 16 15 14
As already indicated the product was not removed from the dryer overnight. However, were been taken some measures to prevent degradation of the products. By the RH values pronounced by the ambient and by the product drying phase, it was decided to place a waxed coverage in the first 3 nights. The system worked under forced convection, favoring the exhaustion of moisture by the permanent renewal of air. In the last two nights the cherries moisture content was below of the ambient RH, and it was decided, in this circumstance, coverage the entire dryer. Generally, in the first 3 nights the RH inside the dryer was most often less than 10% of the exterior. In the last two nights, where the dryer is covered completely and wasn’t used ventilation, the drying chamber showed values of RH 30% lower than the ambient in most of the time.
The Figure 7 shows the drying rate curve in function of the 124 hours of the first drying test. Until reached the 100 hours of drying the drying rate for the lower tray (P2) was slightly higher compared to the other tray (P4). The drying process on the lower tray reached the end of drying 2 hours before the upper tray. Analyzing the curves more detail is noticeable an early stage with steeper slopes, illustrative of higher drying rates. It could be seen that the night intervals have lower slopes. These data allow to conclude that overnight also occurs evaporation of moisture from the cherries.
Figure 7 - Drying rate curves of sample cherries of first drying process without pretreatment and under favorable weather conditions
In the second drying process were ginned 25 kg of the same fresh cherries and placed evenly in 5 trays placed in the dryer. The drying process started at 10:15 AM on July 5, 2016, and ending on July 12, 2016, and also occurred continuously. The cherries presented a initial moisture content of 76.78% measured on a dry basis through a moisture analyzer. Although the tests were performed in months of higher sun radiation intensity peaks, it took advantage of the fact that the predictions made point to a strong cloudiness and possible rain fall, to analyze the dryer performance under more hostile conditions. This involved a constant concern in placing the coverage always that were manifest adverse conditions, so as to not compromise the structure of the dryer and cherries. On the first and second days was necessary cover the dryer during the day. This was done with the entry and exit of air free and under forced convection. The air was removed from outside of the coverage by a tubbing. In Table 3 can be seen that second drying process was performed under less favorable conditions. From a general perspective this experiment was characterized by two distinct phases. An initial, covering the first 3 days where the dryer was submitted to adverse climatic conditions. A second phase which includes the following days without major cloudy periods. The 7th day provided the best conditions in terms of solar radiation instead to the third presented the worst. In Table is visible the effect of cloudiness on the temperature of the drying chamber, with the 2nd and 3rd day to submit lower temperatures. The 3rd day was the one with a lower maximum temperature, with only 34.9 °C. After that day, all remaining prowled maximums of 50 °C, with the 6th day to present the highest with 55.1 °C. In terms of radiation it was the day 7 showed the highest values. The maximum differences between the collector outlet and the drying chamber was 11.5, 12.4, 8.4, 8.9, 6.3, 5.4, 4.9 and 4.2 °C for the 8 days of drying. The reason for this decrease of the difference between temperatures is once more the high amount of moisture released by cherries in the initial stage of the process, which decreases with drying time. More, it was seen that the temperatures were decreasing as it rises vertically along the drying chamber. However, this discrepancy between values was more significant on the first day of drying with a difference of 5 °C between the tray on P1 and P5. In the remaining days, the differences were 1 or 2 °C. In the RH is already most noticeable the impact of the product moisture, with the last day, though insignificantly, to be the one with lower humidity, over the 6th day that had reached the highest temperatures.
Table 3 - Weather data, RH and temperature in the drying chamber for the second drying process Days of drying process
1º 2º 3º 4º 5º 6º 7º 8º
Maximum solar radiation intensity
(W/m2) 1018 919 972 919 926 919 1140 952
Peak hours of solar radiation
(hh:mm) 02:39PM 01:22 PM 03:39 PM 01:43 PM 01:39 PM 01:37 PM 01:40 PM 02:10 PM Average solar radiation intensity
(W/m2) 610 459 326 683 689 703 714 705
Maximum ambient temperature (ºC) 32,7 30,6 27,6 32,3 34,6 33,7 30,2 27,8 Minimum ambient temperature (ºC) 22,2 17,8 22,2 21,0 22,8 22,2 19,2 16,2
Maximum ambient RH (%) 67 83 63 69 60 63 71 75
Minimum ambient RH(%) 31 42 44 30 26 18 30 23
Maximum drying chamber
temperature (ºC) 46,4 41,7 34,9 50,3 53,0 55,1 53,2 51,5
Minimum drying chamber RH (%) 23 31 37 18 15 11 12 9
This second drying process terminated after 149 hours is unmatched with the first by the pre-treatment of the cherries and the different climatic conditions. The difference to the first method is the malleable trays that were placed on the positions P1 and P5. The Figure 8 shows the drying rate curve in function of drying time. In analogy to the graph of Figure 7 it is seen that the differences between the curves of the two trays were lower in this situation, despite the larger distance between trays and the larger load of the dryer. Rather than 1st process the two samples in this situation finish the drying process at the same time (after 149 hours). As previously verified, the slope on the first day is more pronounced than in the others. The second and the third days were characterized by low drying rates presented, despite the embryo phase of process. This happened by adverse weather conditions present in these days. The fourth day, already with favorable conditions presented an improved drying rate than the previous two. As in the first process overnight the moisture vaporization also occurs with a less steep slope.
Figure 8 - Drying rate curves of sample cherries of second drying process with pretreatment and under adverse weather conditions
4. Conclusion
Drying equipment based on no energy consumption is presented as a sustainable solution without operating costs in dehydrated fruit production. When the preservation of sensory and nutritional content of the product is required it is concluded that the most suitable model is the indirect. In translated by the results obtained in the analysis of the behavior with no load, it was concluded that during the day the temperatures are slightly higher and the relative humidities lowers for the tray placed above. At night because the imminence to the exhaust channels, the effect is contradictory. During these tests the maximum temperature recorded was 55.5 °C at 02:00 PM coinciding with an ambient temperature and RH of 31.7 °C and 28%, respectively, and a solar radiation intensity of 918 W/m2. In first drying process that was occurred under favorable conditions and the icing with pre-treatment, the samples placed in two trays spaced by 30 cm, obtained different times of completion of the drying, with the lower tray completing the process 2 hours before. The second test, on the one hand showed a favorable point to the speed of the process (pretreatment), the other was characterized by strong cloudiness and some rain fall on the firsts days of process. This gave a delay relative to the 1st process of 25 hours. Thus, it allows concluding that if there were favorable conditions, probably would have done in a shorter time. Note that despite the larger distance between the trays of the samples, these, finished the drying at the same time.
References
[1] Umogbai, V.I. & Iorter, H.., 2013. Design, construction and performance evaluation of a passive solar dryer for maize cobs. African Journal of Food Science and Technology, 4(5)(5), pp.110–115.
[2] Sharma, V.K., Colangelo, A. & Spagna, G., 1995. Experimental investigation of different solar dryers suitable for fruit and vegetable drying. Renewable Energy, 6(4), pp.413–424.
[3] Jangam, S. V., 2011. An Overview of Recent Developments and Some R&D Challenges Related to Drying of Foods. Drying Technology, 29(12), pp.1343–1357.
[4] Romero, V.M., Cerezo, E., Garcia, M. I., Sanchez, M. H. 2014. Simulation and validation of vanilla drying process in an indirect solar dryer prototype using CFD Fluent program. Energy Procedia, 57, pp.1651–1658.
[5] Irtwange, S. V & Adebayo, S., 2009. Development and performance of a laboratory-scale passive solar grain dryer in a tropical environment. Journal of Agricultural Extension and Rural Development, 1(2), pp.42–49.
[6] Sharma, A., Chen, C.R. & Vu Lan, N., 2009. Solar-energy drying systems: A review. Renewable and Sustainable Energy Reviews, 13(6–7), pp.1185–1210.
[7]Vlachos, N.A., Karapantsios, T. D., Balouktsis, A. I., Chassapis, D., 2006. Design and Testing of a New Solar Tray Dryer. Drying Technology, 20(6), pp.1243–1271.
[8] WeatherLink, 2016. Dados da estação meteorológica Covilhã - UBI edifício das engenharias.
[9] Nunes, J, Silva, P.D. Pires, L. Gaspar, P.D. Andrade, L. P, 2016. The cherry drying as a complementary conservation process to conservation in cold. VI Congresso Ibero-Americano de Ciências e Técnicas do Frio, pp.3–6.