i
UNIVERSIDADE DE LISBOA
INSTITUTO DE GEOGRAFIA E ORDENAMENTO DO TERRITÓRIO
Analysis of in Situ measurements supported by Earth
Observation data for the identification of drought events in
South Tyrol
Ruben Tiago Soares Lapa Remelgado
MESTRADO EM GEOGRAFIA FÍSICA E ORDENAMENTO DO TERRITÓRIO
ii
UNIVERSIDADE DE LISBOA
INSTITUTO DE GEOGRAFIA E ORDENAMENTO DO TERRITÓRIO
Analysis of in Situ measurements supported by Earth
Observation data for the identification of drought events in
South Tyrol
Ruben Tiago Soares Lapa Remelgado
Dissertação orientada pelo Prof. Doutor Eusébio Reis
Co-orientada pelo Doutor Stefan Schneiderbauer
MESTRADO EM SISTEMAS DE INFORMAÇÃO GEOGRÁFICA E
MODELAÇÃO TERRITORIAL APLICADOS AO ORDENAMENTO
i
ACKNOWLEDGEMENTS
I would like to thank everyone who supported me professionally and personally during this important and hard stage of my life. To those who guided me to new horizons of knowledge and never ending questioning; to those who helped me to go back to my tracks when the circumstances made me waver.
First I would like to thank Professor Fantina Tedim for bringing EURAC to my eyes and I thank EURAC for the amazing opportunity to grow even further and, more importantly, for showing me how much I still have to grow.
I would like to thank Stefan Schneiderbauer, Claudia Notarnicola and Marcello Petitta for taking me in as their pupil and for their guidance and overwhelming patience for my lasting curiosity. Despite all the acquired knowledge, the passage of time only makes me realize how much there is still to achieve from their experience and guidance. I also can’t forget the role of Eusébio Reis, my coordinator in Universidade de Lisboa for he´s patience and understanding in helping me to achieve my long term goals. I’ll leave a special thanks to Katarzyna Lewinska for her help with the pre-processing of the required satellite data for my research as well as her support in brainstorming new ideas and approaches.
Besides the already mentioned people, I can never forget the support of my friends and colleagues, old and new, in this crucial stage of my life. I want to give a special thanks to my friend Célia Borges for her presence in the good and bad moments despite the physical distance from home. For her help and advice, both professional and personal, I would like to give a special thanks to Lydia Pedoth whose friendship and new found bond makes the distance from home a lot more bearable.
Finally, I would like to thank my family for their support and understanding for my decisions during the past two years. Thank you for encouraging me and for your presence when I most needed.
iii
INDEX
FIGURE INDEX ... v TABLE INDEX... ix ABSTRACT ... xii RESUMO ... xiv 1.1. Research Motivation ... 1 1.2. Objectives ... 21.3. Organization of the Thesis ... 4
1.4. Research Concept ... 5
1.5. Drought in Europe ... 10
1.6. The Great Alpine Region (GAR) ... 11
1.7. Study Area: South Tyrol ... 14
1.7.1.Climate Change in South Tyrol ... 18
2. METHODS FOR DROUGHT ASSESSMENT ... 20
2.1. INDICES (Statistical Evaluation) ... 21
2.1.1. PDSI ... 22
2.1.2. Standard Precipitation Index (SPI) ... 26
2.1.3. Standardized Precipitation and Evapotranspiration Index (SPEI) ... 27
2.1.4. SWSI ... 31
2.2. EO based methods and combined approaches ... 32
2.2.1. Approaches based on EO images ... 33
2.2.2. Combined approaches ... 35
2.3. The Alpine Region: Selected Approach ... 36
3. METHODOLOGY ... 39
3.1. In Situ Data: Pre-Processing And Statistical Analysis ... 39
3.1.1. Precipitation and Temperature: Data selection and Preparation ... 39
3.1.2. Metrics of change magnitude ... 43
3.1.3. SPI Spacialization: Principal Component Analysis (PCA) ... 44
3.1.3.1. PCA: Precipitation (SPI) ... 45
3.1.3.2. PCA: Temperature (Z) ... 49 3.1.4. SPI Spatialization ... 52 3.2. Remote Sensing... 57 3.2.1. NDVI ... 58 3.2.2. Soil/Surface Moisture (SM) ... 68 3.2.3. Snow ... 75 3.2.3.1. Data Collection ... 77
iv
3.2.3.2. Data processing and analysis ... 80
3.2.4. Geopotential Height (Z) ... 81 4. RESULTS DISCUSSION ... 84 4.1. Meteorological changes ... 84 4.2. Vegetation ... 93 4.3. Snow ... 99 5. CONCLUSIONS ... 103 BIBLIOGRAPHY ... 106 Papers ... 106 Reports ... 114 Manuals ... 115
v
FIGURE INDEX
Figure 1: Methodological workflow for the proposed research ... 3
Figure 2: Global Average surface temperature anomaly (°C) from in situ and reanalysis data (adapted from EEA Report No 12/2012, Blunden et al., 2011) ... 6
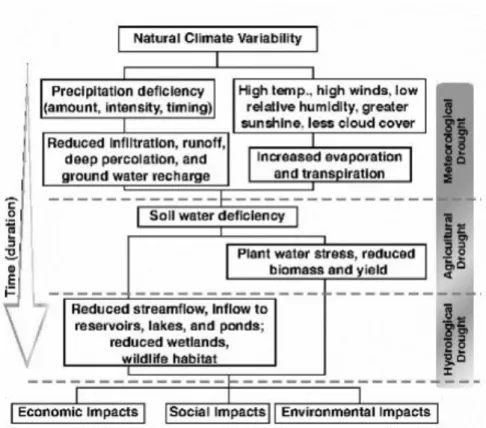
Figure 3: The sequence of drought impacts associated with meteorological, agricultural and hydrological drought (Hisdal e Tallaksen, 2000 ... 8
Figure 4: Projected Annual changes in precipitation over Europe between 2071–2100 (van der Linden and Mitchell, 2009) ... 10
Figure 5 Projected seasonal changes in Temperature and Precipitation until the end of the 21th century (EEA, 2009). ... 12
Figure 6: Projected Change in annual days ofsnowfall (Vajda et al., 2011) ... 12
Figure 7: Location of the Study Area ... 14
Figure 8: South Tyrol Regions (administrative divisions) ... 14
Figure 9: Potential Hydrological Balance (mm/yr) in South Tyrol (Shirpke, 2011) ... 15
Figure 10: South Tyrol Climate Zones according to Köppen´s climate classification ... 16
Figure 11: Land Use cover (Reakart Land use map, 2001) ... 17
Figure 12: Relation between the average monthly temperature and accumulated precipitation for 2003 and its historical average for the city of Bolzano meteorological station (adapted from Servizio Meteorologico della Provincia Autonoma di Bolzano, 2003) ... 18
Figure 13: Correlation between Penman-Monteith and Hargreaves-Sanami estimations for PET Xu and Singh (2002) ... 29
Figure 14: Correlation between Penman-Monteith and Blaney-Criddle estimations for PET Xu and Singh (2002) ... 29
Figure 15: Spatial distribution of SPI stations ... 40
Figure 16 Selected Temperature (TºC) Stations ... 42
Figure 17: Average correlation between gauge snow depth stations anomalies and nearby SPI 1 station values ... 45
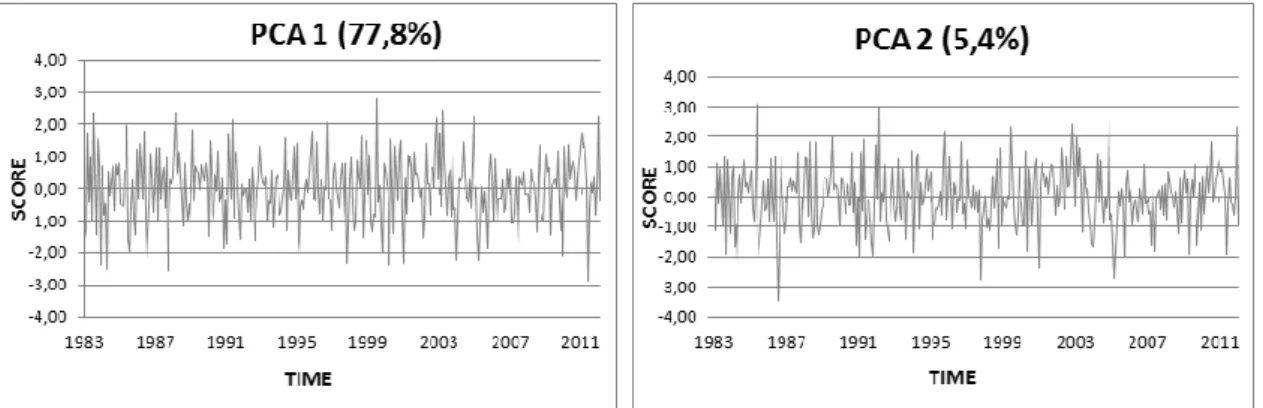
Figure 18: SPI 1 PCA scores representing the percentage of accumulated variance considered by PCA 1 (77,8%) and PCA 2 (5,4%) ... 46
Figure 19: SPI 3 PCA scores representing the percentage of accumulated variance considered by PCA 1 (75,6%) and PCA 2 (5,2%) ... 46
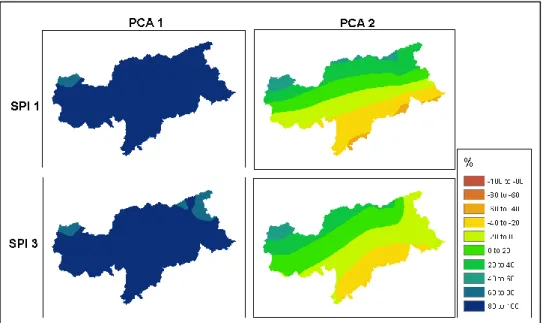
Figure 20: Loadings of PCA 1 for SPI 1 (77,8%) ... 46
Figure 21: Loadings of PCA 2 for SPI 1 (5,4%): ... 47
Figure 22: Loadings of for SPI 3 PCA 1 for each considered Station (75,6%) ... 47
Figure 23: Loadings of SPI 3 PCA 2 for each station (5,2%) ... 47
vi
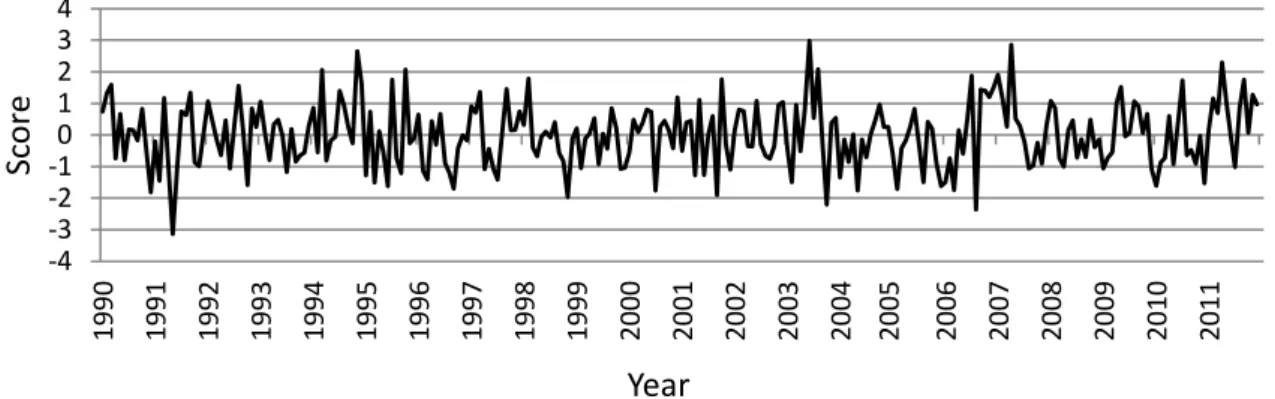
Figure 25 Average monthly temperature z-score (1990-2011) ... 49
Figure 26: Temperature PCA 1 Scores representing the considered percentage of accumulated variance (90,4%) ... 50
Figure 27: Temperature PCA 2 Scores representing the considered percentage of accumulated variance (2,8%) ... 50
Figure 28: Temperature PCA 1 ... 51
Figure 29: Temperature PCA 2 scores ... 51
Figure 30: Temperature Z-Score PCA Interpolation ... 51
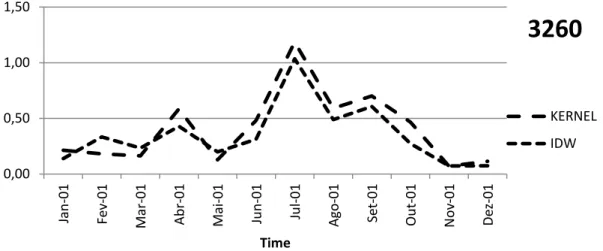
Figure 31: Comparison of the error estimated through cross-validation between Kernel and IDW (station 3260) ... 54
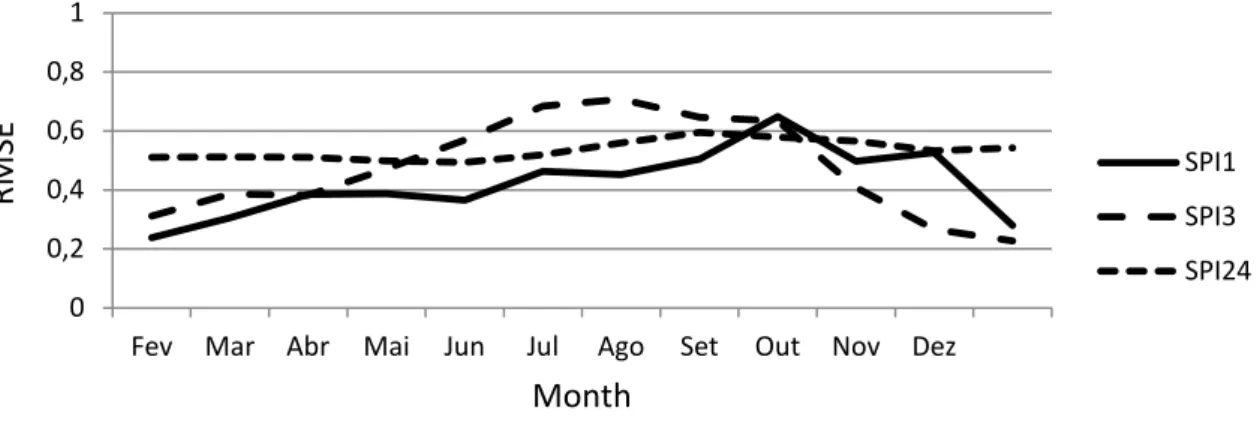
Figure 32: Average Monthly distribution of RMSE for the applied Kernel Interpolation (2001-2011) ... 55
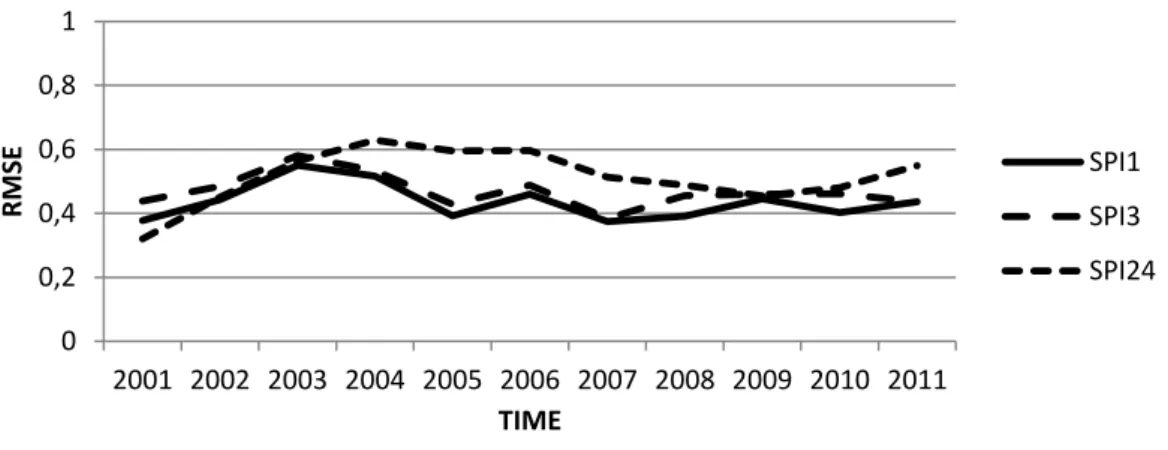
Figure 33: Average yearly distribution of RMSE for the applied Kernel Interpolation (2001-2011) ... 55
Figure 34: Average Monthly distribution of RMSE for the applied IDW Interpolation (2001-2011) ... 56
Figure 35: Average yearly distribution of RMSE for the applied Kernel Interpolation (2001-2011) ... 56
Figure 36: Terra MODIS C5 NDVI (solid lines) and AOD (dashed lines) time series for near-nadir 345 observations (VZA=-11) of tundra (left) and forest (right) during 2000-2010 with low (0.05, top), 346 moderate (0.2, middle), and high (0.5, bottom) AOD (Dongdong et al., 2012) ... 59
Figure 37: Station 2440 location ... 61
Figure 38: Mean NDVI temporal trend for the cells surrounding station 2440 within a 1km buffer ... 62
Figure 39: Mean deviation from average (NDVIdev) for the cells surrounding station 2440 within a 1km buffer ... 62
Figure 40: Mean percent difference (NDVI%) for the cells surrounding station 2440 within a 1km buffer ... 62
Figure 41: Spatial distribution of maximum (>100) and minimum (< -100) NDVI % anomalies between January 2001 and December 2011 ... 63
Figure 42: Spatial distribution of NDVI anomalies with more than 100% and less than -100% with altitude ... 63
Figure 43: Spatial distribution of NDVI anomalies with more than 100% and less than -100% within different slope (°) ranges ... 64
Figure 44: Variation of the mean percentage of cells with more than 100 and less than -100 percent change of NDVI with altitude for January and August ... 65
vii Figure 45: Variation of the mean percentage of cells with more than 100 and less than -100
percent change of NDVI over different land cover types for January and August ... 65
Figure 46: Comparison between December and August mean values of NDVI percent change from average for the period of 2001-2011 ... 66
Figure 47: Comparison between standard deviation for the cells within each Corine land cover polygons considering December and August mean values of NDVI percent change from average for the period of 2001-2011 ... 67
Figure 48: SM processing workflow ... 70
Figure 49: Percentage (%) of available cells per month in regards to the total coverage for the Province of Bolzano (2004-2009) ... 71
Figure 50: Vegetation indices, NDVI and NDWI, as a function of day of year (DOY) during SMEX02. Note the saturation of some indices after DOY 185 (Jackson et al., 2004) ... 73
Figure 51: NDII test sites (1-Vinschgau; 2-Pusterfal) ... 74
Figure 52: Yearly accumulated NDII for Vinschgau‘s and Pustertal’s test sites (south exposed) using the average of the cells collected between 900 and 1200m (2001-2011) ... 75
Figure 53: EURAC’s snow classification workflow (Notarnicola et al., 2013) ... 78
Figure 54: Comparison between NASA and EURAC Snow Cover Duration (SCD) assessment (Thirel et al., 2012) ... 79
Figure 55: Comparison between topographically corrected and non-corrected north exposed slopes in Mount Everest (Kaur et al., 2012) ... 79
Figure 56: Comparison between the NAO and the minimum Temperatures for Säntis, at 2500m (Beniston and Jungo, 2002) ... 82
Figure 57: Comparisson between the Geopotetntial Height (Z) for South Tyrol (2001-2011) an its monthly standard deviation for the available cells (considering standardized values) 83 Figure 58: Monthly Mean SPI 3 for South Tyrol from 2001 to 2011 ... 84
Figure 59: Monthly SPI 3 for the year of 2003 with Kernel interpolation ... 85
Figure 60: Mean Temperature monthly Z-Score values for South Tyrol (2001-2011) ... 86
Figure 61: Mean SPI 3 yearly magnitude between 2003 and 2007... 86
Figure 63: Seasonal (3 month) variation of the temperature z-score magnitude (2003-2007) ... 87
Figure 62: Mean SPI 24 yearly Magnitude between 2003 and 2007 ... 87
Figure 64: Monthly Interpolated SPI 24 for the year of 2003... 88
Figure 65: Monthly Interpolated SPI 24 for the year of 2007... 89
Figure 66: 2003 monthly accumulated precipitation for stations 220 (Vinschgau) and 9150 (Pustertal) ... 89
Figure 67: Yearly accumulated precipitation for stations 220 (Vinschgau) and 9150 8Pustertal ... 90
viii Figure 68: Comparison of the mean SPI 1 variation for South Tyrol over the Winter period (November to May) between 2002-2003 and 2006-2007 ... 90 Figure 69: Monthly SPI 1 between November 2002 and May 2003 ... 91 Figure 70: SPI 1 between November 2006 and May 2007 ... 91 Figure 71: Comparison of the mean temperature Z-Score variation for South Tyrol over the Winter period (November to May) between 2002-2003 and 2006-2007 ... 92 Figure 72: Mean Z-score of the Geopotential Height for South Tyrol (2001-2011) ... 92 Figure 73: Comparison between the Geopotential height anomalies (Z-Score) between the 2002-2003 and 2006-2007 ... 93 Figure 74: NDVI percent difference e from average for April 2003 ... 94 Figure 75: Relation between stations 970 standardized temperature and SPI with the accumulated yearly NDII for the selected coniferous forest cell at 1107m for Vinschgau (South exposed) between 2001 and 2011 ... 95 Figure 76: Correlation between NDII/T°C and NDII/SPI for the south exposed test site in Vinschgau (South exposed) over different altitudinal levels ... 95 Figure 77: Relation between stations 970 standardized temperature and SPI with the accumulated yearly NDII for the selected coniferous forest cells between 1200 and 1400mm for Pustertal (South exposed) between 2001 and 2011 ... 95 Figure 78: Correlation between NDII/T°C and NDII/SPI for the south exposed test site in Pustertal (South exposed) over different altitudinal levels ... 96 Figure 79: Coniferous forest Yearly accumulated DNII (2001 – 2011) ... 97 Figure 80: Coniferous forest yearly accumulated NDII difference from average (2001-2011) ... 98 Figure 81: Changes In SCD with more than 200 days per Winter (2002-2003 to 2007-2008) ... 99 Figure 82: Monthly snow cover duration ... 100 Figure 83: SCD difference from average (Winter of 2006-2007 ... 101 Figure 84: Comparison of the mean altitude per SCD for the Winters of 2002-2003 and 2006-2007 ... 101 Figure 85: Monthly average SCD alt different altitudinal ranges for the period of November-May between 2002 and 2007 ... 102
ix
TABLE INDEX
Table 1: Summary of the total drought events registered in the world from 1990 to 2013 (EM-DAT: The OFDA/CRED International Disaster Database, February 2013) ... 7 Table 2: Long-term annual precipitation average for Europe and the Great Alpine Region (Weingartner et al., 2009) ... 11 Table 3: Description of the selected drought indices (Adapted from Dai, 2010) ... 21 Table 4: Distribution of a cells with changes over 100% and below -100% over different ranges of SCD for the Winter of 2002-2003 (November to May) ... 66 Table 5: Sensors used in ESA soil moisture product ... 69
x
Acronyms
AWC – Available Water Content BT - Brightness Temperature CDI – Combined Drought Index DM – Drought Magnitude
EEA – European Environmental Agency EO – Earth Observation
ESA – European Space Agency GAR – Great Alpine Region IDW – Inverse Distance Weighting
IPCC – international Panel for Climate Change LST – land Surface Temperature
Mc – Magnitude of Change
MODIS - Moderate Resolution Spectroradiometer NDII – Normalized Difference Infrared Index NDSI – Normalized Difference Snow Index NDVI – Normalized Difference Vegetation index
NDVI% - Normalized Difference Vegetation index percent anomaly NDVIdev – NDVI deviation from Average
NDVIref – NDVI Reference Value NIR – Near Infra-Red
PCA – Principal Component Analysis PDI – Precipitation Drought Index PDSI – Palmer Drought Severity Index PET – Potential Evapotranspiration
RDRI – Remote Sensing Drought Risk Index RMSE – Root Mean Square Error
xi Sc-PDSI – Self-Calibrated PDSI
SPEI – Standard Precipitation and evapotranspiration Index SPI – Standard Precipitation Index
SVI – Standardized Vegetation Index SWE – Snow Water Equievalent SWIR – Shortwave Infra-Red
SWSI – Surface Water Supply Index TCI – Temperature Condition Index TDI - temperadure Drought Index
VCADI – Vegetation Condition Albedo Drought Index VDI – vegetation Drought Index
VegDri – Vegetation Drought Response Index VWC – Vegetation Water Content
xii
ABSTRACT
Developed in the scope of the ModEOalp project financed by European Academy of Bolzano (EURAC) research center Institute of Applied Remote Sensing, the presented research provides an evaluation of the effectiveness of integration of in situ and remote sensing data for the identification and evaluation of drought events over the region of South Tyrol.
As shown by several studies developed on the effect of climate change on snow cover in the Great Alpine Region (Weingartner et al., 2009; Beniston, 2012; López-Moreno et al., 2012), climate change acquires a major role presenting itself as a large mid and long-term issue on both regional and continental level. Although the concept of drought still does not acquire a significant role within the alpine region climate change research, the variation of both precipitation and temperature during the last decades as well as the resulting changes in snow dynamics point to a growing and worrying tendency.
Focusing its attention on an 11 year period between January 2001 and December 2011, the statistical and GIS methods proposed and applied within this research allowed for the evaluation of interannual variability of South Tyrol’s climate within this period, contributing for the identification of extreme climate events and for the observation of its implications over vegetation and snow. Although snow presents itself as an important indicator of short-term changes in meteorological patterns directly responding to incoming precipitation as well as to rapid changes in temperature, vegetation plays a major role, providing an indicator of the intensity of the observed extreme climate events revealing the effect of prolonged water scarcity and signaling the presence (or absence) of drought.
Within the considered 11 year period, the application of the SPI as an indicator of meteorological drought as well as the standardization of temperature managed to successfully identify extreme climate events providing the basis for future investigation. In this contexto, the application of MODIS imagery assumes a fundamental role in the developed workflow. The usage of índices like NDVI and NDII as well as the spatial information of the presence of snow creates the potential for the validation of the performed statistical analysis as well as its application in the monitoring of the studied phenomena over complex topographic surfaces..Through the applied statistical analysis, 2003, usually referred to an important peak during the 21th century due to the high intensity of the registered changes in both precipitation deficits and temperature increases, showed significant changes during the Summer, revealing high positive temperature anomalies as well as extremely dry conditions. Despite this, considering the mid-term changes in precipitation anomalies, the period between 2003 and 2007 acquired a comparatively larger
xiii role within the studied climate dynamics. Although SPI 24 indicates to the presence of low intensity events pass 2003, the continued accumulated precipitation deficit allied to the strong and continuous accumulated positive temperature anomalies reveals the presence of a mid-term drought event which consequences over natural vegetation are visible through the application of remote sensing methods, revealing the application of moderate resolution satellite imagery and of its combination with in situ measurements for the monitoring of climate changes and its impacts over highly complex surfaces.
Key-Words: Drought, Climate Change, Remote Sensing, Geographic Information Systems, mountains, time-series analysis
xiv
RESUMO
Desenvolvido no seio do projeto ModEOalp, financiado pelo Instituto de Deteção Remota Aplicada, centro de investigaçao da Academia Europeia de Bolzano (EURAC), o presente trabalho de investigação providencia uma avaliação da eficiência da integração de dados de campo e de deteção remota para a identificação e avaliação de eventos de seca sobre a região da Tirol do Sul.
Como demonstrado em diversos estudos (Weingartner et al., 2009; Beniston, 2012; López-Moreno et al., 2012) desenvolvidos em torno do efeito das alterações climáticas sobre a neve na Grande Região Alpina (GRA), as alterações climáticas adquirem um papel fundamental, apresentando-se como uma problemática fundamental a médio e longo prazo à escala regional e continental. Devido à sua contribuição para a manutenção dos níveis de água de alguns dos maiores rios europeus (Danubio, Rhine e o Pó), a GRA adquire uma forte dimensão estratégica sendo a sua manutenção fundamental para garantir a subsistência das comunidades europeias. Apesar de o conceito de seca ainda não adquirir um papel expressivo no contexto da investigação desenvolvida em torno das alterações climáticas na região alpina, a variação da precipitação e da temperatura ao longo das ultimas décadas assim como as consequentes alterações verificadas sobre a neve apontam para ma crescente e preocupante tendência. Como demonstrado por Beniston et al. (1997 , 2002, 2012), embora as a alteração registadas ao nível da quantidade e densidade da neve precipitada durante o inverno ao longo dos últimos 60 anos não sugiram o alcançar de valores preocupantes assim como visíveis implicações para as comunidades que desta dependem para o abastecimento de água e para o desenvolver de atividades turísticas, a tendência negativa observada obriga à consciencialização por parte dos atores envolvidos para as suas possíveis repercussões. Consequentemente, a monitorização das condições meteorológicas assim como das alterações por estas criadas sobre a superfície assume um papel fundamental, contribuindo para a mitigação dos efeitos negativos originados por potenciais eventos de escassez de água.
Focando a sua atenção num período de 11 anos entre 2001 e 2011, a combinação dos métodos estatísticos e de SIG propostos e aplicados no âmbito do presente trabalho de investigação permitiram a avaliação do comportamento espácio-temporal das alterações climáticas na Tirol do Sul durante este período, contribuindo para a identificação de eventos climáticos extremos e para a observação das suas implicações sobre a vegetação e a neve. Enquanto que a neve se apresentar como um importante indicador das mudanças nos padrões meteorológicos a curto-prazo respondendo diretamente à precipitação recebida assim como às rápidas alterações da temperatura, a vegetação desempenha um papel
xv fundamental, providenciando um indicador da intensidade dos eventos climáticos extremos observados, revelando o efeito da prolongada escassez de água e assinalando a presença (ou ausência) de eventos de seca. Consequentemente, a adoção de uma abordagem multi-temporal para a identificação torna-se essencial para a identificação de eventos de seca, permitindo a compreensão da influência cumulativas das alterações registadas e motivando a perceção de potenciais impactos sobre a superfície e contribuindo para a antecipação e mitigação de efeitos negativos sobre as comunidades humanas e naturais.
No âmbito do período de 11 anos considerado, a aplicação do SPI como um indicador de seca meteorológica assim como a estandardização da temperatura permitiram a bem-sucedida identificação de eventos climáticos extremos a várias escalas temporais, providenciando as bases necessárias para o desenvolvimento de futura investigação científica. Neste contexto, a utilização de imagens MODIS assume um papel fundamental no trabalho desenvolvido. A utilização de índices como o NDVI e o NDII assim como informação espacial da presença de neve sobre a superfície estudada potencializam a validação da análise estatística efetuada providenciando uma maior robustez a esta e criando as bases necessárias para a sua aplicação na monitorização do fenómeno estudado em superfícies topográficas complexas. Através da análise estatística aplicada, 2003, frequentemente referido como um importante pico na primeira década do século 21 devido à elevada intensidade das alterações registadas tanto no observado deficit de precipitação como no aumento das temperaturas, revelou elevadas anomalias positivas de temperatura assim como condições extremamente secas. Apesar disto, considerando as alterações das anomalias de precipitação a médio prazo, o período entre 2003 e 2007 adquire um papel comparativamente maior na compreensão das dinâmicas climáticas estudadas. Apesar de o SPI 24 apontar para uma baixa intensidade do deficit de precipitação após 2003, a presença continuada de um deficit de precipitação aliada à forte e acumulada acumulação de anomalias positivas de temperatura revelam a presença de um evento de seca a médio-prazo cujas consequências são visíveis pela aplicação de métodos de deteção remota, revelando a aplicabilidade de imagens de satélite de resolução moderada e da sua combinação com medições de campo para a monitorização das alterações climáticas e dos seus impactos sobre superfícies altamente complexas.
Palavras-chave: Seca, Alterações climáticas; Sistemas de informação Geográfica, Montanhas; Análise de séries temporais
1
1. INTRODUCTION
1.1. Research Motivation
While a wide research has been developed over the Great Alpine Region (GAR) in the scope of climate change and its related short and long term impacts (Beniston, 1997, 2003, 2006, 2012; Calanca, 2007; López-Moreno et al., 2009, 2012; Sorg et al., 2012; Weingartner et al., 2009), its overwhelming complexity and spatial heterogeneity sets the requirement for further investigation (López-Moreno et al., 2012) in order to promote the development of an accurate and comprehensive view of the nature-community interactions as well as their individual spatial and temporal dynamics and patterns.
According to the European Environmental Agency (EEA) Report n°8 (2009) developed on the scope of the GAR emerging climate change and adaptation issues, the lack of solid and sustained knowledge about local impacts of climate change imposes itself as a barrier to political commitment. As such, the understanding of the multi-level spatial complexity of climate change facilitates the development and application of adaptation strategies by promoting the clarification of the real implications of the observed changes on a community level and promoting the establishment of an adequate structure for governmental response.
In addition, the observed surface complexity creates particular challenges for the application of remotely sensed data in the evaluation of climate change induced impacts. The high surface roughness and the highly diverse land cover originate errors in the obtained reading which influence the resulting interpretations of the collected data. At the same time, the resolution of the acquired data sets becomes an issue, the application of an inadequate resolution data originates overly rough estimations of surface changes, masking small and medium scale variations of the target physical parameters and inducing potentially misleading conclusions.
As a result, the application of high and moderate resolution satellite data on the scope of climate change monitoring over mountainous regions maintains itself as a large and diversified topic for research for the creation of new assessment methods (and refinement of existing ones), promoting further testing in regards to its usage in the spatialization of physical parameters as well as the validity of its inclusion as an input for the modeling of complex phenomena such as drought.
2 1.2. Objectives
Through the analysis of satellite and ground truth data, the proposed workflow (figure 1) aims to identify statistically significant changes in climate patterns as well as potential consequent drought events and to assess their direct and cumulative impacts focusing its attention in the South Tyrol region. For the achievement of this primary objective, the developed research tries to build and test a simple and comprehensive methodology for the identification of the temporal and spatial dimension of anomalous changes meteorological patterns as well as its influence on the surface. The hypothesis behind the proposed research can be divided in two major groups of questions:
1) Have there been any significant meteorological anomalies over the past eleven years (2001 – 2011) registered over the South Tyrol? Can these events be spatialized? 2) Have the identified events produced significant ground impacts? Are these visible
through remotely sensed data?
.Answering the proposed questions presents itself as a crucial step in order to evaluate the spatial and temporal behavior of the potential changes in local climate patterns as well as its implications for both natural processes and human activities. In order to do so, two major sources of data will be analyzed.
At a first instance, meteorological patterns will be evaluated trough statistical methods in order to assess the presence of significant changes in the local climate as a potential indicator of drought. In the present study, a focus will be given to precipitation and temperature as major indicators of change. Additionally, geopotential height will be looked upon in order to validate the findings of similar studies, verifying the influence of general circulation patterns in the regional and local climate.
Secondly, satellite data was used as a support in order to assess the potential application of Earth Observation for the assessment of drought events. In the scope of this study, a focus will be given to vegetation and snow trough MODIS derived products focusing on the last eleven years, from 2001 to 2011. Although the proposed time frame can be perceived as relatively short to achieve an efficient evaluation the significance of the statistically identified extreme events, the start of the MODIS Aqua and Terra missions in 2001 conditions the selection of the time frame for the proposed study. Although other data sources are available for a longer time frame, the lack of a stable temporal resolution (e.g. Landsat, with a 16day data collection) and of an adequate spatial resolution (e.g. AVHRR, with 1km cell size) limits the potential for the extension of the reference period.
3 Figure 1: Methodological workflow for the proposed research
4 Despite the presented limitation, the analysis of meteorological data will be performed separately. A longer time frame for the evaluation of changes in meteorological patterns will be considered (30years for precipitation and air pressure and 20 years for temperature) maintaining the attention over the considered 11 year time frame as a support for further correlations.
In regard to the proposed approach, it is important to refrain that the developed methodology will focus on the evaluation and identification of statistically significant climate changes and its related impacts. As a result, the actual precipitation and temperature values will not be looked upon in the scope of this study. Additionally, the evaluation of changes in climate will be taken into consideration as a support for the identification of periods of high intensity allowing for the evaluation of the changes perceived through remote sensing methods as well as of their relation to the changes identified through the analysis of meteorological data.
1.3. Organization of the Thesis
This thesis is divided into five major chapters. Chapter one gives a general background of the concept of the proposed research, as well as an overview of its conceptual basis discussing the role of drought in the scope of climate change. A characterization of South Tyrol as well as a discussion of the relevance of the proposed research topic for the region of interest will also be presented. Additionally, the research objectives and hypothesis are provided.
The second chapter aims to discuss the available methodologies for the evaluation of drought events. Having this in mind, a discussion of the pros and cons of a set of pre-selected methods is developed, looking to choose an adequate method for the identification of shifts in accumulated precipitation amounts and of anomalous climate patterns in South Tyrol.
The third chapter will present a detailed discussion of the applied methodology, being organized in three major subchapters.
At a first instance, the collection of long-term ground measurements of temperature and precipitation and its analysis through the application of a statistical analysis will allow for the identification of outliers and, consequently, for the highlighting of periods of interest. Air pressure over the region will also be analyzed through the evaluation of the geopotential height as a support for the assessment of the regional behavior of the considered variables.
5 As a second major component of the proposed workflow, a focus will be given to satellite based data sources. MODIS time series of both NDVI (Normalized Difference Vegetation Index) and NDII (Normalized Difference Infrared Index) will be evaluated looking to assess the existence of potential ground impacts originated by long term water scarcity.
In this subsection, snow also acquired a major role. Recognizing the importance of snow as an input to the alpine water balance, MODIS based snow duration between 2002 and 2011 will be analyzed, looking to identify changes in snow cover duration over the reference period.
As a final component of the proposed methodology, a spatial and statistical analysis of the acquired variables will be performed in order to accurately assess ground changes resulting from the alteration of precipitation and temperature patterns.
The fourth chapter presents a discussion of the acquired results. Due to the lack of temporally accurate and spatially distributed statistical data of regarding locale economic activities, the evaluation of impacts on human communities over the identified periods of interest and the validation of the proposed methodology will be based on experts opinion and on local experience.
The fifth and last chapter will provide the major conclusions of the developed workflow, as well as its contribution for future developments and research in the scope of climate change analysis of the South Tyrol and (potentially) over the alpine region.
1.4. Research Concept
In the context of climate change, drought becomes a pressing topic presenting itself as both a physical and human phenomenon.
The role of climate change as a major long-term global issue is now a widely accepted fact (IPCC, 2007). Although the definition of its origins is still the target of a prominent and sensible discussion, the changes in general atmospheric circulation and the consequent impacts in local climate patterns are a reality and an escalating threat for the sustainability of human activities (Beniston, 2006). Consequently, as the awareness of the climate change grows, so does the realization of its potential implication over water resources (Beniston, 2010).
The Changes in climatic patters originates fluctuations in precipitation regimes as well as temperature levels (figure 2), conducing to the "intensification, acceleration, and enhancement of the global hydrologic cycle" (Randhir, 2012, p.1) , promoting an increase of extreme events on a global level (Mishra and Singh, 2010) and contributing for water supply
6 shortages and changes in water quality (Kundzewicz et al., 2013). As a result, water dependent human activities reveal a rising vulnerability to potential drought phenomena, obligating to the adaptation of both scientific and political spheres.
Figure 2: Global Average surface temperature anomaly (°C) from in situ and reanalysis data (adapted from EEA Report No 12/2012, Blunden et al., 2011)
Described a "natural but temporary imbalance of water availability" (Paulo and Pereira, 2004, p.115), drought presents itself as a complex phenomenon of regional implications (Hisdal and Tallaksen, 2000) being characterized by a slow and gradual development (Moreira et al., 2008) over time and space. As a result, drought acquires a wide temporal and spatial dimension which creates issues in terms of its determination and monitoring. While other natural hazards (e.g. floods) evolve in a short time frame within a local context, droughts effects are seen and measured in a cumulative fashion over long periods of time, representing subtle and occasionally unperceived changes over the landscape.
Despite this knowledge, at the eyes of society, droughts seem to have a low significance in the scope of natural hazards (Lehner, 2006). However, droughts play a major role in both the social and economic reign being responsible for severe rise material and immaterial losses and posing as major threats for human sustainability (Mishra and Singh, 2010). The expansion of the occupation of human activities over the landscape and the
7 consequent rise in water demands aggravated by the changes in meteorological patterns has originated an increasing stress over existing water resources, having produced several water supply issues over different parts of the world with noticeable intensity in the past few years (Mishra and Singh, 2010).
According to EM_DATA (Table 1), drought has affected more than 8 million people producing a total of estimated damages of more than 10 million $US between 1900 and 2013. While Africa presents the larger number of events (290) is important to stress the discrepancies in registered financial damages. Despite having a comparatively lower number of registered events (39), Europe presents a noticeably higher value of quantified damages, achieving a total of 22 million $US in losses. As a conclusion, in the scope of climate change, droughts are no longer a problem of developing countries presenting as a serious global threat.
Continent # of
Events Killed Total Affected Damage (000 US$)
Africa 290 844143 360136673 2920593
Americas 128 77 69292226 28811139
Asia 152 9663389 1707836029 34251865
Europe 39 1200002 15482969 22691309
Oceania 20 660 8027635 10703000
Table 1: Summary of the total drought events registered in the world from 1990 to 2013 (EM-DAT: The OFDA/CRED International Disaster Database, February 2013)
Although the presence and significance of droughts in the scope of climate change begins to acquire a major role in the definition of human activities presenting itself as an important source of long-term financial and physical damage, the usage of this term should be looked upon carefully. Due to the large ramifications of water supply and demand that influence the functioning of the hydrological (Rijsberman, 2006), the understanding of the drought phenomenon as well as the interpretation of the results provided by the application of standard and new assessment methodologies should be conditioned by the knowledge and comprehension of local physical and human dynamics.
The significance of the observed and projected changes in meteorological and climate patterns as well of its implication it’s widely dependent on the contours of the human activities over the landscape. For example, while the temperature rises can be perceived as a negative impact of the observed in climate, it can simultaneously present itself as a positive input for agriculture contributing for the plant growth rates and for the consequent overall productivity (Paveena, 2006) However, on the long-term, the proposed change can produce
8 negative implication for agriculture. The intensification of plant activity can generate a degradation of soil properties, compromising its long-term exploration.
As a result, drought preventive measures against water scarcity are not universally applicable (Wagner et al., 2012). These are dependent on the socio-economic context as well as on the usage of the landscape and its physical characteristics. In agriculture, the water consumption varies considerably depending on land use (Wagner, 2009). Different crops have different water usages and needs obligating to the readjustment of the assessment methods and interventive measures for the mitigation of long-term impacts.
Although the definition of drought and its assessment in terms of its direct and indirect impacts becomes a particularly difficult challenge, from a methodological perspective, in the scope of drought assessment a clear scientific terminology is found presenting a downscaling of the complexity of concept of drought according to the proposed scale of analysis as well as its data requirements. According to Hisdal and Tallaksen (2000), droughts can be divided into four major groups: meteorological, agricultural, hydrological and socio-economic (figure 3).
Figure 3: The sequence of drought impacts associated with meteorological, agricultural and hydrological drought (Hisdal e Tallaksen, 2000
9 While meteorological drought correspond to a deficit of precipitation in regard to the expected “normal”, agricultural and hydrological drought result from mid to long-term changes in the received precipitation which influence the water storage levels as well as soil moisture, severely compromising the maintenance of the ecosystems functions and hindering the potential crop productivity.
As for socio-economic drought, it is defined as a deficit between supply and demand of water resources (Mishra and Singh, 2010). In this context, the definition of drought becomes widely dependent not just on its physical characteristics but also in its potential repercussion for human sustainability.
Taking into account the proposed definitions, within a scientific perspective, drought acquires a marked temporal and spatial dimension, weighted by its impact on both human and natural systems. As a result of the proposed downscaling of the drought concept its rising complexity makes the achievement of universally accepted definition of drought an arduous task being conditioned by the available data as well as the characteristics of the chosen study area.
Despite the different scales of analysis as well as the distinct levels of complexity present in each of the considered denominations, it should be reminded that the downscaling of the observed events and the focus on the fine scale interactions developed between human and natural environments imply an increased amount of demanded data for the development of an accurate assessment. While meteorological drought assessments focus their attention on collected quantitative data of received precipitation and temperature levels, agricultural and hydrological require a larger set of variables, obligating to the adoption of a sampling process in order to evaluate local and sub-regional changes. As for socio-economic drought assessments, the definition of drought as the repercussion of visible impacts of water scarcity over human activities generates the need for accurate and spatial distributed statistical data representative of the studied communities.
As a result, the risk for the loss of a complete understanding of the regional dynamics becomes a crucial issue limiting a complete and comprehensive evaluation of the spatial variability of droughts as well as their distributed impacts. As a result, a multi-scalar approach is needed in order to fully understand both physical and human implications of droughts, allowing for an accurate assessment of its impacts and, consequently, promoting the development efficient prevention and mitigation measurements.
10 1.5. Drought in Europe
In Europe, the issues revolving around climate change and drought are not a new discussion. As mention By Lloyd-Hughes and Saunders (2002), droughts are not limited to the historically hotter Mediterranean climate. In reality, droughts are a characteristic hazard of the European climate which affects alike areas characterized by low and high accumulated precipitation. As a result, drought as a hazard as gained a major role next to the scientific and political community motivating the discussion for long-term prevention and mitigation of potential water scarcity issues.
Although in Europe the stable quality and abundance of supply of freshwater resources appear to be sufficient to meet the existing demand (EEA Report n°2, 2009), the over-exploration of existing resources by the rise of economic sectors like agriculture, tourism and hydropower allied to the observed and projected changes in meteorological patterns (figure 4) leads to an increased risk for the potential deficit of available resources. During the 20th century several devastating drought events have been registered over Europe (Austria, 1973; Iberian Peninsula, 1990-1995; All Europe, 2003) creating considerable financial damages.1
According to the European Commission, by 2007, 11% of the European population as Well as 17% of the territory had been affected by water scarcity2.
In Europe, although the changes in received and stored liquid precipitation becomes a crucial parameter for the monitoring of drought over the continent, the stored water under the form of snow and ice is a fundamental resource which utmost importance should not be forgotten. The changes in water stored in its solid form compromises the management of river flow during the hot summer months (Barnet et al., 2005), leading to negative implications over crop productivity as well as available drinking water. As a result, Europe´s mountainous regions like the Alps acquire a fundamental role in the management of the
1
http://www.geographyinthenews.rgs.org/resources/documents/A%20History%20of%20Drought%20in %20Europe%20-%20Factsheet.pdf
2http://ec.europa.eu/environment/water/quantity/scarcity_en.htm
Figure 4: Projected Annual changes in precipitation over Europe between 2071– 2100 (van der Linden and Mitchell, 2009)
11 hydrological cycle of nearby dry regions, receiving special attention in the scope of the European level climate change politics.
1.6. The Great Alpine Region (GAR)
The alpine areas of the world play a major role in the global and regional scale hydrological processes (Verbunt et al., 2003).
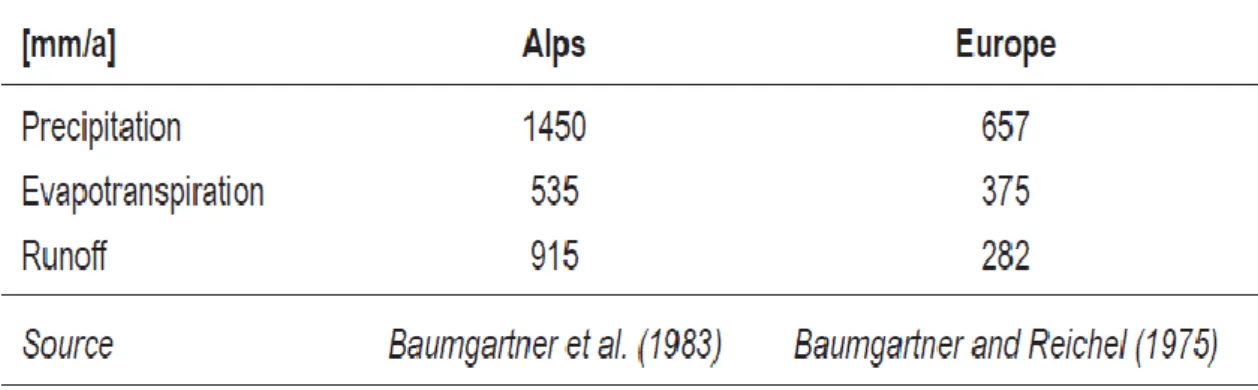
Referred to as “the water tower of Europe” (Weingarner et al. (2009), the Alps have a major role in water supply dynamics in central and western Europe (table 2), being responsible for the maintenance of some of the major European rivers like the Danube, the Rhine and the Po. As a result, the issues revolving around water availability in the Great Alpine Region (GAR) gain a marked multi-dimensionality, revealing a crucial role in European level water management.
Table 2: Long-term annual precipitation average for Europe and the Great Alpine Region (Weingartner
et al., 2009)
In the context of climate change, the GAR as registered an accentuated temperature rise, this being “twice the global average” (EEA Report, 2009), with an increase of 2°C, presenting itself as a particularly vulnerable environment to potential climate change impacts. Although the last years do not reveal severe modifications in the functioning of ecological systems due to climate change (Beniston, 2012), projections show a continuous decrease of precipitation accumulated amounts accompanied by a gradual increase of temperature levels (Figure 5), creating a growingly risk for water scarcity episodes on the scope of the increase of water demand resulting from the growth of agricultural and tourism sectors.
12
Figure 6: Projected Change in annual days ofsnowfall (Vajda et al., 2011) Figure 5 Projected seasonal changes in Temperature and Precipitation until the end of the 21th
century (EEA, 2009).
The European Alps have shown to be a good example of the observed changes in precipitation and temperature patterns as well for the assessment of climate-related impacts (Beniston, 2012). Climate within the Alps changes rapidly “within short altitudinal distances” (Beniston, 2003) providing a clear notion of its influence in both vegetation and local hydrological processes. As a result, the alpine mountains become a unique area of study, allowing for a clear assessment of short and long-term variability of the landscape as an indicator of climate induced changes.
In the GAR, the glaciers retreat and the decrease in snow availability over the past few decades presents a worrying tendency, creating potential risks for the development of water management issues in the future (figure 6). Although the maintenance of adequate
13 water levels during the last decades within the GAR gives the concept of drought a minor role in the scope of the hazards targeted by scientific and political responses, the proposed projections for the next decades as well as the recent extreme dry events of 2003 and 2005 reveal the presence of a rising threat, suggesting a potential risk for the alteration of the hydrological cycle of snow dominated areas (Figure 6), originating a decrease in runoff and consequently creating regional water shortages due to inadequate storage capacity (Barnett et al., 2005). As a consequence, the risk of drought within the GAR becomes increasingly larger (Calanca, 2007) demanding the development of an increased awareness of its implications.
For this, a clear and precise understanding of the temporal and spatial changes in meteorological patterns in the GAR is essential, allowing for an accurate assessment of current and potential impacts and, in this manner, creating the necessary theoretical and practical basis for the mitigation of potential impacts and for the aggravation of their magnitude due to the application of inefficient intervention strategies.
Recent evidences regarding the decrease of snowfall as well as the glacier and permafrost reduction observed over several mountainous regions in the European Alps (López-Moreno et al., 2009; Beniston, 1997; Song et al., 2012) create awareness for potential negative impacts over water availability. Additionally, due to their role in the overall financial income through winter sports and tourism (Uhlmann et al., 2009), the decrease in snow reliability creates aggravated risks for tourism dependent economies (Amelung and Moreno, 2009).
From a political perspective, in Europe, the Alps receive special attention from both decision makers and stakeholders (EEA Report n°8, 2009). At the alpine level, the Alpine Convention becomes a fundamental milestone for the governmental response to climate change, promoting a sustainable development of the GAR by acting as an integrated framework treaty. In the scope of this framework, climate change appears as a major topic, being observed by the convention members as a long-term priority as well as major topic of political discussion. As a result of this, the development of the Action Plan on Climate Change in the Alps of 2009 3demonstrates the commitment and awareness of the members of the region for the mitigation of climate change related impacts.
Although the mentioned action plan does not impose itself as a legislative document for the management of climate change it represents the political and scientific awareness in relation to the importance of climate change implications over the alpine region, revealing the rising value given to its assessment and motorization.
14 1.7. Study Area: South Tyrol
Located in the heart of the GAR within the dry alpine inner valley (figure 7), the South Tyrol presents itself as a unique and diversified region in both physical and human spheres.
Having borders with Switzerland (West) and Austria (East and North), South Tyrol (figure 8) has an area of 7.4 Km2. Often named as the door to the Alps, the province presents a highly diversified and complex topography. While the southern valleys of the region present altitudes little above 200 meters, an overall average altitude of 1500 meters, achieving heights close to 4000 meters in Val Venosta (Vinchgau), located at the West of the region.
Figure 7: Location of the Study Area
15 According to Stingl and Mair (2005), South Tyrol presents a particularly complex landscape marked by a highly diversified geological subset. Dominated by metamorphic rocks in the west and north and by magmatic rocks in the center and south as well as sedimentary rocks (mainly limestone) I the south-East occupied by the Dolomites, , the region presents a largely heterogeneous and complex morphology creating large biophysical spatial diversity.
As a result from the marked topographic variability observed throughout the region, climate patterns show a similar spatially asymmetric behaviour. South Tyrol presents clear regional differences in terms of precipitation, revealing a well-defined contrast between Vinchgau and Pustertal (located in the North-East) affecting the distribution of the region’s hydrological balance (Figure 9). In terms of annual average precipitation, the proposed differences become clear. While Val Venosta is characterized by low precipitation values, achieving an average annual amount of accumulated precipitation below 500mm in the valley bottom, Pustertal reveals an average of 1200 mm in the valleys and more than 2000 mm in the mountain tops.
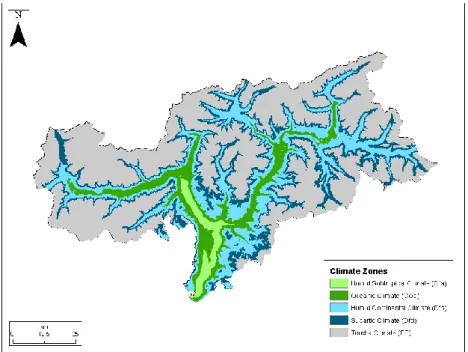
16 The observed differences in precipitation are explained by the climate diversity of the region. Regarding its classification (figure 10) the region climate shows a clear influence of the horizontal topographic variation. While the low altitudes that characterize the Adige valley (0-200m) are defined by a subtropical climate, characterized by moderate temperatures and dry summers, the rise in altitude is accompanied by a rising moisture and lowering temperatures achieving polar climates in the highlands above the 1700 meters. Above the 2500 meters mark, the significantly lower temperatures are shown by the presence of glaciers and perpetual snow.
Figure 10: South Tyrol Climate Zones according to Köppen´s climate classification
Despite the sub regional differences in climate and its consequent influence in water availability, on the aggregate, the region presents itself as a major source of water for nearby regions. The Adige river (the second longest in Italy) which has most of its basin located within the province it’s a fundamental source of water, representing a major resource for the agricultural dominate Emilia-Romagna region on the south of Trentino-High Adige. In the South Tyrol region, the Adige plays a major role, being fundamental for the maintenance of the agricultural explorations in the Veneto region which is largely dependent on intensive irrigation. Additionally, snow and ice also play an important role in water supply. Snow and ice accumulation dynamics during the winter and its melting with the rising temperature represent a significant input for the local water resources largely influencing the maintenance of the discharge of the existing water bodies (both rivers and lakes alike).
17 In terms of land use, South Tyrol presents a highly diversified landscape showing a well-defined vertical structure (EEA Report, n°8, 2009), “with densely populated and intensively used valleys bottom” (p.76). Forest cover plays a major role in the region, occupying around 43% of the total area, followed by bare rocks (19.6%) and grasslands (17.1 %).
Figure 11: Land Use cover (Reakart Land use map, 2001)
Despite the low percentage of arable land (2.9%), agriculture in terms of permanent crops (vineyards, orchards) and pasture plays a major role in the region acquiring a large cultural role as well as an indirect economic role, attracting tourism related activities through due to the cultural value given to the consequent changes of the landscape and to the related cultural activities.
Regarding to its economic characteristics, the region’s economic sectors reveal a high water dependency. In Vinchgau, due to the lower registered precipitation, irrigation has become a tool of large importance, being fundamental for the preservation of plant health and productivity over the dry summer. At the same time, water becomes important in Winter shielding the plants from below zero temperatures trough sprinkling.
Besides agriculture, tourism and the hydropower sector show a high dependence in water. While hydropower presents itself as a major source of energy in the region, tourism represents one of the biggest sources of income. As a representation of this fact, the service sector comprises more than 70% of the total working population. In winter, artificial snow production has become a common practice, allowing for an adequate response to the tourist, consequently creating a bigger pressure over the existing water resources.
18 1.7.1.Climate Change in South Tyrol
As mentioned, recent years have shown preoccupying trends in relation to climate conditions within the GAR. The combination of a series of dry years with the increasing water demand from agriculture, tourism and households has turned water scarcity into a present issue, contributing for the development of awareness for the trends in climate patterns as well as their potential impacts over the alpine region.
Figure 12: Relation between the average monthly temperature and accumulated precipitation for 2003 and its historical average for the city of Bolzano meteorological station (adapted from Servizio
Meteorologico della Provincia Autonoma di Bolzano, 2003)
The monthly climate reports provided by the Hydrographic Institute of the province of Bolzano show a significant shift in the climate patterns over the last decade. According to the province, 2003 was an exceptional year (ClimaReport, February 2003). While the first months showed to be significantly dry, the Summer period was marked by very high temperature in regards to the historical average. According to the mentioned report, the average temperature in Bolzano showed an increase in relation to average of 0,9°C.
Excluding the 2003 event, no significant climate extremes over the province have been reported over the last few years limiting the definition of a potential trend. However, the registered peak of high temperature values and low accumulated precipitation amounts
19 registered in 2003 represents an important precedent motivating the development of a strong awareness for climate change related impacts.
Apart from the observed change, the lack of accurate spatial and temporal distributed data creates difficulties in the understanding of the meaning of these events, compromising the transposition of the acquired knowledge and the its transformation into a practical input for the monitoring of climate change and its related impacts. As a result, the understanding and quantification of these changes is required, obligating to the evaluation of the evolution of the regions climate and of the changes originated by it over the surface.
In order to fully comprehend important of the observed climate extremes, the regions historical experience in the management of water scarcity should be taken into consideration. Vinschgau as well as the surrounding of Brixen are integrated into the inner-alpine valleys where water presents itself as a rare resource. As a result, a strong cultural experience is noted. While Vinschgau presents comparatively lower annual accumulated precipitation, the historical experience with water scarcity has motivated the development of complex water channeling systems fomenting the development of a strong tradition around agriculture related economic activities.
Although a clear political strategy directed for climate change is not defined in South Tyrol, the growing awareness demonstrated by stakeholders and administrative officers in regard to the importance of climate and in the preservation of the sustainability of local activities as motivated the development and implementation of a strong and oriented water management policy.
20 2. METHODS FOR DROUGHT ASSESSMENT
The development of indices in the scope of the identification of drought events is an essential step for their evaluation and monitoring, allowing for a clear and comprehensive understanding of their physical dynamics and resulting impacts. However, the empirical and quantitative approach chosen in the selection and integration of the required for the evaluation of drought events is highly dependent on the characteristics of the selected test site, contributing for the diversification of the concept of drought and, in this way, originating great difficulties in the achievement of a common and generally accepted conceptual and practical framework. As a result, “as there is no single and unique accepted definition of a drought, there is no single universal drought index, either” (Niemeyer, 2008). According to the author, “more than 80 indices have been easily identified”, demonstrating the rising emphasis of this subject in the scientific community as a part of the discussion developed around climate change related issues.
The challenge of the presented analysis lies in the conjugation of both scientific and application requirements (Niemeyer, 2008). While, from the scientific point of view the modeling of drought events is seen as a complex issue combining a wide variety of disciplines as well as strong theoretical knowledge about the physical characteristic of the considered geographic region, the need for an operational assessment capable to respond to the demands of the water management sector obligates to a “simplification” of the theoretical knowledge and its transformation into a ready for use product available in an adequate time frame.
In the context of climate change, the changes in precipitation and temperature patterns and the apparent long-term instability of meteorological and climatological phenomena reveal the rise of “new” scenarios, obligating to the adaptation of human activities to the to the imposed climate change in order to guaranty their sustainability. With this, the understanding and monitoring of climate variability presents itself as an important step, requiring the establishment of efficient and reliable methodologies for the assessment and monitoring of both its spatial-temporal dynamics as well as their impacts.
This chapter provides a comparison of available drought indices. It serves as a basis for a selection of adequate methods for the quantification and classification of both dry and wet periods. Taking into account the large amount of available indices, the present discussion will focus on a set of selected indices which better represent both the state of the art developments in this field as well as the desired traits for their application in the proposed study area.
21 2.1. INDICES (Statistical Evaluation)
Although initially developed indices focus on a purely statistical and mathematical approach for the analysis of in situ data limiting (at a first instance) the understanding of the spatial dimension of the observed phenomena, their proved robustness and effectiveness preserve their utility in the evaluation of drought events. For the purpose of the presented study, and taking into consideration the large amount of available indices, the proposed discussion will be limited to a pre-selected set of indices (table 3), looking at both their comproved robustness and acceptance as well as their potential adequacy for the assessment of drought events in highly heterogeneous mountainous regions.
Type Index
Name Calculation Drought Classification Strength Weakness
Met e orol o gi c a l Palmer Drought Severity index (PDSI) Based on two-layer bucket-type water balance model, the PDSI measures the departure of moisture
from a normal condition
-4 to less: extreme drought -3 to -3.99: severe drought -2 to -2.99: moderate drought
-1 to 1.99: mild drought -0.5 to -0.99: initial dry spell
0.49 to -0.49: near normal Considers both water supply (precipitation) and demand (evapotranspiration)
Does not work well over mountainous and snow covered areas; may require re-normalization Standard Precipitatio n Index (SPI) Fitting and transforming a long-term precipitation record into a normal
distribution with respect to the SPI,
which has zero means and unit standard deviation
-2 or less: extreme drought -1.5 to -1.99: severe drought -1 to -1.49: moderate drought -0.5 to -0.99: mild drought 0.49 to -0.49: normal 0.5 to 1.99: mild wet 1 to 1.49: moderately wet 1.5 to 1.99: very wet 2 or more: extremely wet
Can be computed for different time scales; symmetric
for dry and wet periods; relates to probability Requires long term data; doesn’t consider evaporation Standard Precipitatio n and Evapotrans piration Index (SPEI) Fitting and transforming a long-term precipitation differences (precipitation – evapotranspiration) records into a normal distribution, following
the SPI basis
-2 or less: extreme drought -1.5 to -1.99: severe drought -1 to -1.49: moderate drought -0.5 to -0.99: mild drought 0.49 to -0.49: normal 0.5 to 1.99: mild wet 1 to 1.49: moderately wet 1.5 to 1.99: very wet 2 or more: extremely wet
Can be computed for different time scales; symmetric
for dry and wet periods; relates to
probability; considers water
demand (evapotranspiration)
Like SPI, long term data is required; not very effective over mountainous regions H y drol og ic a l Surface Water Supply index (SWSI) Calculated on river basin, based on precipitation, temperature , streamflow, snowpack and reservoir storage -4: Extreme drought -3: Severe drought -2: Moderate drought -1: mild drought +2: near normal +4: abundant supply Considers snowpack and water storage
Basin dependent equation formulation
22 Taking into consideration the proposed approach, only hydrological and meteorological methods will be evaluated in the present discussion. Not ignoring the existence of agricultural, hydrological and socio-economic drought indices as well as the implied downscaling approach for a full understanding of the spatial and temporal dynamics of drought events, the lack of available choices adapted to highly complex mountainous regions with consideration for the available data and for the proposed regional approach led to their exclusion from the presented research.
2.1.1. PDSI
From the set of available indices, the Palmer Drought Severity Index (PDSI), developed by Palmer in 1965, establishes itself as the most prominent, being generally accepted as a reliable choice for the representation of meteorological drought events. Defining the drought events as a consistent drop in moisture levels, at a given place, in relation to the expected (or appropriate) climatological moisture supply (Alley, 1984), the PDSI can be perceived as a hydrological balance index, taking into consideration precipitation, evapotranspiration as well as existent soil moisture conditions. The input variables allow for an accurate understanding of water availability changes.
Considering a two layer soil model and assuming that 25mm of water can be stored in the surface layer, the total available water capacity (AWC) is representative of the characteristics of the considered soil type. The model assumes that moisture can’t be taken from the deeper layers until all the available water from the upper layer disappears (Alley, 1984), phenomena dependent from the interaction and combination of meteorological variables (both temperature and precipitation), influencing the evaporation and evapotranspiration rates.
Taking into account the importance of meteorological variability, the computation of the PDSI starts with the implementation of a water balance equation on a monthly (or weekly) basis, focusing on long-term precipitation and temperature data series. Potential Evapotranspiration (PET) is computed (generally) through the application of the Thornthwaite equation (1948):