A country-level
genetic survey of
the IUCN critically
endangered western
chimpanzee (Pan
troglodytes verus)
in Guinea-Bissau
Filipa Franco da Silva Borges
Master’s Degree in Biodiversity, Genetics and Evolution
CIBIO-InBIO (Research Center in Biodiversity and Genetic Resources)/Department of Biology, University of Porto 2017
Supervisor
Maria Joana Ferreira da Silva, Postdoctoral Researcher, CIBIO-InBIO/CAPP/Cardiff University
Todas as correções determinadas pelo júri, e só essas, foram efetuadas. O Presidente do Júri,
Mílios
“What makes the desert beautiful, said the little prince,
is that somewhere it hides a well…” Antoine de Saint-Exupéry, in The Little Prince
Acknowledgements
I remember my father saying the stars always shined brighter in the little village where he was from. It was not until later that I have fully understood what he meant by that. Every day my heart has shined throughout this year. That certainly would not have been the case had I not been surrounded by so many people that contributed, in so many different ways, to make this project so meaningful and successful. I could not, thus, finish this journey without expressing my deepest and most sincere thank you to:
My supervisor, Joana Silva, for giving me the chance to be part of such an amazing project. For teaching me so much more than I could have hoped for. For always encouraging me to go further. And for pulling me off for air when I needed to breathe. For giving me enough space to fly on my own. And for always being ready to hold my hand and stop me from falling. For believing in me. For trusting me. For always valuing my thoughts and ideas. It has been a privilege to have that huge passion of yours shared with me. And it has been even a bigger privilege to walk this path by your side for a whole year.
Isa Pais, for having shared so much experience and wisdom with me. For always being available to discuss all my questions and concerns. For becoming a friend in such a short time. And, most of all, for inspiring me. That huge smile of yours could light up the whole world.
Professor Michael W. Bruford, Professor Catarina Casanova, and Professor Tânia Minhós, for being a key element of this project since its very beginning.
Susana Lopes, Diana Castro, Patrícia Ribeiro, Sofia Mourão, and everyone at CTM, CIBIO-InBIO, for all the support during the laboratory work.
Dr. Lounès Chikhi and all the Population and Conservation Genetics group, at Instituto Gulbenkian de Ciência, for making me feel so welcome and for all the advices and support. I will always cherish the time I have spent with you at IGC.
Professor Rui Sá, for having facilitated the genotypes and raw files for the broad scale analyses, without which we could not have done this work, and for all the logistical support during our stay in Bissau.
Dr. Mafalda Costa and Dr. Isa-Rita Russo, for having provided the laboratory supplies used for this study.
The Guinea-Bissau governmental agencies Direcção Geral de Florestas e Fauna and Instituto
da Biodiversidade e das Áreas Protegidas (IBAP), for samples exportation permits and
logistical support during fieldwork. We are very grateful for all the help provided by IBAP’s staff, in particular by Abel Vieira, Benjamim, Dr. Augusto Cá, Dr. Joãozinho Mané, Dr. Aissa Regala, Dr. Abilio Said, and Dr. Alfredo Simão da Silva. The NGOs CHIMBO and Acção para
o Desenvolvimento, for the logistical support during fieldwork. We are extremely grateful for all
help, (many) words of encouragement, tasty meals, and excellent example of problem solving by Dr. Helena Foito and Dr. Vitor Santos. The project is very grateful for the work of the field assistants Sadjo Camará and Mamadu Soares, and of the all the guards and guides of Cufada Lagoons Natural Park, namely Idrissa Camará, Umaru Galissa, Agostinho, Bakari, Mussa, Bafodê, Abu, Denba, and Mussa de Bubatchingue, and of all the guards and guides of Dulombi National Park. We would like to acknowledge the amazing work of the research assistants Mamadú Djaló and Nelson Fernandes, and the logistical support at Bissau provided by Isabella Espinosa, Helena Foito, Dr. Aissa Regala, Rui Sá, and J. Huet.
Instituto da Conservação da Natureza e das Florestas (ICNF), Portugal, for the samples
importation permits.
My mom and my dad. I wish I could fit the whole world in a sentence, because that is how much I want to thank you for. Instead, I choose to thank you for the most beautiful thing in it. I thank you for the love. You taught me the greatest lessons I have ever learned. I am forever thankful.
My brothers, Bruno and Ivo, for being my safe haven since the day I was born. You are extraordinary in everything you do. I could not have asked for a better example in life.
Cátia, Céline, Daniela, Gatões, Lara, Maria, Rita, Sophia, and Sté. It has been a privilege to grow up next to people I admire so much for all these years now. How lucky am I that I can count my best friends on both hands?
Each of the eighteen amazing scientists that started this master’s adventure with me two years ago. You made it all worth it.
All my family and friends, for being home to me every single day.
Field and laboratory work was supported by The Born Free Foundation, Chester Zoo Conservation and Research Grant, Primate Conservation Incorporated (Ref: PCI# 1400), and Portuguese Science and Technology Foundation (FCT), through the project: PRIMATOMICS (PTDC/IVC-ANT/3058/2014). MJFS worked under a FCT postdoctoral fellowship (SFRH/BPD/88496/2012), funded by Ministério da Educação e Ciência and European Social Funds through POPH – QREN – Tipologia 4.1 Formação Avançada. The field and laboratory work to collect and generate the genotypes by R. Sá was supported by the U.S. Fish and Wildlife Service Great Apes Conservation Fund (2010-2011, Ref. GA-0678).
This dissertation should be cited as: Borges, F. (2017) A country-level genetic survey
of the IUCN critically endangered western chimpanzee (Pan troglodytes verus) in Guinea-Bissau. MSc thesis, 159 pp. University of Porto, Portugal.
Abstract
Guinea-Bissau is considered one of the most important areas for the global conservation of the IUCN critically endangered western chimpanzee (Pan troglodytes
verus). Rapid deforestation, habitat fragmentation, and hunting for pet trade threaten
this subspecies in the country, which is further augmented by an atmosphere of political instability and a low level of human development. The lack of baseline information was hindering the development of a complete assessment of the viability and conservation status of P. t. verus.
The present study used 665 non-invasively collected faecal samples from five different geographic populations in Guinea-Bissau and a fragment of the mitochondrial DNA control region, a set of 21 autosomal microsatellite markers, and one Y-chromosome-associated microsatellite locus to assess genetic diversity and population structure, and to examine signatures of recent demographic history. A total of 185 unique genotypes and 165 mitochondrial DNA sequences were obtained and used in the analyses.
The results for all types of genetic markers suggested that gene flow between the chimpanzee population inhabiting Boé National Park and the coastal areas of Guinea-Bissau is limited. This result is in accordance to what had been found for the populations of baboons in the country. To assure this population does not go extinct, it is essential to recover the ecological corridors linking it to the southern part of Guinea-Bissau.
The patterns of population structure unravelled across the country were not strong, which suggests chimpanzees tend to disperse across almost all of their range. Contrary to what had been previously found for the majority of chimpanzee populations, males do not seem to be strictly philopatric in Guinea-Bissau. Evidences of population subdivision within Guinea-Bissau have been found based on the mitochondrial DNA marker, which is in agreement to the evolutionary history of the western chimpanzee clade.
A fine-scale analysis has been conducted to assess whether there is gene flow between the chimpanzee populations at Cufada Lagoons Natural Park and at Dulombi National Park. Dispersal between these populations seems to follow a pattern of isolation by distance, although the Corubal River, which is located between them, probably constitutes a relevant barrier to dispersal. This analysis showed a relatively
high degree of genetic variation within Cufada, which may occur due to the presence of immigrants in the population.
The results of this study suggest that human-related barriers to dispersal, such as roads and villages, may be negatively impacting chimpanzees’ dispersal across the country. The subtle degree of genetic structure found at a broad scale, along with the patterns unravelled at the fine-scale analysis, suggests that local-scale studies may be used as a powerful method to detect potential barriers to dispersal at an early stage, which may help plan management actions more efficiently.
The present research constituted the most complete genetic survey of chimpanzees in Guinea-Bissau to date and highlighted the need to enhance law enforcement and to work alongside local communities to improve chimpanzee conservation in the future.
Keywords: Western chimpanzee, Guinea-Bissau, Non-invasive sampling, Conservation genetics, Mitochondrial DNA, Microsatellites, Genetic diversity, Population structure, Demographic history, Gene flow.
Resumo
A Guiné-Bissau é considerada uma das áreas mais importantes, a nível global, para a conservação do chimpanzé-ocidental (Pan troglodytes verus), classificado como estando em perigo crítico de extinção pela IUCN. As principais ameaças a esta subespécie no país são desflorestação rápida, fragmentação de habitat e caça para tráfico como animal de estimação, o que é agravado por uma atmosfera de instabilidade política e um baixo nível de desenvolvimento humano. A falta de informação de base estava a impedir o desenvolvimento de uma avaliação completa da viabilidade e estado de conservação da subespécie.
O presente estudo utilizou 665 amostras fecais recolhidas de forma não-invasiva em cinco populações geográficas na Guiné-Bissau, assim como um fragmento da região controlo do ADN mitocondrial, um conjunto de 21 microssatélites autossómicos e um microssatélite associado ao cromossoma Y para avaliar a diversidade genética, estrutura populacional e história demográfica recente. Um total de 185 genótipos únicos e 165 sequências de ADN mitocondrial foram obtidos e utilizados nas análises. Os resultados de todos os tipos de marcadores genéticos sugeriram que o fluxo génico entre a população de chimpanzés do Parque Nacional de Boé e as áreas costeiras da Guiné-Bissau é limitado. Este resultado vai de encontro ao que havia sido proposto para as populações de babuínos do país. De forma a assegurar que esta população não é extinta, é essencial recuperar os corredores ecológicos que a ligam à zona mais a Sul da Guiné-Bissau.
Os padrões de estrutura populacional no país não se revelaram marcados, o que sugere que os chimpanzés tendem a dispersar ao longo de quase toda a sua área de distribuição. Ao contrário dos resultados publicados para a maioria das populações de chimpanzés, os machos parecem não ser estritamente filopátricos na Guiné-Bissau. Evidências de subdivisão da população da Guiné-Bissau foram encontradas com base no ADN mitocondrial, o que está de acordo com a história evolucionária do clade do chimpanzé-ocidental.
Foi realizada uma análise a uma escala menor para examinar se existiria ou não fluxo génico entre as populações de chimpanzés do Parque Natural das Lagoas de Cufada e do Parque Nacional de Dulombi. Dispersão entre estas populações parece seguir um padrão de isolamento por distância, apesar de ser provável que o Rio Corubal, que se localiza entre as duas, constitua uma relevante barreira à dispersão. Esta análise
revelou um nível elevado de variação genética na Cufada, o que poderá ocorrer devido à presença de imigrantes na população.
Os resultados deste estudo sugerem que as barreiras à dispersão relacionadas com a actividade humana, como estradas e aglomerados populacionais, poderão ter um impacto negativo sobre a dispersão dos chimpanzés no país. Para além do nível de estrutura genética subtil encontrado à escala nacional, os padrões revelados a uma escala menor sugerem que estudos a uma escala local poderão ser utilizados como um método robusto para detectar potenciais barreiras à dispersão numa fase inicial, o que poderá ajudar a planear medidas de gestão de forma mais eficiente.
A presente investigação constituiu o mais completo estudo genético de chimpanzés na Guiné-Bissau realizado até ao momento e enfatizou a necessidade de efectivar a aplicação da lei e de trabalhar em cooperação com as comunidades locais para melhorar a conservação do chimpanzé no futuro.
Palavras-chave: Chimpanzé-ocidental, Guiné-Bissau, Amostragem não-invasiva,
Genética da conservação, ADN mitocondrial, Microssatélites, Diversidade genética, Estrutura populacional, História demográfica, Fluxo génico.
Table of Contents
Acknowledgements ... vii
Abstract ... x
Resumo ... xii
Table of Contents ... xiv
List of Tables ... xvii
List of Figures ... xx
List of Abbreviations ... xxvi
1. Introduction ... 29
1.1. Biodiversity in West Africa and primates’ conservation ... 29
1.2. The common chimpanzee (Pan troglodytes) ... 29
1.3. The western chimpanzee (Pan troglodytes verus) in Guinea-Bissau ... 32
1.3.1. Cufada Lagoons Natural Park ... 34
1.3.2. Cantanhez Forest National Park ... 35
1.3.3. Complex Dulombi-Boé-Tchetche ... 36
1.4. Population and conservation genetics ... 37
1.5. Non-invasive sampling ... 37
1.6. Microsatellite markers ... 38
1.7. Mitochondrial DNA markers ... 40
1.8. Past genetic studies on chimpanzees ... 40
1.9. Relevance, research questions, and hypotheses ... 42
2. Materials and Methods ... 45
2.1. Study Area ... 45
2.2. Genetic Data ... 46
2.2.1. Genetic data generated by the present study ... 46
2.2.1.1. Sampling ... 46
2.2.1.2. DNA Extraction... 47
2.2.1.3. Genetic markers ... 48
2.2.1.3.1. Mitochondrial DNA ... 49
2.2.1.3.1.1. DNA barcoding ... 49
2.2.1.3.1.2. Mitochondrial DNA control region ... 50
2.2.1.3.2. Sex molecular determination ... 52
2.2.1.3.3. Microsatellite loci ... 52
2.2.1.4. Optimisation of the microsatellite loci multiplex PCR ... 52
2.2.1.5. Genotyping, quality control, and identification of repeated genotypes ... 55
2.2.1.5.1. Genotyping ... 55
2.2.1.5.2. Quality control procedures ... 56
2.2.1.5.3. Detection of repeated individuals ... 59
2.2.2. Genetic data produced by Sá (2013) ... 60
2.2.4. Merging the datasets of genotypes ... 61
2.2.4.1. Quality control procedures and identification of repeated genotypes ... 63
2.3. Genetic diversity, population structure, and demographic history at a broad geographic scale in Guinea-Bissau ... 64
2.3.1. Genetic diversity ... 64
2.3.2. Population structure ... 65
2.3.3. Demographic history ... 68
2.4. Genetic diversity and estimation of population structure at a geographic fine-scale in Guinea-Bissau... 70
3. Results ... 72
3.1. Genetic data generated by the present study ... 72
3.1.1. DNA Extraction ... 72
3.1.2. DNA Barcoding ... 72
3.1.3. Mitochondrial DNA control region ... 73
3.1.4. Microsatellite loci ... 73
3.1.4.1. Genotyping, quality control procedures, and identification of repeated genotypes 73 3.1.5. Molecular sex determination ... 77
3.2. Merging datasets ... 77
3.2.1. Mitochondrial DNA control region ... 77
3.2.2. Microsatellite loci ... 78
3.3. Genetic diversity, population structure, and demographic history at a broad geographic scale in Guinea-Bissau ... 82
3.3.1. Genetic diversity ... 82
3.3.2. Population structure ... 84
3.3.3. Demographic history ... 102
3.4. Genetic diversity and population structure at a geographic fine-scale in Guinea-Bissau .. 105
4. Discussion ... 112
4.1. Overview of main results, limitations, and further research ... 112
4.1.1. Laboratory procedures, genotypes quality, and sample selection ... 112
4.1.2. Genetic Diversity ... 114
4.1.3. Population structure ... 115
4.1.3.1. Patterns of gene flow, potential barriers to dispersal, and population isolation ... 115
4.1.3.2. Sex-specific dispersal patterns ... 119
4.1.3.3. Fine-scale analysis in CLNP and DNP... 121
4.1.4. Demographic history ... 122 4.1.5. Further research ... 123 4.2. Conservation considerations ... 124 5. Concluding Remarks ... 127 6. References ... 128 7. Supplementary Material ... 148
List of Tables
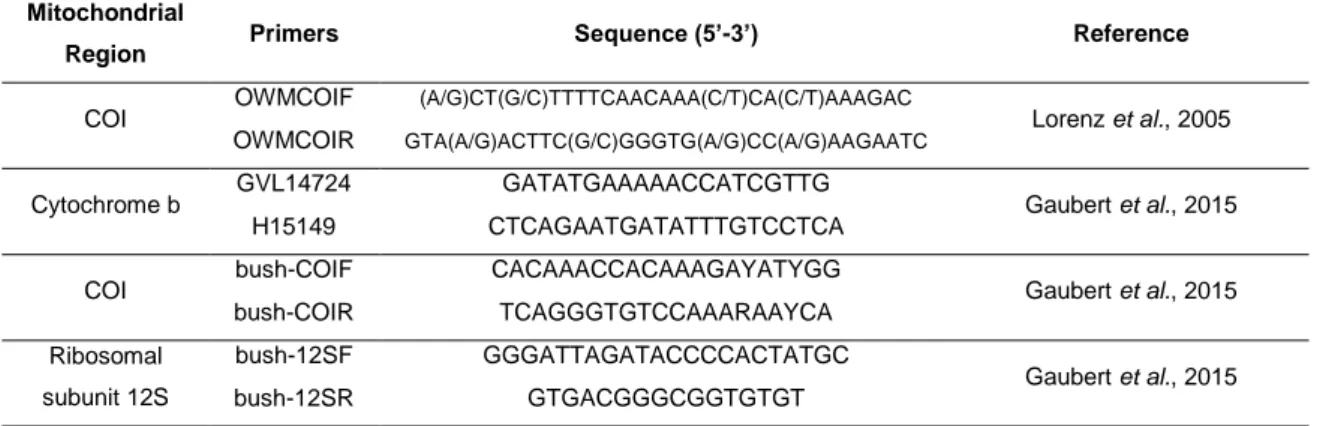
Table I. Details on the four primer pairs used for mitochondrial DNA barcoding of the samples
included in the study: mitochondrial region – cytochrome c oxidase subunit I (COI), cytochrome b, and ribosomal subunit 12S –, primers and respective sequences, and references. ... 50
Table II. Details on the primer pair amplifying a fragment of the mitochondrial DNA control region,
previously used by Sá (2013). ... 51
Table III. Description of the five Multiplex Polymerase Chain Reactions after the optimisation
process. Annealing temperature (AT), loci in each multiplex, primer sequences, repeat type/motif, fluorescent dye, and final PCR concentration (C). N.A. – not applicable. Repeat types identified with a “4” refer to tetranucleotide loci for which the repetition motifs have not been identified. Note that amelogenin was the molecular method used to determine the sex of the samples and is not a microsatellite locus (see section 2.2.1.3.2.). ... 54
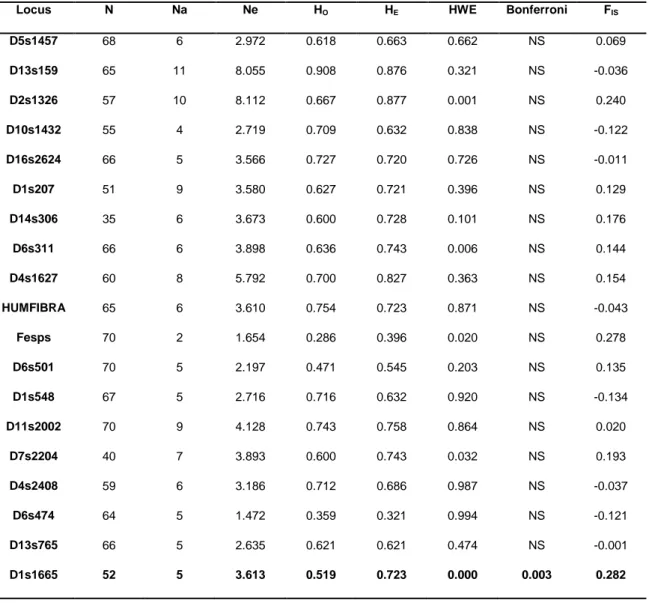
Table IV. Summary diversity statistics for the 21 autosomal microsatellite loci used: N (sample size);
Na (number of different alleles); Ne (effective number of alleles); HO (observed heterozygosity); HE
(expected heterozygosity); HWE (Hardy-Weinberg equilibrium); Bonferroni (significance adjusted by the Bonferroni correction for multiple comparisons); FIS (inbreeding coefficient). Loci in
non-conformity to HWE are in bold and significance accounts for the Bonferroni correction. ... 75
Table V. Summary diversity statistics for the 10 autosomal microsatellite loci used: N (sample size);
Na (number of different alleles); Ne (effective number of alleles); HO (observed heterozygosity); HE
(expected heterozygosity); HWE (Hardy-Weinberg equilibrium); Bonferroni (significance adjusted by the Bonferroni correction for multiple comparisons); FIS (inbreeding coefficient). Loci in
non-conformity to HWE are in bold and significance accounts for the Bonferroni’s correction for multiple comparisons. ... 79
Table VI. Genetic diversity statistics using the mtDNA sequences: N (number of sequences); nH
(number of haplotypes); Hd (haplotype diversity); S (number of polymorphic sites); (nucleotide diversity). Standard deviations are between brackets. ... 83
Table VII. Mean summary diversity statistics for the five geographic populations and the overall
dataset: N (sample size); Na (number of different alleles); Ne (effective number of alleles); HO
(observed heterozygosity); HE (expected heterozygosity); FIS (inbreeding coefficient). Standard errors
are between brackets. ... 83
Table VIII. Pairwise fixation index (FST) values. Significant values (p < 0.05) are marked with an
asterisk (*). N corresponds to the number of samples used per geographic population. Downer diagonal (left part of the table) corresponds to mtDNA and upper diagonal (right part of the table) corresponds to microsatellites data. ... 84
Table IX. AMOVA results. The p-value indicates the probability of finding a more extreme variance
Table X. Mean summary diversity statistics for the two clusters identified based on the STRUCTURE
analysis: N (sample size); Na (number of different alleles); Ne (effective number of alleles); HO
(observed heterozygosity); HE (expected heterozygosity); FIS (inbreeding coefficient). Standard errors
are between brackets. ... 91
Table XI. AMOVA results for the Y-linked microsatellite marker. The p-value indicates the probability
of finding a more extreme variance component and FST value than observed by chance alone after
10,000 permutations. ... 102
Table XII. Statistical indices calculated to analyse demographic history: Tajima’s D, Fu’s Fs. Fu and
Li’s D*, Fu and Li’s F*, and Ramos-Onsins and Rozas’ R2. N is the number of samples used per
sampling site. Significant values are indicated by one asterisk (*; p < 0.05) or two asterisks (**; p < 0.02). ... 102
Table XIII. Mean summary diversity statistics for the two geographic populations and the overall
dataset of samples included in the fine-scale analysis: N (sample size); Na (number of different alleles); Ne (effective number of alleles); HO (observed heterozygosity); HE (expected
heterozygosity); FIS (inbreeding coefficient). Standard errors are between brackets. ... 105
Table XIV. AMOVA results. The p-value indicates the probability of finding a more extreme variance
component and FST value than observed by chance alone after 10,000 permutations. ... 106
Table SI. Allelic Dropout and False Allele rates estimated in Pedant v. 1.0 using 50 samples
collected at CLNP and Consensus Threshold for four Polymerase Chain Reaction repetitions after the GEMINI v. 1.3.0 analyses. ... 150
Table SII. Details of the three Multiplex Polymerase Chain Reactions used by Sá (2013). Annealing
temperature (AT), loci in each multiplex, primer sequences, repeat motif, allele range size, fluorescent dye, and final PCR concentration (C). N.A. – not applicable. Sá (2013) does not specify the AT used for M3. Note that amelogenin was the molecular method used to determine the sex of the samples and is not a microsatellite locus. ... 151
Table SIII. Comparison of error rates (allelic dropout and false alleles) as estimated in Pedant v. 1.0
using two replicates per sample and per locus and as calculated using all the data following the approach by Broquet and Petit (2004). All values are presented in percentage. ... 152
Table SIV. Allele size range per locus for the samples of western chimpanzee amplified by the
present study. ... 153
Table SV. Comparison of allele frequencies between the dataset produced by the present study (FB
dataset) and the dataset produced by Rui Sá (RS dataset), using the samples from CLNP with a QI > 0.5. N corresponds to the number of samples from each dataset used for the comparison. ... 153
List of Figures
Figure 1. Geographic range and distribution of the four subspecies of common chimpanzee (Pan
troglodytes) – western chimpanzee (P. t. verus), Nigeria-Cameron chimpanzee (P. t. ellioti), central
chimpanzee (P. t. troglodytes), and eastern chimpanzee (P. t. schweinfurthii). Sources: IUCN SSC A.P.E.S. database, Drexel University, and Jane Goodall Institute (2016). Produced using QGIS v. 2.18.0. ... 31
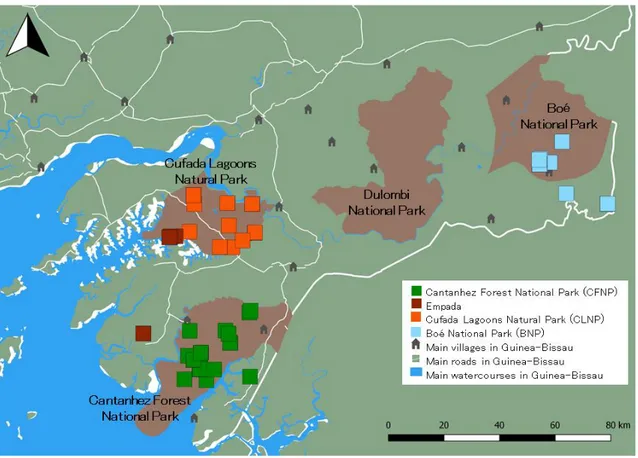
Figure 2. Four main protected areas in mainland Guinea-Bissau, where chimpanzees are mostly
found, and subspecies distribution according to the 2016 IUCN assessment. Sources: IBAP; INEP; IUCN SSC A.P.E.S. database, Drexel University, and Jane Goodall Institute (2016). Produced using QGIS v. 2.18.0. ... 34
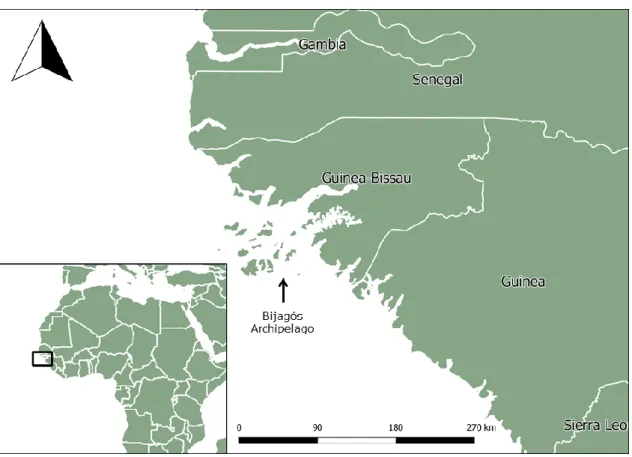
Figure 3. Location of the Republic of Guinea-Bissau in West Africa. The Bijagós archipelago is
highlighted by an arrow. Produced using QGIS v. 2.18.0. ... 45
Figure 4. Study area and sampling sites, which include the four protected areas marked in brown
and Empada. Sources: IBAP, INEP, C. Sousa. Produced using QGIS v. 2.18.0. ... 46
Figure 5. Average DNA concentration and standard deviation (shown by the back bars) obtained
using 21 samples extracted with the two different extraction protocols – Costa et al. (in revision) and Vallet et al. (2008, adapted by Quéméré et al. 2010) – tested by this study. ... 72
Figure 6. Location of the 70 unique genotypes included in the final FB dataset. Produced using
QGIS v. 2.18.0. ... 74
Figure 7. Cumulative probability of identity (PI) and probability of identity between siblings (PIsibs).
Distinction of individuals is reliable with five loci, when the PIsibs curve approaches zero. ... 76
Figure 8. Genotype accumulation curve showing a plateau at five loci, the minimum number of loci
necessary to distinguish between different individuals. ... 77
Figure 9. Location of the 168 samples collected from unique individuals for which the mitochondrial
DNA control region was amplified and used in the analyses. Produced using QGIS v. 2.18.0. ... 78
Figure 10. Location of the samples collected from the 185 unique individuals genotyped for a
maximum of 10 microsatellite loci included in the final combined dataset. Produced using QGIS v. 2.18.0. ... 81
Figure 11. Location of the 96 samples collected from the males successfully genotyped for the
DYs439 locus. Produced using QGIS v. 2.18.0. ... 82
Figure 12. Median-joining haplotype network reconstruction using mtDNA. Node size is proportional
to haplotype frequency and each number on the links corresponds to a mutation. The four haplogroups are circled by the dashed black lines. ... 85
Figure 13. Median-joining haplotype network reconstruction using the mtDNA dataset divided per
geographic population. Node size is proportional to haplotype frequency and each number on the links corresponds to a mutation. A) Cantanhez Forest National Park (CFNP). B) Empada. C) Cufada Lagoons Natural Park (CLNP). D) Boé National Park (BNP). ... 86
Figure 14. Principal component analysis (PCA) based on mtDNA. The first and second axes
explained 41.0% and 18.9%, respectively, of the observed variation. Each point represents an individual and colours distinguish between sampling sites (Green: CFNP; Brown: Empada; Orange: CLNP; Purple: DNP; Blue: BNP). Inertia ellipses include two thirds of the individuals from each sampling site. ... 87
Figure 15. Spatial principal component analysis (sPCA) constructed using the mtDNA sequences. A)
Plot of the eigenvalues across the principal components. The first global structure was maintained. B) First global principal component on the geographic space represented in a scale from red (maximum score) to black (minimum score). Each point represents an individual and its colour indicates the score. ... 88
Figure 16. Mantel test performed to test the hypothesis of isolation by distance using the mtDNA
data. The black dot standing outside the simulated range under a model of random distribution of haplotypes across the landscape agrees with the hypothesis of isolation by distance (p < 0.05). ... 89
Figure 17. Individual Bayesian clustering analysis performed in STRUCTURE using microsatellite
data (185 unique genotypes). A) Inference of the most likely number of clusters (K) using K and LnP(K) values across all runs. B) Bar plot output assuming K = 2. C) Bar plot output assuming K = 6. ... 90
Figure 18. Map representation of the output of the individual Bayesian clustering analysis
implemented in STRUCTURE. The five geographic populations harbour individuals assigned to two clusters identified using STRUCTURE and a proportion of admixed individuals. NCFNP = 78; NEmpada =
12; NCLNP = 67; NDNP = 11; NBNP = 17. Circles are proportional to sample size in each locality. Main
water courses are represented in blue, roads in white, and villages in grey. Produced using QGIS v. 2.18.0. ... 92
Figure 19. Individual Bayesian clustering analysis performed in STRUCTURE for the 43 unique
genotypes grouped in cluster 2. A) Inference of the most likely number of clusters (K) using K and LnP(K) values across all runs. B) Bar plot output assuming K = 4. ... 93
Figure 20. Output of the individual Bayesian clustering analysis performed in BAPS, assuming K = 3.
The genotypes are represented on the geographic space. ... 94
Figure 21. Principal component analysis (PCA) based on the microsatellite data. The x-axis and the
y-axis explain 3.1% and 3.0%, respectively, of the observed variation. Each point represents an individual and colours distinguish between sampling sites (Green: CFNP; Brown: Empada; Orange: CLNP; Purple: DNP; Blue: BNP). Inertia ellipses include two thirds of the individuals from each sampling site. ... 95
Figure 22. Spatial principal component analysis (sPCA) constructed using the microsatellite
database. A) Plot of the eigenvalues across the principal components. The first two global structures were maintained. B) The first principal component is represented in a scale from red (maximum score) to black (minimum score) and the second principal component in a scale from green (maximum score) to black (minimum score). Each point represents an individual and its colour indicates the combination of the two scores... 96
Figure 23. Mantel test performed to test the hypothesis of isolation by distance using the
microsatellite data. Each point represents an individual, the x-axis represents the geographic distance between each pair of individuals in km, and the y-axis represents the linear genetic distance. No significant correlation between Euclidean geographical and genetic distances was obtained (p > 0.05). ... 97
Figure 24. Graphical representation of the Mantel test performed to analyse the hypothesis of
isolation by distance for each pair of geographic populations. Each point represents an individual. The x-axis represents the geographic distance between each pair of individuals in km and the y-axis represents the linear genetic distance. Significant correlation between Euclidean geographical and genetic distances was obtained for the pairs CFNP/CLNP, CFNP/DNP, CFNP/BNP, and DNP/BNP (p < 0.05). ... 98
Figure 25. Spatial autocorrelation analysis (N = 185) – correlogram of the correlation coefficient (r)
between genetic and geographic distance at 18 distance classes (km, end point) with an even number of samples (c. 1,000 pairwise comparisons per distance class). U and L are upper and lower limits of the 95% confidence band under the null hypothesis of random distribution of genotypes across the landscape. Error bars represent 95% confidence intervals around each mean correlation coefficient. Distance classes with significant pairwise genetic distances are the ones standing outside the dashed lines. ... 99
Figure 26. Spatial autocorrelation analyses performed for every pair of geographic populations. The
y-axis represents the correlation coefficient (r) between genetic and geographic distance at the distance classes (km, end point), with an even number of samples, represented in the x-axis. U and L are upper and lower limits of the 95% confidence band under the null hypothesis of random distribution of genotypes across the landscape. Error bars represent 95% confidence intervals around each mean correlation coefficient. Distance classes with significant pairwise genetic distances are the ones standing outside the dashed lines. ... 100
Figure 27. Allele frequencies for the Y-linked microsatellite marker across Guinea-Bissau. Circle size
is proportional to the number of genotypes obtained from each site (40 in CFNP, 14 in Empada, 29 in CLNP, and 13 in BNP). Main water courses are represented in blue, roads in white, and villages in grey. Produced using QGIS v. 2.18.0. ... 101
Figure 28. Mismatch distribution based on the mitochondrial DNA control region. The back line
represents the observed distribution and the grey lines represent expected distributions under models of constant population size and of population growth. The data did not significantly deviate from a model of population growth, based on the raggedness index (r; p > 0.05). ... 103
Figure 29. Mismatch distributions for the geographic populations under study. A) CFNP; B) Empada;
C) CLNP; D) BNP. The raggedness index (r) value was non-significant (p > 0.05) in all cases, suggesting a history of population growth. ... 104
Figure 30. L-shaped allele-frequency distributions (mode-shift indicators), which are typical of stable
populations, obtained from the BOTTLENECK analysis. A) Whole dataset of 185 unique genotypes. B) Cluster 1 identified in the STRUCTURE analysis (45 genotypes). C) Cluster 2 identified in the STRUCTURE analysis (43 genotypes). ... 105
Figure 31. Individual Bayesian clustering analysis performed in STRUCTURE (70 unique
genotypes). A) Inference of the most likely number of clusters (K) using K and LnP(K) values across all runs. B) Bar plot output assuming K = 2. C) Bar plot output assuming K = 3. ... 107
Figure 32. Map representation of the first partitioning of genotypes into two clusters using an
individual Bayesian clustering analysis implemented in STRUCTURE. The individuals from CLNP are divided into clusters 1 (22 individuals) and 2 (36 individuals). The 12 individuals from DNP were assigned to cluster 1. Circles are proportional to sample size in each locality. Main water courses are represented in blue, roads in white, and villages in grey. Produced using QGIS v. 2.18.0. ... 108
Figure 33. Principal component analysis (PCA) performed using the 70 unique genotypes included in
the fine-scale analysis. The x-axis and the y-axis explain 6.3% and 6.0%, respectively, of the observed variation. Each point represents an individual and colours distinguish between sampling sites (Pink: CLNP; Orange: DNP). Inertia ellipses include two thirds of the individuals from each sampling site. ... 109
Figure 34. Spatial principal component analysis (sPCA) performed based on the 70 unique
genotypes included in the fine-scale analysis. A) Plot of the eigenvalues across the principal components. The first three global components were maintained. B) First three global principal components on the geographic space. The first principal component is represented in a scale from red (maximum score) to black (minimum score), the second principal component in a scale from green (maximum score) to black (minimum score), and the third principal component is represented in a scale from blue (maximum score) to black (minimum score). Each point represents an individual and its colour indicates the combination of the three scores. ... 110
Figure 35. Spatial autocorrelation analysis – correlogram of the correlation coefficient (r) between genetic and geographic distance at 10 distance classes (km, end point) with an even distribution of samples. U and L are upper and lower limits of the 95% confidence band under the null hypothesis of random distribution of genotypes across the landscape. Error bars represent 95% confidence intervals around each mean correlation coefficient. Distance classes with significant pairwise genetic distances are the ones standing outside the dashed lines. ... 111
Figure 36. Graphical representation of the Mantel test performed to analyse the hypothesis of
isolation by distance, using the dataset of 70 genotypes included in the fine-scale analysis. Significant correlation between Euclidean geographical and genetic distances was obtained (p < 0.05). ... 111
Figure S1. Authorization, by the Director General of the General Directorate for Food and Veterinary,
for the import of tissue, blood, and faecal samples of primate species from Guinea-Bissau to Portugal. ... 148
Figure S2. Authorization, by the Convention on International Trade in Endangered Species of Wild
Fauna and Flora (CITES)/Instituto da Conservação da Natureza e das Florestas (ICNF), for the transport of tissue and blood samples of chimpanzee from Guinea-Bissau to Portugal. ... 149
Figure S3. Comparison of two Bayesian clustering analyses to assess the effect of missing data
Guinea-Bissau. A) 21 loci, with missing data for RS samples across 11 loci. B) 10 loci; the clusters seem to be better defined, which is especially evident for the one represented in yellow. ... 155
Figure S4. Comparison of two Factorial Component Analyses for the same 201 samples from five
different geographic populations in Guinea-Bissau, in order to assess the effect of missing data. A) 21 loci; the cluster on the right includes samples from RS dataset, with missing data only for 11 loci, and the cluster on the left comprises samples from FB dataset, with a low amount of missing data; the horizontal and vertical axes explain, respectively, 7.69% and 2.85% of the observed variation. B) 10 loci; the horizontal and vertical axes explain, respectively, 3.82% and 3.50% of the observed variation. ... 156
Figure S5. Cumulative probability of identity (PI) and probability of identity between siblings (PIsibs)
for the 10 loci included in the combined dataset of genotypes. Distinction of different individuals is reliable with a minimum of five loci, when the PIsibs curve approaches zero. ... 157
Figure S6. Genotype accumulation curve for the 10 loci included in the combined dataset showing a
plateau at five loci, the minimum number necessary to distinguish between different individuals. ... 157
Figure S7. Individual Bayesian clustering analysis performed in STRUCTURE for the 45 unique
genotypes grouped in cluster 1. No evidence of substructure appears. A) Inference of the most likely number of clusters (K) using K and LnP(K) values across all runs. B) Bar plot output assuming K = 2. C) Bar plot output assuming K = 4. D) Bar plot output assuming K = 7. ... 158
Figure S8. Output of the individual Bayesian clustering analysis performed in BAPS for the fine-scale
analysis among CLNP and DNP, assuming K = 1. The genotypes (N = 70) are represented on the geographic space. ... 159
List of Abbreviations
ADO – Allelic dropoutAMOVA – Hierarchical analysis of molecular significance BNP – Boé National Park
bp – Base pair
CFNP – Cantanhez Forest National Park CLNP – Cufada Lagoons Natural Park cyt b – Cytochrome b
DNP – Dulombi National Park FA – False allele
FCA – Factorial correspondence analysis FIS – Inbreeding coefficient
FST – Fixation index
GPS – Global positioning system Hd – Haplotype diversity
HE – Expected heterozygosity
HO – Observed heterozygosity
HWE – Hardy-Weinberg equilibrium
IUCN – International Union for Conservation of Nature K – Optimal number of genetic clusters
LD – Linkage disequilibrium
MCMC – Markorv chain Monte Carlo mtDNA – Mitochondrial DNA
Na – Number of different alleles Ne – Effective number of alleles
NUMT – Nuclear mitochondrial DNA segment PCA – Principal component analysis
PCR – Polymerase Chain Reaction PI – Probability of identity
PIsibs – Probability of identity between siblings
Q – Probability of assignment QI – Quality index
S – Number of variable positions
sPCA – Spatial principal component analysis UV – Ultra-violet
1. Introduction
1.1. Biodiversity in West Africa and primates’ conservation
The West African forests are considered one of world’s hotspots of biodiversity, where a large number of endemic species are threatened by habitat loss (Myers et al., 2000). Scientists are expressing an increasing concern about the level of population size declines and losses of species in this area (Brooks et al., 2002). Since the beginning of the twentieth century, above 50% of the mammals’ populations have become extinct in what is sometimes referred to as the ongoing sixth mass extinction (Ceballos, Ehrlich and Dirzo, 2017). Therefore, conservation priorities must be directed towards this region (Myers et al., 2000).Primates, in particular, are currently facing an extinction crisis that threatens 37% of extant species in mainland Africa alone (Estrada et al., 2017). Indeed, the first document reporting a primate species going extinct in the twenty-first century has been published in the year 2000, referring to Miss Waldron’s red colobus monkey, which is endemic to the forests of West Africa (Oates et al., 2000). This conservation crisis can be assigned mainly to environmentally unsustainable human activities (Estrada et al., 2017), which are markedly influenced by disrupted social and political contexts typical of African biodiversity rich areas (Hanson et al., 2009). Indeed, countries harbouring West African forests were marked by a recent history of civil wars (Dudley et al., 2002). The consequences of such political and economic instability for wildlife have emerged through a rise in logging, poaching, and bushmeat consumption, namely of primate species (Draulans and Van Krunkelsven, 2002; Dudley et al., 2002).
1.2. The common chimpanzee (Pan troglodytes)
The common or robust chimpanzee (Pan troglodytes) is a non-human primate included in the Hominidae family (Groves, 2001; Mittermeier, Rylands and Wilson, 2013). Chimpanzees live in fission-fusion communities, in which individuals form parties that change continually (Morin et al., 1993). The species has a long generation time (approximately 25 years; Langergraber et al., 2012). Males are usually philopatric and females may emigrate as adolescents or migrate temporally as adults to other groups in order to reproduce (Morin et al., 1993). Although being the most widely distributed of all African’ apes (Butynski, 2003), the species has a current decreasing population trend and is classified as Endangered by the International Union for Conservation of
Nature (IUCN) Red List of Threatened Species (Humle, Maisels, et al., 2016). It is expected that the population reduction will continue over the next 30 to 40 years (Humle, Maisels, et al., 2016). The main threats to the species conservation are poaching, habitat loss and fragmentation, and diseases (Humle, Maisels, et al., 2016). The extinction of chimpanzees may represent a great impact, not only on their ecosystem, but also on the understanding of subjects such as human evolution and cognition, considering some traits characteristic of this taxon, such as 1) the capacity for long-distance seed dispersal, which has very important evolutionary consequences for plant species (Chapman and Russo, 2002) and for other taxa; 2) the complex social interactions that individuals exhibit and that include cooperation, reconciliation, and coalition formation (Humle, 2003); 3) the skills for social cognition (Tomonaga et al., 2004); 4) the high memory capacity (Kawai and Matsuzawa, 2000) and culture (McGrew, 1998); and 5) the fact that it is, along with bonobos, the closest living relative of humans (Prüfer et al., 2012), which renders it a model of reference for human evolution (Sayers and Lovejoy, 2008), health, and physiology (e.g. Thompson et al., 2007). Additionally, chimpanzees can act as an umbrella, flagship, and bio-indicator species, and are, thus, particularly important for biodiversity and nature conservation at a broader scale (Wrangham et al., 2008; Hockings and Sousa, 2013).
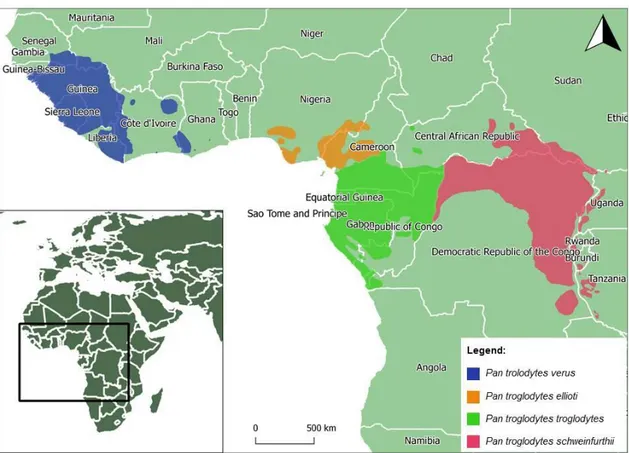
The chimpanzee is native to 21 African countries (Figure 1) and four subspecies are usually considered: the western chimpanzee (P. t. verus), the Nigeria-Cameron chimpanzee (P. t. ellioti), the central chimpanzee (P. t. troglodytes), and the eastern chimpanzee (P. t. schweinfurthii) (Groves, 2001; Mittermeier, Rylands and Wilson, 2013; Humle, Maisels, et al., 2016).
Figure 1. Geographic range and distribution of the four subspecies of common chimpanzee (Pan troglodytes) – western chimpanzee (P. t. verus), Nigeria-Cameron chimpanzee (P. t. ellioti), central chimpanzee (P. t. troglodytes), and eastern chimpanzee (P. t. schweinfurthii). Sources: IUCN SSC A.P.E.S. database, Drexel University, and Jane Goodall Institute (2016). Produced using QGIS v. 2.18.0.
From an evolutionary point of view, the Western African chimpanzee clade seems to present an earlier divergence and isolation from the lineage that gave rise to the other subspecies, which are more closely related (Morin et al., 1994; Becquet et al., 2007; Prado-Martinez et al., 2013). Although there is little evidence of gene flow between the four subspecies (Becquet et al., 2007), evidences from mitochondrial DNA (mtDNA) sequences indicate an historical pattern of gene flow between populations of western chimpanzees separated by up to 900 km (Morin et al., 1994).
A review of past studies on wild chimpanzees, namely on their population genetic structure and movement patterns, can be found in section 1.4.
1.3. The western chimpanzee (Pan troglodytes verus) in
Guinea-Bissau
The western chimpanzee, due to its long-term evolutionary separation from the other subspecies, has been indicated as meriting elevation to full species rank (Morin et al., 1994). In fact, of the four subspecies of common chimpanzee, it is the only one whose IUCN conservation status has risen to Critically Endangered in the latest assessment, in 2016 (Humle, Boesch, et al., 2016), and, as such, efforts must be especially allocated to ensure its long-term survival and conservation (Kormos and Boesch, 2003).
With a population estimate of 15,000 to 65,000 individuals, the western chimpanzee suffered a decline of over 80% in abundance between 1990 and 2014 (Kühl et al., 2017). Although there are many described threats affecting this taxon, the major determinant of its patchy distribution and decrease in population size seems to be human-related deforestation and hunting (Kormos and Boesch, 2003; Carvalho, Marques and Vicente, 2013), which is linked to the already mentioned political instability in the countries where the subspecies occurs (Draulans and Van Krunkelsven, 2002; Dudley et al., 2002).
The western chimpanzees are native to Côte d’Ivoire, Ghana, Guinea, Guinea-Bissau, Liberia, Mali, Senegal, and Sierra Leone (Humle, Boesch, et al., 2016). Among these eight countries, the populations in Ghana, Senegal, and Guinea-Bissau are the most threatened ones (Butynski, 2003). The population in Guinea-Bissau is considered a priority for the conservation of the subspecies (Kormos and Boesch, 2003), as the estimated number of individuals in the country lies between 600 and 1,000 (Gippoliti, Embalo and Sousa, 2003), which is below the number expected to guarantee the long-term survival of the population (i.e. 5,000; Lande, 1995).
Guinea-Bissau is one of the world’s poorest countries (CCLME Project, 2016), has a low level of human development (UNDP, 2016), and has been listed by the Organisation for Economic Co-operation and Development since 2007 as an unstable state with a fragile economy (OECD, 2015). In that sense, it has been argued that biological conservation should be combined with economic growth in the country (Gippoliti, Embalo and Sousa, 2003). However, the civil war triggered in 1988 created hundreds to thousands of displaced people, which, coupled with high population growth and a poor economic situation, has brought biodiversity conservation to a second place (Gippoliti, Embalo and Sousa, 2003). Although the chimpanzee is classified as
Critically Endangered by IUCN (Humle, Boesch, et al., 2016), is included in Appendix I by the Convention on International Trade in Endangered Species of Wild Fauna and Flora (CITES, 2017a), to which Guinea-Bissau joined as a party in 1990 (CITES, 2017b), and is protected by Guinea-Bissau national laws (e.g. Lei de Bases do Ambiente; Imprensa Nacional, 2011), many hazardous actions threaten the long-term conservation of the subspecies within the country. These include habitat loss by illegal deforestation (Carvalho, 2014), hunting for trade of skins and body parts for traditional medicine (Sá et al., 2012), and pet trade (Ferreira da Silva, 2012; Hockings and Sousa, 2013).
In Guinea-Bissau, P. t. verus is mostly distributed south of the Corubal River in the regions of Quinara, Tombali, and Gabú (Gippoliti and Dell’Omo, 1996). Although the northern limit for the distribution of the species in Guinea-Bissau is not clear, it has been hypothesised to extend above the Corubal River (Brugiere et al., 2009). While confirmation with actual data from those areas was lacking until recently (Sousa, 2014), the latest assessment by IUCN already included the presence of chimpanzees in Dulombi National Park (DNP), which is located north of the Corubal River (Humle, Maisels, et al., 2016; Figure 2). Moreover, the observation of individuals and nests, and the collection of faecal samples at DNP (Ferreira da Silva, 2016b) definitely confirms the presence of a chimpanzee population in that site.
The largest communities of P. t. verus are found in the protected areas of Cufada Lagoons Natural Park (CLNP; region of Quinara), Cantanhez Forest National Park (CFNP; Tombali region) and the complex Dulombi-Boé-Tchetche (Gabú and Boé sectors) (Carvalho, 2014; Figure 2). Each of the protected areas is briefly described in the following sections.
Figure 2. Four main protected areas in mainland Guinea-Bissau, where chimpanzees are mostly found, and subspecies distribution according to the 2016 IUCN assessment. Sources: IBAP; INEP; IUCN SSC A.P.E.S. database, Drexel University, and Jane Goodall Institute (2016). Produced using QGIS v. 2.18.0.
1.3.1. Cufada Lagoons Natural Park
CLNP was included in the national system of protected areas in the year 2000 and covers 890 km2 (IBAP, 2017). The park was named after a lagoon, which has been classified as a Ramsar site (Ramsar, 2017). There are 3,534 people inhabiting the park, mostly concentrated along the road between Buba and Fulacunda, and in the northern part of the park near the Corubal River (IBAP, 2017). Because the park is inhabited by local communities, the liaison of biodiversity and primates’ conservation with local practices and traditions must be prioritised (Carvalho, Marques and Vicente, 2013; Amador, 2014; Amador, Casanova and Lee, 2015).
A great variety of animal species inhabit the park (IBAP, 2017), including the non-human primates chimpanzees, lesser white-nosed guenons (Cercopithecus petaurista), Guinea baboons (Papio papio), and patas monkeys (Erytrocebus patas) (Gippoliti and Dell’Omo, 2003).
The CLNP chimpanzee population is of major importance to the conservation of P. t.
chimpanzees at the westernmost margin of its geographic distribution (Carvalho, 2014). Secondly, it is thought to be the smallest population in Guinea-Bissau. The most recent estimate of 0.22 chimpanzees/km2, corresponding to 137 individuals (Carvalho, 2014), contrasts with estimations made for the Tombali sector – 2.340 individuals/km2 (CFNP; Sousa, 2007) and 0.897 individuals/km2 (Gadamael, outside CFNP; Sousa, 2009). Furthermore, it has been described that chimpanzees nesting behaviour in CLNP is limited by the presence of major human settlements (Carvalho, 2014). The fact that more than half of the primary forest of CLNP has been cleared for the construction of a road and a deep water port in 2009 by Bauxite Angola S.A. to enable the exportation of bauxite from the country (Salgado, Fedi and Leitão, 2009) highlights the urgency to improve chimpanzee conservation in this area (Sousa et al., 2013; Carvalho, 2014).
1.3.2. Cantanhez Forest National Park
Created in the year 2008 and officially regulated by a decree in 2011 (Decreto 14/2011), CFNP covers an area of 1,068 km2 and is inhabited by approximately 20,000 people (IBAP, 2017). CFNP is considered the last patch of sub-humid forest in Guinea-Bissau, harbouring the greatest diversity of flora and fauna (IBAP, 2017). Seven species of non-human primates are native to CFNP: chimpanzee, Guinea baboon (Papio papio), Campbell’s monkey (Cercopithecus campbelli), black-and-white colobus (Colobus polykomos), Senegal bushbaby (Galago senegalensis), Temmink’s red colobus (Procolobus badius temmincki), and vervet monkey (Chlorocebus aethiops) (Gippoliti and Dell’Omo, 2003). National governmental agencies managing protected areas have delimitated two wildlife corridors from CFNP to Guinea-Conakry (i.e.
Gandambel and Bendugo) and three wildlife corridors connecting CFNP to other
protected areas within the country – CLNP and DNP (IBAP, 2017). Despite the official protection status conveyed to these forests, some difficulties in enforcing regulations have been reported and formal protection has been described as minimal (Hockings and Sousa, 2013). Roads and paths associated to human activities have been fragmenting the forests (Hockings and Sousa, 2013), which is thought to negatively affect the connectivity between groups of chimpanzees (Torres et al., 2010). Torres et
al. (2010) estimated that 11% of the area of suitable habitats for the species has been
cleared between 1986 and 2003, which corresponds mainly to a decrease of primary forest and of landscape spatial heterogeneity (Sousa, 2009; Torres et al., 2010). The impact of deforestation upon the chimpanzees’ populations in the Tombali region is
confirmed by the lower density of individuals found outside the declared protected perimeter of CFNP, where secondary forests prevail (Sousa, 2009), in comparison to figures for the forested areas inside the park (Sousa, 2007). Additionally, human-chimpanzee conflicts that arise mainly due to overlap of forest use and to resource competition, which often leads to crop-raiding by chimpanzees, frequently lead to negative perceptions, lack of willingness to engage in conservation efforts (Costa et al., 2013), and retaliatory killings by farmers (e.g. Hockings and Sousa, 2013). The chimpanzees’ population size in CFNP could be under 400 individuals, considering a low density scenario (Torres et al., 2010).
1.3.3. Complex Dulombi-Boé-Tchetche
The complex Dulombi-Boé-Tchetche extends over an area of 3,190 km2, which includes two national parks (Boé and Dulombi) and three ecological corridors (Tchetche, Salifo, and Cuntabani) (IBAP, 2017), being there present the ten non-human primate species which are known to occur in Guinea-Bissau (chimpanzee, black-and-white colobus, Campbell’s monkey, Guinea baboon, lesser white-nosed guenon, patas monkey, Senegal bushbaby, sooty mangabey, Temmink’s red colobus, and vervet monkey; Gippoliti and Dell’Omo, 2003). According to the Institute of Biodiversity and Protected Areas of Guinea-Bissau (IBAP, 2017), the aim of the complex is to assure connectivity between national protected areas, as well as between Guinea-Bissau’s protected areas and parks in bordering countries. Boé’s biodiversity seems to be mainly affected by fires, hunting, human population growth, and construction of roads (CHIMBO, 2017). Furthermore, the already mentioned company Bauxite Angola S.A. intends to extract bauxite in this area (Wit, 2011) and to construct a road for transportation of the mineral (van der Hoeven, 2011). This has been shown to pose a negative impact on the chimpanzees living in proximity to that area (Wenceslau, 2014). Estimations of chimpanzees’ population size in Boé vary between 710 individuals (Serra, Silva and Lopes, 2007) and up to 4,415 individuals (Binczic et al., 2017), which are the highest figures for the whole of Guinea-Bissau. DNP is an understudied area, but is considered an important site for conservation and, at the same time, a location very affected by threats such as non-sustainable hunting (Casanova and Sousa, 2007).
1.4. Population and conservation genetics
Biodiversity should be conserved at three levels: genetic diversity, species diversity, and ecosystem diversity (Frankham, 1995). The importance of preserving genetic diversity has led to the formalization of conservation genetics as a research field (Primmer, 2009). The birth of conservation genetics was catalysed by the advances in molecular biology technologies that occurred in the past decades, namely the use of highly polymorphic markers, such as microsatellites and mtDNA, amplified by
Polymerase Chain Reaction (PCR) associated to the non-invasive DNA sampling of
wild populations (Primmer, 2009; Ferreira da Silva and Bruford, 2017). Conservation genetics makes use of the principles of the discipline of population genetics to help decrease the extinction risk and preserve the species’ potential to adapt to future environmental changes (Ferreira da Silva and Bruford, 2017).
Parameters such as genetic variation, gene flow, effective population size, and population structure can be evaluated through several techniques using the tools of population genetics (Allendorf, 2017). Threats such as habitat fragmentation can lead to a reduction in dispersal and consequently may increase reproductive isolation which, in turn, can increase the risk of extinction (Frankham, 1995). As a consequence of isolation, individuals may start to reproduce with kin, leading to compromised fertility, growth, and survival, as well as to increased susceptibility to diseases (Frankham, Briscoe and Ballou, 2002; Ferreira da Silva et al., 2012; Ferreira da Silva and Bruford, 2017). Therefore, information on the genetic diversity and inbreeding levels of populations is of major importance for the conservation genetics of the western chimpanzee considering the high habitat fragmentation found along its range (Humle, 2003).
Primate genetic surveys make use of non-invasive sources of DNA and PCR-based genetic markers, of which microsatellite loci and mtDNA are the most extensively used (Ferreira da Silva and Bruford, 2017).
1.5. Non-invasive sampling
Non-invasive genetic surveys enabled conservationists to estimate parameters such as population effective size, levels of genetic variation, and structure of wild populations with minimum human interference (Schwartz, Luikart and Waples, 2006). This is of especial importance when studying wild primates because the collection of samples such as blood and tissue may negatively affect the individuals, is limited by practical
constraints, and rises ethical questions (Ferreira da Silva and Bruford, 2017). After the first genetic survey of free-ranging primates using non-invasively collected samples was published in 1993 on chimpanzees (Morin et al., 1993), a huge step within the field of primate conservation genetics was achieved. Nowadays, faeces are by far the most common source of DNA for genetic studies involving primate species, as they can be found relatively easily in the field (Ferreira da Silva and Bruford, 2017).
Sex identification of individuals using non-invasively collected DNA has been used in conservation genetic studies to improve census methods, determine the sex composition of social groups and populations, and incorporate sex data into macro-analyses (Bradley, Chambers and Vigilant, 2001; Koops et al., 2007). The amelogenin system (Sullivan et al., 1993) is one of the effective ways to distinguish between males and females for the majority of the great ape species (Roeder, Jeffery and Bruford, 2006). Amelogenin is a XY-homologous locus with a 6 base pair (bp) deletion within intron one of the X homologue, which results in 6 bp longer fragments for the Y chromosome when compared to the X chromosome (Sullivan et al., 1993). Therefore, DNA from males amplifies two fragment sizes, separated by 6 bp, while DNA from females amplifies only one fragment size, which allows identifying the sex of unobserved individuals by gel electrophoresis or sequencing reactions (Sullivan et al., 1993).
1.6. Microsatellite markers
Microsatellites (also known as Simple Sequence Repeats – SSRs) are short DNA fragments in which a motif containing one to five base pairs is monotonously repeated (Schlötterer, 2000). The high polymorphism levels encountered among different individuals arise due to the variable number of repeats of the motif being considered (Bruford and Wayne, 1993). The large number of repeat motifs in microsatellites is a consequence of DNA replication slippage and of the mismatch repair system (Schlötterer, 2000). Although the great majority of mutations in microsatellites are neutral, in some cases these markers play functional roles in organisms (Tautz and Schlötterer, 1994; Duran et al., 2009). In fact, they are thought to be involved in gene expression and transcription (Duran et al., 2009).
Due to the presence of microsatellites across the whole genome in eukaryotes (Tautz and Schlötterer, 1994), their highly polymorphic nature and relatively simple amplification and genotyping, including from non-invasive sources of DNA, these
markers have become the molecular tool of choice in studies of population genetics, social structure, mating success, and population movement (Schlötterer, 2000; Sunnucks, 2000), including of primate species (Coote and Bruford, 1996). In fact, microsatellite markers have been successfully employed in several studies of chimpanzee populations. For example, Goossens et al. (2000, 2003) used ten microsatellite loci for paternity analyses in wild-released orphan chimpanzees in the Conkouati-Douli National Park, Republic of Congo, and Vigilant et al. (2001) used nine loci to analyse the social structure of three chimpanzee communities inhabiting Taï National Park, Côte d’Ivoire. It is very common for these studies to make use of microsatellite loci that have been firstly described in humans, since they cross-amplify in samples from chimpanzees and other primate species (Coote and Bruford, 1996). Despite all the above mentioned advantages of this type of genetic marker, genotyping errors associated to the use of microsatellite loci exist and need to be considered. Genotyping errors occur when the genotype determined after molecular analysis does not correspond to the real genotype (Bonin et al., 2004). They are very commonly associated to the use of non-invasive DNA (Pompanon et al., 2005) and can be generated at all stages of a genetic study, namely DNA amplification, scoring, and data analysis, due to a variety of causes, including chance, human error, and technical artefacts (Bonin et al., 2004). Allelic dropouts (ADO) and false alleles (FA) constitute the two main sources of microsatellite genotyping errors and are among the hardest ones to monitor (Broquet and Petit, 2004). ADO is defined as the stochastic non-amplification of one of the two alleles present at an heterozygous locus and FA are allele-like artefacts generated by PCR that can be confounded and scored as actual alleles (Pompanon et al., 2005). Although a complete suppression of genotyping errors is impossible to achieve (Bonin et al., 2004), it is possible to quantify them (e.g. Broquet and Petit, 2004) and to control and minimise their effect (e.g. Taberlet et al., 1996). Taberlet et al. (1996), for instance, purposed a two-step procedure to obtain reliable genotypes with a confidence level of 99%: PCRs must be conducted until three positive amplifications are obtained and each allele should be recorded if observed at least twice; for samples from homozygous individuals, four additional positive amplifications must be obtained and individuals should only be considered homozygous if the same allele is present across the seven repetitions.
A commonly employed method to evaluate the reliability of the genotypes obtained from non-invasive sources of DNA and to make comparisons among samples, loci, and studies is the quality index (QI) proposed by Miquel et al. (2006). In this system, scores
between zero and one are assigned to the consensus genotypes depending on their level of concordance to the replicates.
1.7. Mitochondrial DNA markers
mtDNA is a duplex, covalently closed circular molecule (Moritz and Dowling, 1987) that possesses 37 highly conserved genes and a control region in animal species (Avise et
al., 1987). In vertebrates, this control region contains a displacement loop structure
(D-loop) that has a function in the replication process (Moritz and Dowling, 1987). mtDNA is a useful marker in population and evolutionary studies: unlike nuclear DNA, pure mtDNA can be easily obtained from samples containing low amounts and/or degraded DNA (Harrison, 1989), such as those collected non-invasively; it lacks recombination, which allows access to clear genealogies and ancestry data; and it presents a high evolutionary rate when compared to nuclear DNA (Avise et al., 1987). The control region is the most commonly used fragment of mtDNA in intraspecific primate studies, due to the fact that it is the most variable portion of the molecule (Morin and Goldberg, 2004).
The utility of mtDNA as a genetic marker is limited by the fact that it is exclusively maternally inherited and does not reveal patterns associated to the paternal line. However, it has been commonly used to assess primate population structure at the intraspecific or intra-generic level and to determine units for conservation (Ferreira da Silva and Bruford, 2017).
mtDNA markers are also commonly used for DNA barcoding. DNA barcoding is the use of a sequence from a standard part of the genome of the individual under investigation (e.g. cytochrome oxidase subunit I, cytochrome b), which is compared against a library of reference barcode sequences from individuals of known origins and species to achieve the species identification of the sample (Hajibabaei et al., 2007). These sequences can be used for identification only or can also be used to analyse diversity and be part of larger population genetic studies, if enough genetic variation is present (Hajibabaei et al., 2007).
1.8. Past genetic studies on chimpanzees
Genetic studies on chimpanzees are common and diverse, and include assessments of intraspecific diversity (e.g. Gonder et al., 1997; Becquet et al., 2007; Oates, Groves