Marine Policy 123 (2021) 104285
Available online 6 November 2020
0308-597X/© 2020 The Authors. Published by Elsevier Ltd. This is an open access article under the CC BY-NC-ND license (http://creativecommons.org/licenses/by-nc-nd/4.0/).
Full length article
Assessing the land- and seascape determinants of recreational diving:
Evidence for Portugal’s south coast
Mariana Cardoso-Andrade
a,b,*, Frederico Cruz-Jesus
c, Francisco Castro Rego
d,
Mafalda Rangel
b, Henrique Queiroga
aaDepartamento de Biologia and CESAM − Centro de Estudos do Ambiente e do Mar, Universidade de Aveiro, Campus Universit´ario de Santiago, Aveiro 3810-193, Portugal
bCCMAR - Centro de Ciˆencias do Mar do Algarve, Universidade do Algarve, Campus de Gambelas, Faro 8005-139, Portugal cNOVA Information Management School (NOVA IMS), Universidade Nova de Lisboa, Campus de Campolide, Lisboa 1070-312, Portugal
dCentro de Ecologia Aplicada “Professor Baeta Neves” (CEABN), InBIO, Instituto Superior de Agronomia, Universidade de Lisboa, Tapada da Ajuda, Lisboa 1349-017, Portugal
A R T I C L E I N F O Keywords:
SCUBA diving
Marine coastal management Marine spatial planning Marine conservation Coastal zone
A B S T R A C T
Scuba diving is one of the most popular coastal recreational activities, and one of the few that are allowed in multiple-use marine protected areas. Nevertheless, like many other coastal activities, if in excess, it may harm coastal ecosystems and their sustainable use. This paper focuses on the seascape and landscape characteristics that are most associated with the existence of dive sites, aiming to identify other suitable locations along the coast to potentially reduce environmental pressure (e.g., overcrowding and physical damage) on the existing dive sites. Logistic regressions were employed to model the suitability for dive sites existence in the Portuguese south coast (Algarve), one of the most popular Summer destinations in mainland Europe. Results suggest that closeness to waterlines and piers and the presence of rock structures in the coastal strip are the most important attributes that positively influence dive sites’ existence, whereas the beach environment and the presence of muddy sed-iments are negatively associated with it. In this study, we suggest the application of a logistic model to find alternatives for the explored dive sites as a quick and easily applied coastal management tool. Moreover, we find it useful for the implementation of coastal conservation strategies extended to other coastal activities.
1. Introduction
The integration of human values into ecosystem conservation stra-tegies is widely debated [1,2]. Coastal recreational activities are believed to be manageable within nature conservation plans and, thus, substantial efforts are being made to study the impacts and benefits of their incorporation in protected areas’ management plans [3–5]. Self- Contained Underwater Breathing Apparatus (SCUBA) diving combines its economic value as a coastal recreational activity with the promotion of environmental awareness as an observation activity [6,7], and it is commonly accepted in multiple-use marine protected areas (MPAs) as a source of revenue [4,8]. The scientific community agrees that biodi-versity protection is one of the primary objectives of terrestrial and marine conservation plans [9,10]. Diving hotspots and conservation hotspots [9], although with different meanings, seem to share similar
biological target values. In fact, recreational SCUBA divers value high fish abundance, the encounter of rare species, the size of the fish, high biodiversity, coral richness, and interesting geomorphological features [11–14]. This coincidence, however, may be as much beneficial as harmful [15]. SCUBA diving can negatively impact underwater ecosys-tems if not conducted in a proper manner [16–19]. Dive sites’ integrity relies on the effective management of recreational diving, one that takes advantage of the natural, cultural, and esthetic values of the seascape without jeopardizing their preservation and protection [20]. Recreation and leisure, intertwined with esthetic, cultural heritage, and identity values, are cultural ecosystem services that are explored by this recre-ational coastal activity [21,22]. As one of the increasing uses of MPAs, active research to minimize the damages caused by recreational diving is especially relevant [17,20]. For instance, Rangel et al. designed SCUBA diving [5] and snorkeling [23,24] routes in the Algarve for controlled * Corresponding author at: Departamento de Biologia and CESAM − Centro de Estudos do Ambiente e do Mar, Universidade de Aveiro, Campus Universit´ario de Santiago, Aveiro 3810-193, Portugal.
E-mail address: mariana.andrade@ua.pt (M. Cardoso-Andrade).
Contents lists available at ScienceDirect
Marine Policy
journal homepage: http://www.elsevier.com/locate/marpol
https://doi.org/10.1016/j.marpol.2020.104285
dive access to iconic dive locations, and Flores-de la Hoya et al. [25] assessed dive sites for their recreational quality and required skill level, to support a sustainable practice of SCUBA diving and snorkeling activities.
The present study aims to provide a marine spatial planning (MSP) tool for efficiently managing the pressure of recreational SCUBA diving on the ecosystems. We identify the landscape and seascape target fea-tures for recreational attractiveness in the scope of SCUBA diving in the south coast of Portugal (Algarve), using a logistic model to describe the potential of any underwater site within the study area, to become a dive site. Logistic regression models have been used combined with geographic information systems techniques to predict the occurrence of multiple spatial phenomena in Ecology studies [26]. Studies seem to apply this technique for management purposes, both for terrestrial (e.g., wildfire risk management [27], wildlife landscape recolonization [28]) and marine/freshwater ecosystems (e.g., natural resources conservation and management through the prediction of target species’ distribution [29,30]).
This tool allows marine planners to explore the full potential of a determined seascape to receive SCUBA diving and, subsequently, to find new alternatives for current dive sites within and outside MPAs. More-over, this approach could avoid concentrations that cause environ-mental losses, helping to recover overexploited, damaged, or vulnerable sites. By offering alternative SCUBA diving locations in less concerning areas, but with similar environmental and logistical conditions, policy-makers would protect the environment while promoting quality diving tourism in the region.
To the best of the authors’ knowledge, this is the first time that this methodology is applied with the purpose of predicting the probability of occurrence of dive sites to manage this coastal recreational activity’s footprint on the seascape. We believe that this methodology could inspire other studies in the scope of coastal and marine spatial planning. The objectives of the present paper are 1) to determine the set of variables with the best discriminating power for influencing the exis-tence of recreational dive sites, and 2) develop a model that defines the probability/suitability of each seascape unit for recreational diving, in order to develop a tool useful for regulating this activity. This paper is organized as follows: Section 2 describes the study area (2.1), data sources and groups of variables (2.2), and how they were analyzed (2.3); Section 3 reveals the results of the analyses and identifies the set of the most important variables influencing the existence of dive sites; sub- Section 3.1 shows and interprets the spatial representation of the resulting model scores; Section 4 presents the discussion of findings; and Section 5 the conclusions remarking the potential of this spatial man-agement tool for coastal and marine spatial planning.
2. Materials and methods
2.1. Area characterization
The Algarve is the southernmost mainland Portuguese region, embraced by the Atlantic Ocean to the west and south, and bounded to the east by the Guadiana river, bordering Spain. This region owns several awards as one of the most popular European beach destinations [31] and, in 2017, represented a 33% share of the total number of hotel overnight stays in Portugal, and an average stay of 4.61 nights, the second largest in the country after Madeira island [32]. These figures are consistent with the trend of recent years and indicative of its remarkable touristic reputation. The marine context area corresponds to the area between the line of maximum high tide, and the 30 m bathymetric line, which is the maximum limit recommended for the practice of recrea-tional SCUBA diving [33] and coincides with the offshore limit of the marine protection zone according to the Coastal Zone Management Plan developed for the Portuguese coast (POOC) [34]. A terrestrial context area equivalent to the coastal parishes was considered as well, in order to assure the continuity of coastal ecosystems’ representation in the analysis and to include land infrastructures (e.g., piers/marinas and municipalities’ headquarters representing urban centers) that might influence dive site location. Three diving zones were described along this coast, for our purposes henceforth defined as: western, central, and eastern, which are characterized by different proportions and physiog-raphy of bottom types and dive-interesting features [35]. In the western zone, the extent of the large rock outcrops creates complex environ-ments that harbor a large number of species. Over 50% of the western zone’s dive sites are characterized by their rock formations (walls and caves), being under the protection of the Natural Park of Sudoeste Alentejano and Costa Vicentina (PNSACV). In the central zone, the occurrence of rock formations is less common, with elongated shaped rocks, distant from the coastline, as local biodiversity hotspots. The eastern zone, dominated by soft sediments, includes the saltmarsh of Ria Formosa, within the boundaries of the Natural Park of Ria Formosa (PNRF), where dive access is restricted.
2.2. Data sources and variables
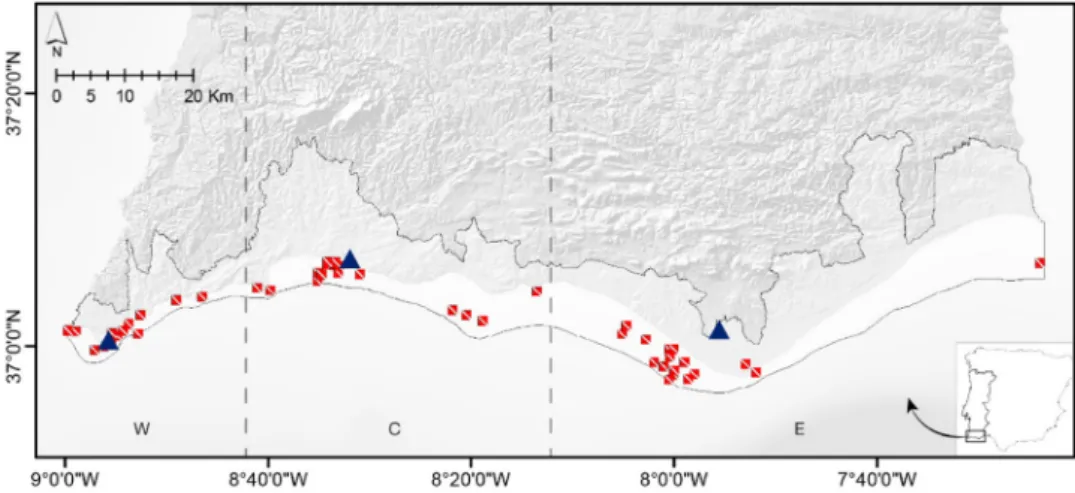
Dive sites locations were supplied by three dive centers, located in Sagres (western zone), Portim˜ao (central zone), and Faro (eastern zone), totalizing 48 dive sites across the study area (Fig. 1) [35]. Seascape and landscape data were used to develop a series of metrics to describe and model the presence or absence of recreational SCUBA diving practice (note the geographical data sources in the Appendix, Table A.1). Fig. 1. The study area and terrestrial context area (white shade polygon), divided by the western (W), central (C), and eastern (E) dive zones (dashed lines), the existing dive sites (dive flags), and the cooperating dive centers (triangles). The hillshade effect was produced using Copernicus data and information funded by the European Union - EU-DEM layers.
Seascape data were compiled from the seabed map ‘Chart of Surface Sediments of the Portuguese Continental Shelf’ (sheet “Sed 7-8”), which sets the "Sedimentological Series," published by the Hydrographic Institute (IH). As for the terrestrial data, land use/cover map COS 2007 was used, as published by the Directorate-General for Spatial Planning (DGT). All the spatial analyses were processed using the ESRI software ArcMap™ (ArcGIS® 10). The reference system adopted was ‘ETRS89- PT-TM06’.
To draw a comparative analysis between different seascape units, the study area was subdivided using a grid of squares, created using the ET GeoWizards extension in ArcMap™ (ArcGIS® 10). Each cell has a lateral dimension of 500 m and a total area of 250,000 m2, corresponding to a total of 3193 cells fitted in the study area. This size was set considering the extent of the study area and corresponding base map scale, as well as the diver’s potential mobility, which was estimated as 350 m and cor-responds to the length of the most extensive diving route in the area [23]. Additionally, considering that dives do not generally represent static situations (except for the more conspicuous wreck diving), the eight neighboring cells were added to every dive site core cell (the Moore neighborhood) [36]. Note that the mobility range considered (350 m) drawn from the centroid of the core cell will intersect all the eight neighboring cells. For simplification, each set of the dive site core cell plus the eight adjacent cells will be henceforth referred to as the dive site. Of the original 48 dive sites indicated by the dive centers, two pairs of two dive sites were merged because of the overlap between the respective core cells, resulting in a total of 46 dive sites (342 cells) considered in the analysis.
For the assessment of the drivers of recreational diving, a preliminary set of 22 potentially explanatory variables were selected based on pre-vious studies on this subject, and conceptually characterized in four dimensions: biodiversity proxies (e.g., [5,12–14]), activity logistics (e. g., [13,14,37]), marine context (e.g., [12,14,38]), and terrestrial context (e.g., [5,37]). The complete list of variables and definitions can be seen in Table 1. Not all the variables have a spatial expression; therefore, we used the landscape and seascape metrics that could possibly quantify their presence (e.g., underwater visibility related to the existence of light sediments). All variables were computed for each cell within the study
area. It should be noted that our set of variables does not cover every possible determinant of recreational diving. However, we do believe that considering the natural limitations in data availability, it accounts for the main dimensions impacting the existence of recreational dive sites.
Biodiversity proxies represent conditions generally recognized for attracting marine life. Rocky environments support a wide diversity of macroalgae, invertebrate and fish species due to the complexity and degree of shelter provided by the geological structures (e.g., caves, pinnacles, and walls) [39,40] and by the biogenic complexity caused by habitat-engineering species (e.g., canopy-forming algae, mussel beds, soft corals) [41]. In the estuarine context, waterlines, seagrass beds, and a mosaic of mixed and muddy sediments are excellent for nesting and sheltering juveniles and adults of fishes and invertebrates [42]. Biodi-versity proxies measure the proportional area of rock outcrops (emerged and submerged) and wetlands in each seascape cell, as well as the dis-tance of each cell to the nearest rock outcrop and waterline.
Activity logistics variables describe accessibility for divers: the longer the transport duration, the higher the costs and the divers discomfort [25]; the further away the populated areas, the less reachable the support infrastructures (e.g., health facilities) are, and the less easy is the access to other central urban areas in the country [37]. The activity logistics variables measure the nearest distance of each seascape cell to two possible dive trip starting points, the beach (diving from the shore) and the pier/marina (diving from a boat), as well as the nearest distance to municipalities’ headquarters, in order to describe their proximity to central urbanized areas (and, thus, existing infrastructures).
Context variables, marine and terrestrial, represent conditions that are not directly related to recreational SCUBA diving features of interest, but that could nevertheless determine the possibility of a good diving experience (e.g., underwater visibility, technical difficulty, the natu-ralness of the landscape, water pollution). Marine context variables represent the influence of the seascape sediment classes described by type as “gravel,” “sand,” “mud,” and “muddy sand,” and by particle size as “coarse,” “medium” and “fine.” The influence of the bathymetric in-tervals defined by the contours of 0 m, 10 m, 20 m, and 30 m was also tested in this group. Terrestrial context variables represent the influence Table 1
Description of the experimental variables and correspondent conceptual dimensions tested for the recreational diving predictive model.
Dimension Name Measurement Description
Scuba diving Dive site Binary Designates existence or absence of SCUBA diving practice in each seascape unit. It is coded as “1” if the cell has a dive site, or if any of its eight neighboring cells do; or “0” if not.
Biodiversity
proxies Rock landscape Wetland landscape Ratio Ratio Proportion of landscape with rock outcrops. Proportion of landscape with wetlands. Rock seascape Ratio Proportion of seascape with rock outcrops. Rock nearest distance Distance Euclidean nearest distance (m) to rock features. Waterline nearest distance Distance Euclidean nearest distance (m) to waterlines. Activity logistics Pier nearest distance Distance Euclidean nearest distance (m) to piers or marinas.
Beach nearest distance Distance Euclidean nearest distance (m) to beaches, dunes, and sandy areas. City nearest distance Distance Euclidean nearest distance (m) to the municipality’s headquarters. Marine Context Gravel seascape Ratio Proportion of seascape with gravel sediments.
Coarse sand seascape Ratio Proportion of seascape with coarse sand sediments. Medium sand seascape Ratio Proportion of seascape with medium sand sediments. Fine sand seascape Ratio Proportion of seascape with fine sand sediments. Muddy sand seascape Ratio Proportion of seascape with muddy sand sediments. Mud seascape Ratio Proportion of seascape with mud sediments.
<10 m depth Binary Presence/absence of the bathymetric interval [0–10 m].
10–20 m depth Binary Presence/absence of the bathymetric interval [10–20 m].
>20 m depth Binary Presence/absence of the bathymetric interval [20–30 m].
Terrestrial
Context Artificial landscape Agricultural landscape Ratio Ratio Proportion of landscape occupied by artificial territories. Proportion of landscape occupied by agricultural and agroforestry systems. Beach landscape Ratio Proportion of landscape occupied by beaches, dunes, and sandy areas.
Naturalized landscape Ratio Proportion of landscape occupied by forests and natural and semi-natural ecosystems. Coastline nearest distance Distance Euclidean nearest distance (m) to the coastline.
Simplified coastline
of different land occupations along the coast, classified as “artificial territories,” “agricultural and agroforestry systems,” “beaches, dunes, and sandy areas,” and “forests and natural and semi-natural ecosys-tems,” and measure the nearest distance between the seascape cells and two versions of the coastline, the original and a simplified version excluding islets.
We computed proportions and presence/absence values by inter-secting the land and sea cover and the depth interval layers (vector models) with the grid generated by ET GeoWizards extension in Arc-Map™ (ArcGIS® 10). Each grid cell has an ID, which was associated to the matching area measurement of cover/depth values. Afterward, these values were transformed into percent covers or converted to the binary scale using Microsoft Excel®. For the Euclidean distances, the centroids of the grid cells were extracted by converting the polygons into points (“Feature to Point,” Data Management tools, ArcGIS® 10), and the distance was automatically calculated using the “Near” tool (Analysis Tools, ArcGIS® 10), which computes the closest distance through the angle defined by the distance line between the centroid and the nearest point of the desired object.
2.3. Modeling
Logistic regression (LR) is a well-known predictive method that may be described as estimating the relationship between a single binary (dependent) variable and a group of metric or nonmetric (independent) variables [43]. The LR model is defined as follows:
logit(pi) = ln(pi/(1 − pi)) =βΛ 0 +βΛ 1 .X1+β Λ 2 .X2+β Λ 3 .X3+ ... +β Λ i .Xi+ξ Where pi is the probability of occurrence of a SCUBA diving site in the ith
case (coded as “1” if the area unit has a dive site, “0” if not), X1 to Xn are
the independent variables, ßΛ
0 to ß Λ
i are the coefficients of the logistic
regression to be estimated which act as a weighting factor for the explanatory variables associated to their discriminatory power and ξ is the error term.
The impact that each independent variable has on the dependent one is essentially assessed in terms of direction and magnitude [43]. Thus, LR coefficients are interpreted in the same way as coefficients in a linear regression are [44]. If a coefficient is positive/negative, then the like-lihood of an observation belonging to the target class of the dependent variable increases as the respective independent variable also increases or decreases; the higher the absolute coefficient is, the stronger the relationship between the independent and the dependent variable is. The statistical significance of each coefficient, i.e., the evidence there is that it differs from zero, was also evaluated by the p-values. P-values below the typical values of 0.05 or 0.10 are considered significant, meaning that the coefficient is statistically different from 0.
We used logistic regressions in order to 1) identify which are (and to what extent) the landscape and seascape characteristics that most in-fluence SCUBA diving sites’ presence, and 2) classify all the Portuguese south coast in regard to the suitability for possible diving sites’ presence, with the objective of relieving pressure in existing places. Since the dependent variable is binary, i.e., if the dive site exists or not, LR are suitable to test which landscape and seascape characteristics are more prone to influence the practice of SCUBA diving [44]. We estimated four separate models, three using exclusively 1) landscape; 2) seascape percent cover variables; and 3) nearest neighbor distance variables (depth interval presence/absence variables were not included in these preliminary analyses); and the fourth model with all the variables together. The four logistic models were estimated using SAS® Enterprise Guide. For the preliminary results of each model, please see Tables A.2–A.4 in the Appendix. In the last model, due to the high number of explanatory variables available, we followed the stepwise method for selecting only the most important. This method combines
forward and backward selection techniques, meaning that independent variables that initially included in the model do not necessarily end up there. We used a significance level of 0.05.
Moreover, as the proportion of cells with and without a dive site was unbalanced (46 dive sites, 342 out of 3.193 cells), we used under- sampling, i.e., we took a random sample of cells which had Dive site = 0, to achieve around 50/50 ratio between dive and non-dive sites. Note that we do not have a way to know the real proportion between cells with or without dive sites accurately, as the dive sites used are most probably a known sample from a larger universe. The statistical signif-icance of the independent variables was assessed at a 5% signifsignif-icance value. All the usual tests to assess the model robustness and suitability were performed [45].
3. Results
The first three models addressed the independent variables sepa-rately pertaining to one of the three groups: land cover, seabed sedi-ment, and nearest neighbor distance to relevant features (Tables A.2, A.3, and A.4, respectively). The fourth model used a stepwise approach to include every significant variable. Beta coefficients were standardized for the best interpretation of the effect magnitudes between independent variables, making them directly comparable with each other. The first preliminary model (Table A.2) indicated the following SCUBA diving significant drivers: naturalized landscape (ßΛ3= 2.96 ; p < 0.01), rock landscape (ßΛ
6 = 17.59; p < 0.05) and wetland landscape (ß Λ
5 = 1.62;
p < 0.05) with positive relationships, and beach landscape (ßΛ
4 = −
8.38; p < 0.001) negatively related; the latter being the most important. This analysis confirms the importance that the terrestrial context can have on the dive sites’ distribution. For instance, rock and wetland landscape variables are associated with high species diversity. On the other hand, the negative relation between beach landscape and dive site variables could be explained by the low depth associated to beaches, the disturbance caused by wave action, and the tidal effect. These factors contribute to the loss of visibility due to the suspension of sediment and disturb the diver’s stability.
The second model (Table A.3) determined all variables except me-dium sand seascape as statistically significant. The only variable with a positive association was rock seascape (ßΛ
1 = 4.26; p < 0.01), which is
one of the most important in the set, with the remaining negatively associated, among them muddy sand seascape (ßΛ
5 = − 2.95; p < 0.001)
and mud seascape (ßΛ
7 = − 2.25; p < 0.001) as the model’s most
important variables. The presence of rock in the underwater environ-ment is not only an opportunity for biodiversity hotspots occurrence, but it also designs complex seascapes, which can increase the esthetic in-terest of the dive site (e.g., caves, pinnacles, walls). Mud and muddy sand seascape substrates are mostly present in the two largest estuaries in Algarve, the mouths of the Arade and the Guadiana Rivers, being mostly absent in other depths lower than 20 m and more common at greater depths around 30 m. As muddy sediments are thinner when in the presence of more severe hydrodynamics, their suspension in the water column will last longer.
The third logistic regression (Table A.4) indicated as statistically significant and positively related the variables waterline (ßΛ
5 = −
0.0003; < 0.001), rock (ßΛ
2 = − 0.0001; p < 0.05) and pier (ß Λ 3 = −
0.0001; p < 0.05) nearest distances and, with a negative relationship, the variable city nearest distance (ßΛ
nearest distance is the most relevant in the model. Note that the reading of these variables is different. As they represent distances, a negative ßΛ means higher proximity. At the confluence of inner waters with the sea, the waterlines create marshland environments that are used for feeding, breeding, and refuge by many species, as so the rock features. Distance to piers determines travel cost and time, influencing divers’ willingness to dive. Among the three preliminary models, the latter (assessing nearest neighbor distances) had the best discriminating power, measured by the area under the curve (AUC) of the receiver operating characteristic (ROC) curve (AUC-ROC curve = 0.75).
The results of the final model can be found in Table 2 (reliability tests in Tables A.5 and A.6). The biodiversity proxy waterline nearest distance was evidenced as the most important. Although the SAS® stepwise method employed avoids multicollinearity issues, we computed the Variance Inflation Factors (VIF). The highest VIF is 1.66, well below the suggested threshold of 10, indicating no multicollinearity amongst the independent variables [46]. A strong relationship was verified between the dependent variable and the independent variables considered
(χ2 = 196.72, p < 0.001) (Table A.5). Concordant, discordant and tied pairs were also measured in our data: a pair of observations with different observed responses is said to be concordant if the observation with the lower ordered response value (Dive site = “0”) has a lower predicted mean score than the observation with the higher ordered response value (Dive site = “1”). In our model, this happens in 78.9% of the pairs (Table A.6). Accordingly, this model revealed a good discriminating power (AUC-ROC curve = 0.79, Fig. A.1), and the Hos-mer–Lemeshow test did not find a significant departure of the model from the data, showing the suitability of the model (χ2 = 12.476, p = 0.131; Tables A.7 and A.8).
3.1. Spatial representation of the final model
The next step in our analysis is to provide a spatial representation of the results of the logistic regressions. Thus, we exported the dataset with the predicted dependent variable (scores) from SAS® Enterprise Guide to ArcGIS® 10 and matched the score of each cell in the original grid. The likelihood of discovering a dive site was assigned based on a quin-tile’s distribution of the model’s scores, aggregated in three classes: “Probably not,” “Possibly,” and “Probably yes” (Fig. 2).
In general, the model shows a heterogeneous distribution along the Algarve’s south coast, with higher probability in the western zone and, almost gradually, a decreasing probability towards the eastern zone, as the occurrence of rock features is also more occasional in the seascape. The map illustrates high suitability for recreational diving in the prox-imity of piers and waterlines, in the presence of known rock features, and marginally in wetlands. A negative influence is represented in as-sociation with the most exposed beaches, which are less probable to have a dive site than sheltered beaches that usually have rock features. Moreover, shallow depths (< 10 m) and muddy seabed sediments (light sediments worsen visual clarity) are both clearly represented as limiting factors for the diving experience.
Fig. 2. Spatial representation of the model. Suitability for discovering a dive site: “Probably Not” (red), “Possibly” (yellow), “Probably yes” (green). The figure shows the correspondence of existing dive sites with the class of highest probability of dive site existence “Probably yes.” The hillshade effect was produced using Copernicus data and information funded by the European Union - EU-DEM layers (land), and West Iberian Bathymetry Model data (sea) [47]. (For interpretation of the references to color in this figure legend, the reader is referred to the web version of this article.)
Table 3
Classification of the known dive sites cells according to the probability assigned by the model. The quintiles one and two and three and four showed no noticeable differences between them and were therefore aggregated in the same suitability class.
Quintiles Model Number of cells Number of Dive site = 1 cells (total of) Probability of Dive site = 1 (%) Lift
(prob. cell/total)
Quintile 1 “Probably Not” 639 14 (4.1%) 2.2 0.21
Quintile 2 “Probably Not” 639 15 (4.4%) 2.3 0.22
Quintile 3 “Possibly” 639 75 (21.9%) 11.7 1.09
Quintile 4 “Possibly” 638 73 (21.4%) 11.4 1.07
Quintile 5 “Probably Yes” 638 165 (48.2%) 25.9 2.42
Total 3193 342 (100%) 10.7 1.00
Table 2
Final logistic regression model, including all variables. Stepwise method (enter: 0.05; exit: 0.05). Variable Parameter ßΛ Standardized ßΛ p-value Intercept (α) 1.7748 <0.001 Beach landscape −7.2631 −0.5151 0.0018 Wetland landscape 1.8725 0.2808 0.0073 Rock landscape 16.3509 0.3627 0.0164 Rock seascape 3.5369 0.3272 0.0115 Muddy sand seascape −1.3936 −0.2798 0.0196 Mud seascape −1.2825 −0.3247 0.0021
<10 m depth −0.9326 −0.3977 <0.001
Pier nearest distance −0.0001 −0.5295 <0.001
Since it was not possible to perform a field survey with a random selection of possible dive sites to validate the model, we verified the classification success of the known dive sites (Table 3). As expected, most instances are within the highest probability class ("Probably yes"), which has a lift of 2.4, meaning that the probability of selecting a suit-able dive site from this class is 2.4 times higher than if it was randomly selected. Almost half (48.2%) of the total (existing) dive sites in the Portuguese south coast are concentrated in 20% of the overall cells. Moreover, the analysis in Table 3 reveals that the percentage of cells with a dive site classified with “Probably yes” is almost 12 times higher than those classified as “Probably not.” The number of dive sites cells in the classes "Probably yes" and "Possibly" comprise 91.5% of the total existing dive sites. Note that these results are influenced by the thresh-olds we defined for the LR scores, which always have some degree of subjectivity (in our analysis, we used quintiles). Nevertheless, depend-ing on the objective of the analysis, we can adjust these thresholds to emphasize either the dive sites’ rate or the number of alternative sug-gestions. Ultimately, it will be up to the decision-maker to tune the thresholds depending upon how many alternatives he or she is willing to consider is being suitable for dive sites.
The geographical pattern in the way the LR classifies each cell is represented in Table 4. The west coast has a higher rate of cells classified as “Probably yes” (53%) and existing dive sites cells (31%). On the other hand, the east coast has a percentage of “Probably yes” cells of 8%, and a rate of existing dive sites of 7%. The center area is in the middle of the spectrum. Hence, the west side of the Portuguese southern coast is the one that concentrates more existing dive sites, as our model also reflects that by the rate of cells, it scores with high probability for finding new ones.
Inspection of dive sites classified with low probability (1–9 cells classified as "Probably Not") indicated that most coincided with ship-wrecks (Empire Warrior, Caldeirinha e Molhe do Farol), archeological sites (L’Oc´ean) or artificial reefs (RA M´odulos de Exploraç˜ao, Navio do
IPIMAR, G´emeos Grandes), whose attractiveness does not directly depend on the natural seascape features where they set. Thus, the model could not possibly target these seascape units as suitable, or likely, dive sites. The exceptions were the Pedra do Anzol and Rod˜ao das Moreiras rocky dive sites. These are located only 1.5 km apart from each other in a spot poorly described by the seabed sediment map, which does not include these rock features.
Since one of the purposes of this study is to relieve the pressure of recreational diving in MPAs, we assessed the proportion of seascape units, with greater suitability for diving, that fall within the PNSACV and PNRF protected areas (Table 5). Each seascape unit within MPAs cor-responds to different protection levels, which define the possibility or restriction for recreational diving. Recreational diving is prohibited in total protection zones (TP) in PNSACV and the totality of PNRF, due to their high ecological sensitivity. However, some exceptions are in place as part of the MPA’s management program. Partial protection I (PPI) are zones with moderate ecological sensitivity, where, e.g., in PNSACV, recreational diving is allowed as a nature tourism activity. Less than 30% of the highest probability cells are within protected areas, of which around 11% are intersecting PNSACV high protection zones (TP and PPI) or within the PNRF. Hence, circa 89% of the hypotheses given by the model are suitable outside these zones.
4. Discussion
The present study aimed to assess which land- and seascape features influence the practice of SCUBA diving in a specific location. Based on a thorough literature review, we selected possible explanatory variables of recreational SCUBA diving site preferences and collected data for mainland Portugal’s south coast in order to model recreational dive site occurrence probability. In an initial step, three logistic regression models were estimated separately, pertaining to land cover, seabed sediment, and distance to relevant features types of variables. These three models isolated the three contexts to examine which ones were significant in explaining dive sites’ presence. A fourth logistic model, including all types of variables, was also developed using a stepwise approach. With this holistic model, we found a set of statistically sig-nificant variables that predict the occurrence of recreational dive sites. We consider these results to be highly valuable in the scope of recrea-tional diving activities’ management, since they allow us to interpret the reasons that justify the occurrence of known dive sites, and to identify options of interesting diving experiences in the remaining seascape that could be explored, in order to alleviate pressures on the most vulnerable spots. As referred by Rangel et al. [23], recreational diving allows un-derwater visitation of natural and cultural resources and should be used as a tool for integrated coastal management, by promoting environ-mental awareness. Likewise, Townsend [48] stated that environenviron-mental education and interpretative tools, within the diving activity, can be used as “soft” management tools.
The first implication of this study, both for researchers, managers, and practitioners, is that landscape and seascape attributes do indeed influence dive site choices. This conclusion is supported by the fact that our models yielded various significant independent variables from the four conceptual groups tested to explain the dependent variable. The observed results showed a positive response regarding features that generally indicate high biological diversity, both in the underwater seascape and emerged landscape, such as areas under the influence of waterlines and respective wetland systems or complex rock structures, consistent with biodiversity contemplation as one of the primary pur-poses of recreational diving. The positive influence of wetlands in this model seems to be mainly due to the "Cavalos Marinhos" dive site, which sits directly in the Ria Formosa wetland (eastern zone). This dive site is notorious for the most likely presence of seahorses, a charismatic species which attracts divers’ attention. The presence of such species is considered an important site selection motivation [49].
Moreover, the influence of more unstable scenarios is noted, in the Table 5
Distribution of results within and outside the PNSACV and PNRF MPAs. High protection zones: total protection (TP), partial protection I (PPI); buffer zone: complementary protection (CP). Recreational diving activity: restricted (R), permitted (P).
Zones "Probably
Yes" cells (n) "Probably Yes" cells (%) Existing dive sites cells (n) Existing dive sites cells (%) PNSACV TP (R) 3 0.5 3 0.9 PNSACV PPI (P) 25 3.9 21 6.1 PNSACV CP (P) 122 19.1 66 19.3 PNSACV (all protection levels) 150 23.5 90 26.3 PNRF (all protection levels; R) 40 6.3 17 5.0 Unprotected 448 70.2 235 68.7 Total 638 100 342 100 Table 4
Results among diving zones.
Zone Number of cells (total of) "Probably yes" Existing dive sites
n % n % n %
Western 331 10 177 53 102 31
Central 948 30 307 32 110 12
Eastern 1914 60 154 8 130 7
sense that dive sites located in the bathymetric interval 0–10 m are avoided, which could be explained by the high exposure to waves and currents (especially in extensive beaches). This factor is probably not only due to difficulty and safety issues, as it implies a greater buoyancy control by the diver, but also because of the consequent effect on the dive quality (e.g., poor visibility) [38]. Visibility is known as one of the most important factors of dive site attractiveness [16,50]. The effect of loss of visibility may be worse in fine sediment situations because of the sediments’ lightness. This effect, in turn, is damped in more sheltered beaches with the presence of rock outcrops, and with increased depth, which theoretically should create more stable environments, more appealing to divers [51]. Despite a sediment distribution that may marginally change over time, and of a base map not as detailed as one would wish for, the conclusions and trends observed should not change in what depends on the physical characteristics of the Algarve’s land-scape and sealand-scape. Rocky shores [39,52], sheltered beaches [39], wa-terlines and adjacent wetland systems [42], are all substantiated in the scientific literature as ecosystems with usually higher biological di-versity. The type of sediment (mud, sand, or gravel) and depth are also key environmental factors in the composition and distribution of fauna and flora [42,52,53].
The second implication of this study is that the presence of anthropic structures on the seabed such as artificial reefs, shipwrecks and other archeological findings is relevant for dive sites’ presence prediction and would almost certainly improve the model. Nonetheless, the aim of this study is to find alternative dive sites to the existing ones, and this would only be possible if we had access to an extended list with other ship-wreck/archeological occurrences. Regarding the artificial reefs, they are all known dive sites in this study.
Our study indicates that, as far as the characteristics of natural sea-scapes are concerned, the western zone has more diving potential. This aspect is most probably mainly due to the extensive rock outcrops that follow the shoreline, creating caves, tunnels and exceptional walls that are worthy as geological structures of interest, and whose complexity favors high species diversity. Rangel et al. [23,24] refer to this while defining preferential scuba diving and snorkeling routes for enhancing tourism visitation and promoting environmental awareness along with biodiversity complex and abundant rocky outcrops, caves, and tunnels in the western Algarve area. As for the anthropic factors that could affect the willingness to dive, the importance of accessibility is underlined in the literature, and referred to as “very important” for Algarve scuba divers interviewed by Rangel et al. [5]. Authors argue that, on the one hand, the closeness to infrastructures and population centers act as positive influencers, but human pressure and long travel time between the site of interest and the nearest urban center, count as negative factors [25,37]. Distance to the nearest pier was found to be one of the main contributors in the model and proved a higher significance. Distance to the nearest city (municipality’s headquarters) and the coastline were found not to be significant. Hence, for practitioners, valuable insights may be drawn about dive sites’ location: (1) dive sites should be in the proximity of piers (or marinas), which has obvious positive aspects both for recreational divers (comfort) and operators (less time/resources spent); (2) should be located under the influence of biodiversity proxies such as waterlines and adjacent wetlands and rock outcrops, increasing the probability of an interesting dive experience; (3) where depth is, ideally, below 10 m, thus avoiding beaches in favor of more stable en-vironments; (4) should avoid fine sediments’ matrices where visibility often limited.
MPAs are based on values other than conservation, such as recrea-tional, commercial, educarecrea-tional, historical, and scientific values that are part of their identity and influence their degree of success [8]. Thus,
recreational diving, which plays an active role in raising public aware-ness for environmental issues, should not be banned entirely from these areas [54]. To support this idea, we assessed to which extent coincident units intersect high protection zones and which fall completely in buffer zones of the MPA. Our model shows that high potential for recreational diving extends far beyond protected areas limits and that it is possible to release these areas and promote this activity in presumed less sensitive areas. The knowledge regarding the distribution of potential dive sites, and the variables contributing to their high selection probability, represent essential information for enhancing the conservation and sustainability of the recreational diving activity.
Likewise, this method is of significant importance for MSP. Depending on the planning objectives (e.g., allocation of conservation and multiple-use zones [54], and/or development of conflict manage-ment plans [55]), the recreational diving suitability scores for each seascape unit can be integrated as an input layer in co-location studies using spatial decision support tools (DSTs). Compatibility matrix [56] and spatial multiple-criteria analysis (SMCA) [54,57] are examples of DSTs. For instance, the compatibility matrix unravels possible conflicts, compatibilities, and synergistic relationships between uses, through a pairwise classification system. Experts may contemplate spatial (hori-zontal and vertical) and temporal (mobile, seasonal, or static uses) variations in this process, as well as the individual and cumulative im-pacts of uses on the environment [58]. SMCA creates concordance maps that exhibit the best spatial distribution of uses, determined by their relative importance (weighting) within different possible scenarios [54]. Some limitations and constraints, which should be acknowledged, were detected while developing this study. As in any quantitative research, the limitations of our study are related to data and the selec-tion of variables. Eventually, few potential variables could have been included in the analysis that were not considered, either because there is no data available or justified by the subjectivity in the choice of vari-ables amongst those that are effectively available—for instance, the influence of the distance between dive sites and dive centers. In the authors’ opinion, the direction of the relationship between dive centers and dive sites is unclear, as some might argue that dive centers exist because of the proximity of good dive sites and not the other way around—secondly, the unavailability of up-to-date and detailed coastal benthic maps and complete underwater heritage georeferenced datasets. Finally, the absence of consistent data describing maritime coastal rec-reational activities [22] must also be emphasized, since it impedes more comprehensive studies, on a regional or a national level, and promotes isolated ones, highly dependent on the researchers’ resources and available time.
5. Conclusions
Our model provides an innovative and sensible solution to develop management options for the sustainable practice of recreational SCUBA diving. Coastal and marine planners can easily integrate the seascape units classified with the highest probability of finding dive sites in ma-rine spatial plans, using DSTs to make this activity compatible with other uses and with marine conservation plans. One of the major con-tributions of this paper is to acknowledge the possibility of having alternate diving quality sites (with similar land and seascape charac-teristics and logistical conditions) outside MPAs’ highly protected areas. We believe that the proposed model has the flexibility to be applied in several rocky reef coastlines since the relationships between the exis-tence of dive sites and the explanatory variables remain, even if the magnitude varies. Moreover, this tool can be easily complemented with carrying capacity studies and adapted to other coastal recreational
activities if landscape/seascape metrics and variables are adjusted. The spatial representation of sites’ suitability for a target activity allows a quick interpretation of its operation in each context and facilitates in-tegrated management and decision-making processes. Understanding the environmental factors that contribute to recreational activities’ practice is the key to their effective management and future preserva-tion, primarily if these depend on the existence of protected and less disturbed environments, such as the case of SCUBA diving.
CRediT authorship contribution statement
Mariana Andrade: Conceptualization, Methodology, Software, Data
curation, Writing - original draft. Frederico Cruz-Jesus: Conceptuali-zation, Methodology, Software, Writing - review & editing. Francisco
Castro Rego: Conceptualization, Supervision. Mafalda Rangel: Writing
- review & editing. Henrique Queiroga: Conceptualization, Supervi-sion, Writing - review & editing.
Acknowledgments
Mariana Cardoso-Andrade wishes to acknowledge the financial support of the Portuguese Foundation for Science and Technology (FCT) through the doctoral grant PD/BD/143087/2018, and the recreational diving data and support of three dive centers in the Algarve: Subnauta (Portim˜ao), Diverscape (Sagres) and Hidroespaço (Faro).
Mafalda Rangel wishes to acknowledge the financial support of the Portuguese Foundation for Science and Technology (FCT) through the post-doctoral grant SFRH/BPD/116307/2016.
Thanks are due to FCT and Minist´erio da Ciˆencia, Tecnologia e Ensino Superior (MCTES) for the financial support to CESAM (UIDP/ 50017/2020 and UIDB/50017/2020), and to CCMAR (UIDB/04326/ 2020), through national funds.
Appendix
See Appendix Tables A.1–A.8. See Appendix Fig. A.1.
Table A.1
Selected features for spatial data analyses and respective data sources.
Source Input data Description
Dive centers Dive sites Dive sites location
DGT, Directorate-General for Spatial Planning (20141,
20072) Administrative data
1 Coastline; coastal municipalities’ administrative limits (Algarve)
(http://mapas.dgterritorio.pt/geoportal/catalogo.html) COS 2007 N2 - Land cover2 Land use/ cover classes: Artificial territories; agricultural and
agroforestry systems; forests and natural and semi-natural ecosystems; beaches, dunes, and sandy areas; bare rock; wetlands
LEAF, Linking Landscape, Environment, Agriculture, and
Food (2013) Administrative data Municipalities’ headquarters location
(http://epic-webgis-portugal.isa.ulisboa.pt/) Hydrography Waterlines
IH, Hydrographic Institute (19861, 20122) Surface Sediment of the Continental
Shelf, Scale: 1/150 0001 Sea bottom sediments: gravel, coarse sand, medium sand, fine sand, muddy sand, mud, rocky outcrops
1(http://www.hidrografico.pt/op/40)
2(http://www.hidrografico.pt/op/33) Isobathymetric model of mainland
Portugal2 Isobathymetric lines: 10 m, 20 m, 30 m
ICNF, Portuguese Institute for Nature and Forests
Conservation (20091, 20112) retrieved from SNIMar,
Nacional Information System of the Sea (2019)
Ria Formosa Natural Park (PNRF)
management plan1 Protected areas limits and regulation zones
(http://geoportal.snimar.pt/) Sudoeste Alentejano e Costa Vicentina Natural Park (PNSACV) management plan2
Table A.2
Logistic regression results for land cover variables.
Variable Parameter ßΛ Standardized ßΛ p-value Intercept (α) −0.131 0.117 Artificial landscape 0.7185 0.0524 0.5953 Agricultural landscape 1.1556 0.0510 0.6684 Naturalized landscape 2.9559 0.4317 0.0024 Beach landscape −8.3799 − 0.5943 <0.001 Wetland landscape 1.6233 0.2434 0.0127 Rock landscape 17.5855 0.3901 0.0148 Table A.3
Logistic regression results for seabed sediment variables.
Variable Parameter ßΛ
Standardized ßΛ p-value Intercept (α) 0.8207 0.0042
Rock seascape 4.2625 0.3944 0.0033 Gravel seascape −0.8614 −0.2934 0.0143 Fine sand seascape −1.2544 −0.3166 0.0030 Coarse sand seascape −0.9413 −0.3380 0.0064 Muddy sand seascape −2.9513 −0.5926 <0.001
Medium sand seascape −0.5944 −0.2455 0.0784 Mud seascape −2.2523 −0.5703 <0.001
Table A.4
Logistic regression results for the nearest neighbor distance variables.
Variable Parameter ßΛ
Standardized ßΛ p-value Intercept (α) 1.0038 0.0022 Beach nearest distance 0.0002 0.4609 0.2788 Rock nearest distance −0.0001 −0.4442 0.0161 Pier nearest distance −0.0001 −0.4118 0.0257 City nearest distance 0.0001 0.2113 0.0372 Waterline nearest distance −0.0003 −0.6165 <0.001
Coastline nearest distance −5.39E-6 −0.0104 0.9969 Simplified coastline nearest distance − 0.0002 −0.3079 0.9085
References
[1] G.M. Annis, D.R. Pearsall, K.J. Kahl, E.L. Washburn, C.A. May, R. Franks Taylor, J. B. Cole, D.N. Ewert, E.T. Game, P.J. Doran, Designing coastal conservation to deliver ecosystem and human well-being benefits, PLoS One 12 (2017), e0172458. [2] C.L. Shafer, Cautionary thoughts on IUCN protected area management categories
V–VI, Glob. Ecol. Conserv. 3 (2015) 331–348, https://doi.org/10.1016/j. gecco.2014.12.007.
[3] J. Claudet, P. Lenfant, M. Schrimm, Snorkelers impact on fish communities and algae in a temperate marine protected area, Biodivers. Conserv. 19 (2010) 1649–1658, https://doi.org/10.1007/s10531-010-9794-0.
[4] S. Lucrezi, M. Milanese, V. Markantonatou, C. Cerrano, A. Sar`a, M. Palma, M. Saayman, Scuba diving tourism systems and sustainability: perceptions by the scuba diving industry in two Marine Protected Areas, Tour. Manag. 59 (2017) 385–403, https://doi.org/10.1016/j.tourman.2016.09.004.
[5] M.O. Rangel, C.B. Pita, J.M.S. Gonçalves, F. Oliveira, C. Costa, K. Erzini, Developing self-guided scuba dive routes in the Algarve (Portugal) and analysing visitors’ perceptions, Mar. Policy 45 (2014) 194–203, https://doi.org/10.1016/j. marpol.2013.10.011.
[6] M.T. Agardy, Accommodating ecotourism in multiple use planning of coastal and marine protected areas, Ocean Coast. Manag. 20 (1993) 219–239, https://doi.org/ 10.1016/0964-5691(93)90068-A.
[7] M. Maccarthy, M. O’neill, P. Williams, Customer satisfaction and Scuba-diving: some insights from the deep, Serv. Ind. J. 26 (2006) 537–555, https://doi.org/ 10.1080/02642060600722841.
[8] D. Davis, C. Tisdell, Recreational scuba-diving and carrying capacity in marine protected areas, Ocean Coast. Manag. 26 (1995) 19–40, https://doi.org/10.1016/ 0964-5691(95)00004-L.
[9] D. Briscoe, S. Maxwell, R. Kudela, L. Crowder, D. Croll, Are we missing important areas in pelagic marine conservation? Redefining conservation hotspots in the ocean, Endanger. Species Res. 29 (2016) 229–237, https://doi.org/10.3354/ esr00710.
[10] L. Wedding, S. Maxwell, D. Hyrenbach, D. Dunn, J. Roberts, D. Briscoe, E. Hines, Geospatial approaches to support pelagic conservation planning and adaptive management, Endanger. Species Res. 30 (2016) 1–9, https://doi.org/10.3354/ esr00716.
[11] M.C. Uyarra, A.R. Watkinson, I.M. Cˆot´e, Managing dive tourism for the sustainable use of coral reefs: validating diver perceptions of attractive site features, Environ. Manag. 43 (2009) 1–16, https://doi.org/10.1007/s00267-008-9198-z.
[12] J. Ramos, M.N. Santos, D. Whitmarsh, C.C. Monteiro, The usefulness of the analytic hierarchy process for understanding reef diving choices: a case study, Bull. Mar. Sci. 78 (1) (2006) 213–219.
[13] L. Mundet, L. Ribera, Characteristics of divers at a Spanish resort, Tour. Manag. 22 (2001) 501–510, https://doi.org/10.1016/S0261-5177(01)00016-4.
[14] R.B. Ditton, H.R. Osburn, T.L. Baker, C.E. Thailing, Demographics, attitudes, and reef management preferences of sport divers in offshore Texas waters, ICES J. Mar. Sci. 59 (2002) S186–S191, https://doi.org/10.1006/jmsc.2002.1188.
[15] J. Lloret, A. Marín, L. Marín-Guirao, M. Carre˜no, An alternative approach for managing scuba diving in small marine protected areas, Aquat. Conserv. Mar. Freshw. Ecosyst. 16 (2006) 579–591, https://doi.org/10.1002/aqc.734. [16] J. Davenport, J.L. Davenport, The impact of tourism and personal leisure transport
on coastal environments: a review, Estuar. Coast. Shelf Sci. 67 (2006) 280–292,
https://doi.org/10.1016/j.ecss.2005.11.026.
[17] D. Davis, C. Tisdell, Economic management of recreational scuba diving and the environment, J. Environ. Manag. 48 (1996) 229–248.
[18] K.C. Ku, T.C. Chen, A conceptual process-based reference model for collaboratively managing recreational scuba diving in Kenting National Park, Mar. Policy 39 (2013) 1–10, https://doi.org/10.1016/j.marpol.2012.09.008.
[19] A.B. Rouphael, G.J. Inglis, “Take only photographs and leave only footprints”?: an experimental study of the impacts of underwater photographers on coral reef dive sites, Biol. Conserv. 100 (2001) 281–287, https://doi.org/10.1016/S0006-3207 (01)00032-5.
[20] K. Dimmock, G. Musa, Scuba Diving Tourism System: a framework for collaborative management and sustainability, Mar. Policy 54 (2015) 52–58,
https://doi.org/10.1016/j.marpol.2014.12.008.
[21] J. Garcia Rodrigues, A.J. Conides, S. Rivero Rodriguez, S. Raicevich, P. Pita, K. M. Kleisner, C. Pita, P.F.M. Lopes, V. Alonso Rold´an, S.S. Ramos, D. Klaoudatos, L. Outeiro, C. Armstrong, L. Teneva, S. Stefanski, A. B¨ohnke-Henrichs, M. Kruse, A. I. Lillebø, E.M. Bennett, A. Belgrano, A. Murillas, I. Sousa Pinto, B. Burkhard, S. Villasante, Marine and Coastal Cultural Ecosystem Services: knowledge gaps and research priorities, One Ecosyst. 2 (2017), e12290.
[22] N. Jobstvogt, V. Watson, J.O. Kenter, Looking below the surface: the cultural ecosystem service values of UK marine protected areas (MPAs), Ecosyst. Serv. 10 (2014) 97–110, https://doi.org/10.1016/j.ecoser.2014.09.006.
[23] M.O. Rangel, C.B. Pita, J.M.S. Gonçalves, F. Oliveira, C. Costa, K. Erzini, Eco- touristic snorkelling routes at Marinha beach (Algarve): environmental education and human impacts, Mar. Policy 60 (2015) 62–69, https://doi.org/10.1016/j. marpol.2015.05.017.
[24] M.O. Rangel, C.B. Pita, J.M.S. Gonçalves, L. Leite, C. Costa, K. Erzini, Ecotourism Snorkelling Routes at Marinha Beach (Algarve), J. Coast. Res. 61 (2011) 274–281,
https://doi.org/10.2112/SI61-001.26.
[25] A. Flores-de la Hoya, E. Godínez-Domínguez, G. Gonz´alez-Sans´on, Rapid assessment of coastal underwater spots for their use as recreational scuba diving sites, Ocean Coast. Manag. 152 (2018) 1–13, https://doi.org/10.1016/j. ocecoaman.2017.11.005.
Table A.7
Hosmer and Lemeshow Test.
Partition for the Hosmer and Lemeshow Test
Group Total Dive_site ¼ 1 Dive_site ¼ 0
Observed Expected Observed Expected
1 69 5 3.79 64 65.21 2 69 11 11.38 58 57.62 3 69 14 22.34 55 46.66 4 69 31 30.11 38 38.89 5 69 44 33.98 25 35.02 6 69 38 37.56 31 31.44 7 69 39 42.88 30 26.12 8 69 46 47.9 23 21.1 9 69 53 52.68 16 16.32 10 67 61 59.38 6 7.62 Table A.6
Association of predicted probabilities and observed responses. Association of Predicted Probabilities and Observed Responses
Percent Concordant 78.9 Somers’ D 0.578 Percent Discordant 21.1 Gamma 0.578 Percent Tied 0.0 Tau-a 0.289 Pairs 118332 c 0.789
Table A.5
Final logistic regression model global significance.
Testing Global Null Hypothesis: BETA = 0
Test Chi-Square df p-value
Likelihood Ratio 196.72 9 <0.001
Table A.8
Hosmer and Lemeshow GoF.
Hosmer and Lemeshow Goodness-of-Fit Test
Chi-Square DF p-value 12.4757 8 0.1312
Fig. A.1. Model assessment with ROC curve. Area under the curve (AUC) = 0.7889.
[26] M.A. Kalkhan, Spatial Statistics: Geospatial Information Modeling and Thematic Mapping, CRC Press, 2011.
[27] F.X. Catry, F.C. Rego, F.L. Baç˜ao, F. Moreira, Modeling and mapping wildfire ignition risk in Portugal, Int. J. Wildl. Fire (2009), https://doi.org/10.1071/ WF07123.
[28] D.J. Mladenoff, T.A. Sickley, A.P. Wydeven, Predicting gray wolf landscape recolonization: logistic regression models vs. new field data, Ecol. Appl. (1999),
https://doi.org/10.1890/1051-0761(1999)009[0037:PGWLRL]2.0.CO;2. [29] Y.C. Collingham, R.A. Wadsworth, B. Huntley, P.E. Hulme, Predicting the spatial
distribution of non-indigenous riparian weeds: issues of spatial scale and extent, J. Appl. Ecol. (2000), https://doi.org/10.1046/j.1365-2664.2000.00556.x. [30] T. Ysebaert, P. Meire, P.M.J. Herman, H. Verbeek, Macrobenthic species response
surfaces along estuarine gradients: prediction by logistic regression, Mar. Ecol. Prog. Ser. (2002), https://doi.org/10.3354/meps225079.
[31] World Travel Awards, Eur. Lead. Beach Destin., 2019.
[32] I.P. Instituto Nacional de Estatística, ed., Estatísticas do Turismo 2017, Lisboa, 2018.
[33] B. Coleman, P.A. Fousek, J. Kinsella, D. Richardson, J.T. Sanders, K. Shreeves, B. Smith, L. Bachelor-Smith, B. Wohlers, PADI Adventures in Diving, International PADI, Inc., Rancho Santa Margarita, CA, 2004.
[34] Agˆencia Portuguesa do Ambiente, Planos de Ordenamento da Orla Costeira, 2018. [35] S. Catita, F.S. Pinto, C. Ramos, L.S. Couto, J.S. Pinto, N. Faria, Guia de mergulho do
Algarve, Subnauta, Lisboa, 2009.
[36] H. Wu, L. Zhou, X. Chi, Y. Li, Y. Sun, Quantifying and analyzing neighborhood configuration characteristics to cellular automata for land use simulation considering data source error, Earth Sci. Inform. 5 (2) (2012) 77–86, https://doi. org/10.1007/s12145-012-0097-8.
[37] A. Ghermandi, P.A.L.D. Nunes, A global map of coastal recreation values: results from a spatially explicit meta-analysis, Ecol. Econ. 86 (2013) 1–15, https://doi. org/10.1016/j.ecolecon.2012.11.006.
[38] K. Dimmock, Finding comfort in adventure: experiences of recreational SCUBA divers, Leis. Stud. 28 (2009) 279–295, https://doi.org/10.1080/
02614360902951674.
[39] A.C. Campbell, J. Nicholls, Fauna e flora do litoral de Portugal e Europa, FAPAS, Porto, 1994.
[40] J.M.S. Gonçalves, P. Monteiro, C.M.L. Afonso, F. Oliveira, M.O. Rangel, M. Machado, P. Veiga, L. Leite, I. Sousa, L. Bentes, L.C. Fonseca, K. Erzini, Cartografia e caracterizaç˜ao das biocenoses marinhas da Reserva Ecol´ogica Nacional Submarina entre a foz do Rio Arade e a Ponta da Piedade, Relat´orio Final. ARH, Faro, 2010.
[41] J.A. Crooks, Characterizing ecosystem-level consequences of biological invasions: the role of ecosystem engineers, Oikos 97 (2) (2002) 153–166, https://doi.org/ 10.1034/j.1600-0706.2002.970201.x.
[42] A.H. Cunha, J.F. Assis, E.A. Serr˜ao, Seagrasses in Portugal: a most endangered marine habitat, Aquat. Bot. 104 (2013) 193–203, https://doi.org/10.1016/j. aquabot.2011.08.007.
[43] J.F. Hair, W.C. Black, B.J. Babin, R.E. Anderson, Multivariate Data Analysis: Pearson New International Edition, 7th edition, Pearson Education Limited, 2014,
https://doi.org/10.1007/978-3-319-01517-0_3.
[44] S. Sharma, Applied Multivariate Techniques, Willey, 1996.
[45] A. Soares-Aguiar, A. Palma-dos-Reis, Why do firms adopt E-Procurement Systems? Using logistic regression to empirically test a conceptual model, IEEE Trans. Eng. Manag. 55 (2008) 120–133, https://doi.org/10.1109/TEM.2007.912806. [46] D.A. Belsley, E. Kuh, R.E. Welsch, Regression diagnostics—identifying influential
data and sources of collinearity, J. Oper. Res. Soc. 32 (2) (1981) 157–158, https:// doi.org/10.1057/jors.1981.33.
[47] L.S. Quaresma, A. Pichon, Modelling the barotropic tide along the West-Iberian margin, J. Mar. Syst. 109–110 (2013) S3–S25, https://doi.org/10.1016/j. jmarsys.2011.09.016.
[48] C. Townsend, Chapter 10 - Interpretation and environmental education as conservation tools, in: B. Garrod, S.B.T. G¨ossling (Eds.), New Frontiers in Marine Tourism: Diving Experiences, Sustainability, Management, Elsevier, Oxford, 2008, pp. 189–200.
[49] C. Cater, Chapter 3 - Perceptions of and interactions with marine environments: diving attractions from great whites to pygmy seahorses, in: B. Garrod, S.B. T. G¨ossling (Eds.), New Frontiers in Marine Tourism: Diving Experiences, Sustainability, Management, Elsevier, Oxford, 2008, pp. 49–64.
[50] S. G¨ossling, O. Lind´en, J. Helmersson, J. Liljenberg, S. Quarm, Chapter 4 - Diving and global environmental change: a mauritius case study, in: B. Garrod, S.B. T. G¨ossling (Eds.), New Frontiers in Marine Tourism: Diving Experiences, Sustainability, Management, Elsevier, Oxford, 2008, pp. 67–92.
[51] B. Garrod, S.B.T. G¨ossling, Chapter 1 - Introduction. New Frontiers in Marine Tourism: Diving Experiences, Sustainability, Management, Elsevier, Oxford, 2008, pp. 3–29.
[52] J.M.S. Gonçalves, P. Monteiro, F. Oliveira, C.M.L. Afonso, M.O. Rangel, D. Milla, N. S. Henriques, I. Sousa, L. Bentes, Biodiversidade Marinha do sublitoral entre a ponta da Piedade e a praia do Barranco, Relat´orio T´ecnico No. 3/2015, PescaMap, Faro, 2015.
[53] V. Henriques, M.T. Guerra, B. Mendes, M.J. Gaudˆencio, P. Fonseca, Benthic habitat mapping in a Portuguese Marine Protected Area using EUNIS: an integrated approach, J. Sea Res. 100 (2015) 77–90, https://doi.org/10.1016/j. seares.2014.10.007.
[54] F. Villa, L. Tunesi, T. Agardy, Zoning marine protected areas through spatial multiple-criteria analysis: the case of the Asinara Island National Marine Reserve of Italy, Conserv. Biol. (2002), https://doi.org/10.1046/j.1523-1739.2002.00425.x. [55] A.O. Tuda, T.F. Stevens, L.D. Rodwell, Resolving coastal conflicts using marine
spatial planning, J. Environ. Manag. (2014), https://doi.org/10.1016/j. jenvman.2013.10.029.
[56] A. Vallega, Towards the sustainable management of the Mediterranean Sea, Mar. Policy (1995), https://doi.org/10.1016/0308-597X(95)92572-O.
[57] F. Villa, M. Ceroni, A. Mazza, A. GIS-based, method for multi-objective evaluation of park vegetation, Landsc. Urban Plan. (1996), https://doi.org/10.1016/S0169- 2046(96)00323-4.
[58] I.M. Bonnevie, H.S. Hansen, L. Schrøder, Assessing use-use interactions at sea: a theoretical framework for spatial decision support tools facilitating co-location in maritime spatial planning, Mar. Policy (2019), https://doi.org/10.1016/j. marpol.2019.103533.