Oliveira, L. M. R. and Cardoso, A. J. M.: "Modelling and simulation of three-phase power transformers", Proceedings of the 6th International Conference on Modelling and Simulation of Electrical Machines, Converters and Systems (ELECTRIMACS 99), vol. 2/3, pp. 257-262, Lisbon, Portugal, September 14-16, 1999.
MODELLING AND SIMULATION OF THREE-PHASE POWER
TRANSFORMERS
Luís M. R. Oliveira,(1) ( 2) A. J. Marques Cardoso (1) ( 3) (1)
Instituto de Telecomunicações – Pólo de Coimbra, Linha de Sistemas de Energia Pólo II - Pinhal de Marrocos, P-3030 Coimbra, Portugal
Tel: +351 39 796232, Fax: +351 39 796293, E-mail: [oliveira],[antonio.cardoso]@co.it.pt (2)
Escola Superior de Tecnologia da Universidade do Algarve Campus da Penha, P-8000 Faro, Portugal
Tel: +351 89 800100, Fax: +351 89 823539, E-mail: lolivei@ualg.pt (3)
Universidade de Coimbra, Departamento de Engenharia Electrotécnica Pólo II - Pinhal de Marrocos, P-3030 Coimbra, Portugal
Tel: +351 39 796272, Fax: +351 39 796247, E-mail: acardoso@dee.uc.pt
Abstract: This paper presents the development and im-plementation of a digital simulation model of a three-phase, three-leg, power transformer. The proposed model, imple-mented in MATLAB environment, is based on the physical concept of representing windings as mutually coupled coils, and it is intended to study its adequacy to incorporate, at a later stage, the influences of the occurrence of windings in-ter-turn short-circuits. Both simulation and laboratory tests results, obtained so far, for a three-phase, 6 kVA transformer, demonstrate the adequacy of the model under normal operat-ing conditions.
List of Symbols
[B] = susceptance matrix, p.u.
[Bm] = magnetising susceptance matrix, p.u.
bdm = direct magnetising susceptance, p.u.
bhm = homopolar magnetising susceptance, p.u.
[I] = vector of currents flowing through the inductive ele-ments, A
[If] = vector of currents entering the transformer by its
ter-minals, A
idm = direct component magnetising current, p.u.
ihm = homopolar component magnetising current, p.u.
[L] = inductance matrix, H
[R] = resistance matrix, representing the load losses, Ω [Rfe] = resistance matrix, representing the no-load losses, Ω
or p.u.
[V] = vector of voltages between the terminals of each winding, V
[Xsc] = short-circuit reactance matrix, Ω or p.u.
[Z] = generic impedance matrix, p.u.
zd = direct component impedance, p.u.
zh = homopolar component impedance, p.u.
zS = self impedance of a phase or leg, p.u.
zM = mutual impedance among the three phases, p.u.
1.- INTRODUCTION
Transformers constitute the largest single component of the transmission and distribution equipment market. In 1995, the estimated value of the world market for power transform-ers was US$11.85 billions [1]. Therefore it is quite obvious the need for the development of on-line diagnostic tech-niques, that would aid in transformers maintenance. A survey of the most important methods, actually in use, for condition monitoring and diagnostics of power transformers, presented in [2], stresses the need for the development of new diagnos-tic techniques, which can be applied without taking trans-formers out of service, and which can also provide a fault severity criteria, in particular for determining transformers winding faults.
Preliminary experimental results, presented in [2] and [3], concerning the use of the Park's Vector Approach, has demonstrated the effectiveness of this non-invasive technique for diagnosing the occurrence of inter-turn short-circuits in the windings of operating three-phase transformers. The on-line diagnosis is based on identifying the appearance of an elliptic pattern, corresponding to the transformer supply cur-rent Park's Vector representation, whose ellipticity increases with the severity of the fault and whose major axis orienta-tion is associated to the faulty phase.
in-ter-turn short-circuits occurrence, and also to acquire a gen-eralised perspective of this phenomenon, it becomes neces-sary to develop a digital computer simulation model of three-phase power transformers, which is the scope of this paper.
During the last decades a number of transformer models have been developed, which have been used for the simula-tion of a wide range of steady-state and transient phenomena [4].
Most of the models were developed for use in the Elec-tromagnetic Transients Program (EMTP) environment, namely, the Saturable Transformer Model [5], the Geometri-cal Model (GMTRAN) [6] and the Admittance Matrix Model (BCTRAN) [7-9], among others. The programming language of EMTP is FORTRAN-77. Such a program has a closed ar-chitecture and uses a large number of code lines to satisfy requirements ranging from low level data manipulation to the actual solution mathematics which eventually become diluted and almost impossible to visualise [10].
To overcome these difficulties, the three-phase trans-former model presented in this paper was implemented in the MATLAB environment.
The three-phase transformer model described here is based on the physical concept of representing windings as mutually coupled coils; with this approach a three-phase transformer simply becomes a system of 6 coupled coils. The admittance matrix for the coupled coils can easily be derived from the commonly available test data [7].
2.- MODEL DEVELOPMENT
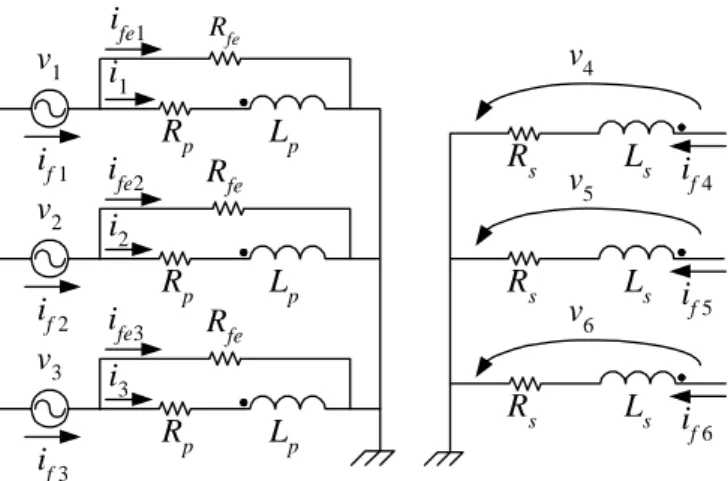
The complete circuit-model of a three-phase, three-leg, two-winding transformer, with a star-star winding connection is shown in Fig. 1. The inductive elements include mutual couplings among all windings. The resistances in series with the inductive elements represent the load losses, whereas parallel resistances represent the no-load losses [6]. The ba-sic voltage and current equations of the transformer model can be written as follows:
[ ] [ ] [ ]
[ ] [ ]
L I dt d I R V = ⋅ + ⋅ (1)[ ]
If =[ ]
I +[ ]
Rfe −1⋅[ ]
V (2) where, for the case of a three-phase, two-windingtrans-former, vectors [V], [I] and [If] have six elements and the
square matrices [R], [Rfe] and [L] have 6×6 dimensions.
Fig. 1: Circuit-model of a three-phase two-winding transformer.
The diagonal matrix [R] is easily obtained from the short-circuit test.
The precision of the model is strongly dependent on the accuracy of the inductance matrix [L]. The direct calculation of the [L] matrix must be done with very high accuracy, es-pecially if the exciting current is low, to make certain that the short-circuit inductances are still reasonably accurate [7-9]. To avoid the ill-conditioning problems of the [L] matrix, an alternative formulation can be used, which consists in the in-verse inductance matrix, [L]-1, direct calculation.
In order to simplify the notation, the inverse inductance matrix will be expressed as a function of the modulus of the susceptance matrix, [B]:
[ ]
L −1=ω⋅[ ]
B (3)being ω the angular frequency. As a first approach, the excit-ing current is ignored. Thus, matrix [B] is built only from the short-circuit reactances, leading to [7-9]:
[ ]
[ ]
[ ]
[ ]
[ ]
⎥⎥ ⎦ ⎤ ⎢ ⎢ ⎣ ⎡ − − = − − − − 1 1 1 1 sc sc sc sc X X X X B p.u. (4)where [Xsc] is the short-circuit reactance matrix. As in any
other three-phase power system, the matrix [Xsc] has the
form:
[ ]
⎥ ⎥ ⎥ ⎥ ⎦ ⎤ ⎢ ⎢ ⎢ ⎢ ⎣ ⎡ = S M M M S M M M S z z z z z z z z z Z p.u. (5) v1 v2 v3 Rp Rfe Rfe Rfe if 1 if 2 if 3 if 4 if 6 if 5 v4 ife1 ife2 ife3 Rp Rp Lp Lp Lp i2 i1 i3 v5 v6 Rs Rs Rs Ls Ls Ls[A] -0.4 -0.3 -0.2 -0.1 0.0 0.1 0.2 0.3 0.4 0 5 10 15 20 25 30 35 40 if 1 if 2 if 3 -0.4 -0.3 -0.2 -0.1 0.0 0.1 0.2 0.3 0.4 0 5 10 15 20 25 30 35 40 if 1 if 2 if 3 [A] with: zS =
(
zh+2⋅zd)
3 1 p.u. (6) and zM =(
zh−zd)
3 1 p.u. (7)where zSis the self impedance of a phase or leg and zMis the
mutual impedance among the three phases or legs. These self and mutual impedances are related to the direct and homopo-lar values, zdand zhrespectively. With the values of the
reac-tances of the direct and homopolar short-circuit tests inserted in (6) and (7), the matrix [Xsc] is constructed using (5), and
consequently [B] is determined through (4).
It is now necessary to include the effect of the linear magnetisation reactance. From the values of the p.u. exciting currents and the p.u. no-load losses in the direct and ho-mopolar excitation tests, it is possible to determine the direct and homopolar magnetising currents, idm and ihm,
respec-tively, which flow in the magnetisation reactance. The recip-rocals of the direct and homopolar p.u. magnetising reac-tances (bdm and bhm, respectively), become:
dm dm i
b = p.u. and bhm=ihm p.u. (8)
The magnetising matrix, [Bm], is then calculated applying the
general formulas of (5) through (7). This matrix is added to one of the diagonal sub-matrices of [B] [9].
To include excitation losses, three coupled resistance branches must be added across the terminals of one side (Rfe
in Fig. 1). Therefore, only the first diagonal 3×3 sub-matrix of the magnetising resistance matrix [Rfe] has non-zero
val-ues. Using again the general formulas of (5) through (7), this sub-matrix is constructed, being their diagonal and off-diagonal elements obtained from the p.u. no-load losses [9].
After the conversion of p.u. values to physical values, the three-phase, three-leg, two-winding transformer model, with star-star winding connection, is complete.
3.- LINEAR MODEL VALIDATION
For the model validation a three-phase, three-leg trans-former, of 6 kVA, 220/127 V, was used. The transformer has two-windings per phase on the primary and on the secondary side, having, one of each, been modified by addition of a number of tappings connected to the coils, for each of the three phases, allowing for the introduction of different per-centages of shorted turns at several locations in the winding, for subsequent studies of inter-turn short-circuits occurrence.
The direct and homopolar short-circuit and excitation tests were performed with the transformer having a star-star wind-ing connection, without neutral wire, in order to obtain the matrices elements.
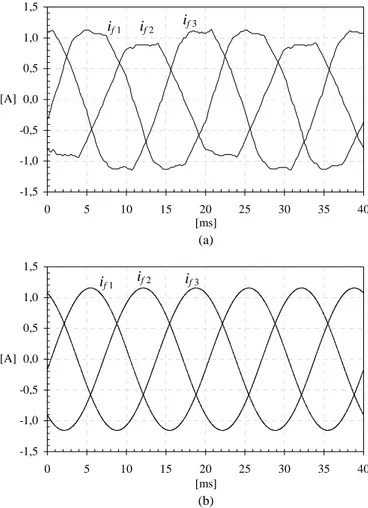
The transformer digital model, with Y/y0 connections, was initially tested under no-load conditions. With the sec-ondary side open-circuited, a symmetrical three-phase volt-age system, with transformer nominal values, was applied to the primary side. The experimental primary exciting currents are shown in Fig. 2(a), which presents highly distorted wave-forms. Since the transformer non-linear effects are neglected, the simulated primary currents are three-phase symmetrical vectors, Fig. 2(b).
The transformer model, with Yn/yn0 connections, was then tested under steady-state load conditions. A three-phase, star connected, balanced resistor of 107 Ω per phase, was coupled to the secondary side, being the primary side ener-gised by a symmetrical three-phase voltage system, with transformer nominal values. The experimental and simulated
[ms]
(a)
[ms]
(b)
Fig. 2: No-load test waveforms: (a) primary side experimental cur-rents; (b) primary side simulated currents.
[A] -1,5 -1,0 -0,5 0,0 0,5 1,0 1,5 0 5 10 15 20 25 30 35 40 if 1 if 2 if 3
primary side current waveforms are shown in Fig. 3(a) and Fig. 3(b), respectively. It is obvious the minor amplitude of the experimental central leg winding current in relation to the other phase currents, which results from the higher induc-tance of this leg [3]. Since the saturation effects have not been considered, so far, in the model, the simulation current waveforms do not present this characteristic, being impera-tive to include this phenomenon in the digital model.
4.- SATURATION EFFECTS
Core saturation behaviour can be determined from the open-circuit magnetisation curves of the transformer [11]. In each integration step, the magnetising matrix, [Bm], is now
updated using the inductances calculated from the magnetisa-tion curves of the correspondent columns of the transformer. Since the homopolar magnetisation curve has an almost con-stant slope [12], it can be approximated to the case of a linear inductance, as previously. A direct 5 segment piece-wise lin-ear inductance, for each leg of the transformer,
[ms]
(a)
[ms]
(b)
Fig. 3: Steady-state load conditions waveforms: (a) primary side experimental currents; (b) primary side simulated currents.
was then used to model the saturation effects, as presented in Fig. 4. The no-load losses are still modelled as a linear resis-tance.
The values of the magnetising currents are determined from the values of the exciting currents and no-load losses, for each point of the magnetisation curves. The VRMS – IRMS points of the magnetisation curves are then converted to a flux–current maximum values characteristics in order to ob-tain the magnetising inductance [9].
Since the magnetisation curves are different for each column of the transformer, (5) is no longer valid, because the system becomes unbalanced. To overcome this difficulties the diagonal elements of [Bm] were calculated, in each
inte-gration step, using the inductance of the correspondent direct magnetisation curve, being the off-diagonal elements calcu-lated using the average of the correspondents direct magnet-ising inductances of the two columns involved. With this ap-proximation, it is possible, however roughly, to take also into account the magnetic circuit asymmetries.
5.- NON-LINEAR MODEL VALIDATION
In the no-load test, the saturation effects and the asym-metries in the magnetic core of the transformer are outlined. For the Y/y0 winding connections, the no-load test was again simulated, with the saturation effects included in the model. The simulated primary currents (Fig. 5), in which the core saturation effects are obvious, are in relatively good agree-ment with the experiagree-mental ones (Fig. 2(a)).
The simulated direct magnetisation curves were obtained trough several excitation tests. The flux-current characteris-tics, plotted in Fig. 6, follow the real curves accurately.
[A]
Fig. 4: Experimental direct magnetisation curves.
0,0 0,1 0,2 0,3 0,4 0,5 0,6 0,7 0,8 0,0 0,1 0,2 0,3 0,4 0,5 0,6 0,7 [Wb.t]
Phase 1; Phase 2; Phase3
-1,5 -1,0 -0,5 0,0 0,5 1,0 1,5 0 5 10 15 20 25 30 35 40 [A] if 1 if 2 if 3
[ms]
Fig. 5: Primary side simulated exciting currents.
[A]
Fig. 6: Simulated direct magnetisation curves.
The previous steady state load test was again simulated with the saturation effects included in the model. The simu-lated primary side current waveforms are shown in Fig. 7. In spite of the fact that the central leg winding current is slightly lower than the other phase currents, the simulated primary currents system is not so unbalanced as the experimental one, (Fig. 3(a)).
The experimental primary side current Park’s Vector pattern, under steady state load conditions, shown in Fig 8(a), differs slightly from the circular locus expected for ideal conditions, due to, among others, the lower amplitude of the central leg primary winding current, with respect to the others primary windings currents. The corresponding simu-lated Park's Vector pattern, shown in Fig. 8(b), is in rela-tively good agreement with the experimental one.
6.- DISCUSSION
From the previously presented tests, it is obvious that the
[ms]
Fig. 7: Primary side simulated currents under steady-state load conditions.
[A] [A]
(a) (b)
Fig. 8: Primary side current Park's Vector patterns under steady-state load conditions: (a) experimental; (b) simulated.
transformer model behaviour is strongly dependent on the saturation effects, which are included in the algorithm with the aid of the symmetrical components theory, with a linear homopolar magnetising inductance and a piecewise direct inductance. However, an operating point variation in the ho-mopolar magnetisation curve does not imply a corresponding variation in the direct magnetisation curve, and vice-versa, since the effects are separated, in the model, by the symmet-rical components theory, which, in reality, are no longer un-coupled. These factors, in conjunction with the non-linear behaviour of the iron and hysteresis losses, are the major causes for the model inaccuracies, despite its satisfactory overall performance. Furthermore, the introduction of wind-ing inter-turn short-circuits, uswind-ing the approach suggested in [3], results in a more unbalanced impedance system, in which two coupled groups of asymmetries will exist, dealing with, among others, local saturation points in the magnetic circuit and several different leakage fluxes. The study of these phenomena with the symmetrical components theory is not suitable. Therefore, although the model behaviour is still reasonable accurate under normal operating conditions, in which the transformer is taken as a "black box", it can not be
0,0 0,1 0,2 0,3 0,4 0,5 0,6 0,7 0,8 0,0 0,1 0,2 0,3 0,4 0,5 0,6 0,7 [Wb.t]
Phase 1; Phase 2; Phase3
-2 -1 0 1 2 -2 -1 0 1 2 -2 -1 0 1 2 -2 -1 0 1 2 [A] [A] [A] -1,5 -1,0 -0,5 0,0 0,5 1,0 1,5 0 5 10 15 20 25 30 35 40 if 1 if 2 if 3 [A] if 1 if 2 if 3 -0.4 -0.3 -0.2 -0.1 0.0 0.1 0.2 0.3 0.4 0 5 10 15 20 25 30 35 40
used for winding inter-turn short-circuits analysis. For this type of studies, an alternative formulation must be consid-ered, which should be based in direct phase quantities.
7.- CONCLUSIONS
This paper describes the development and implementa-tion of a digital simulaimplementa-tion model of a three-phase, three-leg, two-winding transformer. The elements of the model matri-ces can be calculated from the available test data concerning direct and homopolar, short-circuit and excitation tests, which constitute the main advantage of the model.
Both simulation and laboratory tests results demonstrate the adequacy of the model, under normal operating condi-tions. However, it seems that the model is not suitable to study winding inter-turn short-circuits occurrence, being an alternative formulation suggested.
Further work is currently in progress, using the sug-gested alternative formulation, concerning the modelling and simulation of the behaviour of three-phase transformers, un-der the influence of winding inter-turn short circuits. Addi-tionally, some refinements of the new proposed model will be introduced, with the aim of dealing with the simultaneous occurrence of winding faults, unbalanced supply voltages, or even the surrounding presence of power electronics equip-ment.
Acknowledgement
The authors wish to acknowledge the financial support of the Portuguese Foundation for Science and Technology (FCT), under Project Number PRAXIS/P/EEI/14151/1998. Thanks are also expressed to Mr. S. M. A. Cruz for his inter-est as well as for the useful discussions during this work.
References
[1] Aubertin, S.: Opportunity knocks, International Power Genera-tion, vol. 20, No. 2, March 1997, pp. 47-48.
[2] Cardoso, A. J. M.; Oliveira, L. M. R.: Condition monitoring and diagnostics of power transformers, Proceedings of the 11th International Congress and Exhibition on Condition Monitor-ing and Diagnostic EngineerMonitor-ing Management (COMA- DEM'98), vol. 2, pp. 591-599, Launceston, Tasmania, Austra-lia, December 8-11, 1998.
[3] Cardoso, A. J. M.; Oliveira, L. M. R.; Gameiro, N. S. and Ve-loso, P. M. M. G.: Fault diagnosis in three-phase transformers (in Portuguese), Anais da Engenharia e Tecnologia Electrotéc-nica, No. 6, March 1998, pp. 9-12.
[4] Papadias, B. C.; Hatziargyriou, N. D.; Bakopoulos, J. A.; Prousalidis, J. M.: Three phase transformer modelling for fast electromagnetic studies, IEEE Trans. on Power Delivery, vol. 9, No. 2, April 1994, pp. 1151-1157.
[5] Leuven EMTP Center, 1990, Alternative Transients Program – Rule Book, LEC, Leuven, Belgium.
[6] Hatziargyriou, N. D., Prousalidis, J. M., Papadias, B. C.: Gen-eralised transformer model based on the analysis of its mag-netic circuit, IEE Proceedings-C, vol. 140, No. 4, July 1993, pp. 269-278.
[7] Branwajn, V., Dommel, H. W., Dommel, I. I.: Matrix repre-sentation of three phase N-winding transformers for steady-state and transient studies, IEEE Trans. Power Appar. & Syst., vol. PAS-101, No. 6, June 1982, pp. 1369-1378.
[8] Dommel, H. W.: Transformer models in the simulation of elec-tromagnetic transients, Proceedings of the 5th Power Systems Computation Conference, Cambridge, England, Paper 3.1/4, September 1-5, 1975.
[9] Dommel, H. W., 1996, EMTP Theory Book, University of British Columbia, Vancouver, Canada.
[10] Mahseredjian, J.; Alvarado, F.: Creating an electromagnetic transients program in MATLAB: MatEMTP, IEEE Trans. on Power Delivery, vol. 12, No. 1, January 1997, pp. 380-387.
[11] Ong, Chee-Mun, 1997, Dynamic Simulation of Electric Ma-chinery using Matlab/Simulink, Prentice Hall PTR, New Jer-sey, USA.
[12] Dick, E. P., Watson, W.: Transformer models for transients studies based on field measurements, IEEE Trans. Power Ap-par. & Syst., vol. PAS-100, No. 1, January 1981, pp. 409-417.