Life expectancy without depression
increases among Brazilian older adults
Flávia Cristina Drumond AndradeI, Fan WuII, Maria Lúcia LebrãoIII, Yeda Aparecida de Oliveira DuarteIV
I Department of Kinesiology and Community Health. College of Applied Health Sciences. University of Illinois
at Urbana-Champaign. Champaign, IL, EUA
II San Francisco Department of Public Health. Community Behavioral Health Services. San Francisco, CA, EUA III Departamento de Epidemiologia. Faculdade de Saúde Pública. Universidade de São Paulo. São Paulo, SP, Brasil IV Departamento de Enfermagem Médico-Cirúrgica. Escola de Enfermagem. Universidade de São Paulo. São
Paulo, SP, Brasil
ABSTRACT
OBJECTIVE: To estimate life expectancy with and without depressive symptoms in older adults for the years 2000 and 2010.
METHODS: We evaluated individuals aged 60 years or older (n = 1,862 in 2000 and n = 1,280 in 2010), participants of the Saúde, Bem-Estar e Envelhecimento (SABE – Health, Wellbeing and Aging) study in in Sao Paulo, Southeastern Brazil. Depression was measured using the shorter version of the Geriatric Depression Scale (GDS-15); respondents scoring ≥ 6 were classiied as having depression. Estimates of life expectancy with and without depression were obtained using the Sullivan method.
RESULTS: Data from 2000 indicate that 60-year-old men could expect to live, on average, 14.7 years without depression and 60-year-old women could expect to live 16.5 years without depression. By 2010, life expectancy without depression had increased to 16.7 years for men and 17.8 years for women. Expected length of life with depression difered by sex, with women expected to live more years with depression than men.
CONCLUSIONS: Between 2000 and 2010, life expectancy without depression in Sao Paulo increased. However, older adults in Brazil, especially older women, still face a serious burden of mental illness.
DESCRIPTORS: Aged. Life Expectancy. Aging. Depression, epidemiology. Gender and Health. Health Surveys.
Correspondence:
Flávia Cristina Drumond Andrade 1206 S. 4th Street
2011 Huff Hall
61822 Champaign, IL, USA E-mail: [email protected]
Received: 06 Oct 2014 Approved: 30 May 2015
How to cite: Andrade FCD, Wu F, Lebrão ML, Duarte YAO. Life expectancy without depression increases among Brazilian older adults. Rev Saude Publica. 2016;50:12.
Copyright: This is an open-access article distributed under the terms of the Creative Commons Attribution License, which permits unrestricted use, distribution, and reproduction in any medium, provided that the original author and source are credited.
INTRODUCTION
Depression is a common mental health condition among older adults in Brazil. Researchers have estimated that more than 25.0% of community-dwelling older adults in Brazil have
clinically signiicant depressive symptoms and 7.0% have major depression4. hese rates are
even higher among older adults who are hospitalized or living in long-term facilities. A recent
meta-analysis found that the prevalence of clinically signiicant depressive symptoms varied
from 20.0%-56.0% among hospitalized older adults in Brazil, and the rates among older adults in long-term care facilities varied from 11.0%-65.0%11. Chisholm et al.12 estimated that
it would cost US$170 per capita per year to cover the direct expenses of treating individuals with subclinical depression in the Country.
Experiencing depression at an older age has important implications for individuals, families and society. Among older adults, depression causes individual and family suffering and is associated with poor adherence to recommended medical treatment15,
poor lifestyle behaviors34, cognitive impairment24, and physical disability9,27. In turn, these
factors are associated with lower quality of life7,16, higher level of health care use7,8, and
higher mortality rates28.
Many factors can trigger the onset of depressive symptoms among older adults. Medical disorders such as cancer, metabolic disorder, heart disease, and stroke are commonly associated with depressive symptoms28. Limitations in daily activities, cognition, and mobility
as well as social changes (such as retirement, bereavement, social isolation, and relocation)
also inluence mood and distress, leading to depressive symptoms. Because the prevalence
of these conditions increases with age, researchers and policy makers should not overlook depressive symptoms among the older population.
Life expectancy among older adults in Brazil has increased in recent decades. Life expectancy at birth increased from 51 to 72 years from 1950-2010, and is expected to reach 77.4 years by 2030a. During the same period, the proportion of older adults grew from 5.0% of the total
population to about 10.0%. By 2030, the older adult population is expected to more than double, reaching 40.7 million people or 17.1% of the total Brazilian populationb.
While previous studies have provided important estimates of the prevalence of clinically
significant depressive symptoms and major depressive symptoms among older adults
in Brazil, as well as the factors associated with those conditions, to the best of our knowledge, no studies have estimated the length of life with depressive symptoms, information that would help researchers and policy makers better understand the burden of this condition for this fast-aging society. Given that life expectancy among older adults in Brazil has increased in recent decades, estimates of life expectancy with and without depression are critical to the accurate determination of current and future social and medical service needs.
In this study, we estimated life expectancy with and without depressive symptoms among older adults for the years 2000 and 2010.
METHODS
his study analyzed data from the Saúde, Bem-Estar e Envelhecimento (SABE – Health, Wellbeing and Aging) survey, a longitudinal study of a probabilistic sample of older adults (age 60 and
older) of both sexes living in the city of Sao Paulo, SP, Southeastern Brazil. he irst wave of
the SABE survey was conducted in 2000 with a sample of 2,143 respondents obtained using
a two-stage stratiied sampling method. Individuals aged 75 or older were oversampled to
compensate for the group’s higher mortality rate and smaller probability of being sampled. Details of the study sampling methodology can be found elsewhere22. In 2006, a second wave
of data was collected (n = 1,413). he sample for the follow-up data collection included the
a Comisión Económica para
América Latina y el Caribe. Mortalidad. Observatório Demográico. 2007;2(4). Available from: http://www. cepal.org/publicaciones/ xml/9/33269/OD-4-contents-introduction.pdf
b Comisión Económica para
1,115 older adults from the baseline study and 298 new respondents age 60-64. Data collection procedures were the same as in the baseline study. In 2010, a third wave of data was collected
(n = 1,345). hree groups participated in that wave: a) 748 respondents from the baseline study,
b) 242 respondents from the 2006 study, and c) 355 new respondents age-64.
he study reported here focuses on the cross-sectional prevalence rates of depression
estimated from data obtained in 2000 and 2010. Sample weights for 2000 were calculated based on the 2000 census and weights for the 2010 sample were based on the 2010 census. Depression was measured using the shorter version of the Geriatric Depression Scale (GDS-15)
in the SABE survey. he GDS-15 short form was based on the GDS-3037 and has been widely
used in clinical and population-based studies as a screening instrument for late-life depression. Several studies have analyzed the scale’s validity and reliability, and have found that the
instrument has good speciicity and sensitivity30. SABE used a GDS-15 questionnaire validated
for use in Brazil1. Individuals with missing data on more than ive items were excluded from the
analysis. We used prorated procedures to estimate scores for respondents with missing data
on ive or fewer items. he Cronbach’s alpha coeicient for the total scale was 0.82 for both years. We used a GDS-15 cutof score of ≥ 6 points to classify individuals as having depression1.
Mortality data were obtained from the Fundação Sistema Estadual de Análise de Dados
(SEADE Foundation – State System for Data Analysis Foundation)c, which provides data on
social, demographic, and economic status for the State of Sao Paulo. We generated estimates for 2000 and 2010 using the 1999-2000-2001 and 2009-2010-2011 tables.
Sex was included as a covariate when disaggregating the data, given sex diferences in
mortality and prevalence of depressive symptoms. We estimated prevalence rates and 95%
conidence intervals using sampling weights with Stata-SE version 12.1. Logistic regressions were used to assess sex and wave-related diferences.
he Sullivan method (Sullivan, 1997) was used to estimate life expectancy with and without depression. he method employs a standard life table with two states, alive and dead. he alive
state is subdivided into two categories, healthy (nondepressed) and unhealthy (depressed), using data on the observed prevalence of depression6,22,d. he major inputs are the age-speciic
prevalence of depressed and nondepressed states in the population and age-speciic mortality rates. he expected years in the nondepressed state and expected years in the depressed state were estimated by applying the age- and sex-speciic cross-sectional prevalence rates
for nondepressed and depressed respondents, respectively, to the person-years lived in
diferent age groups (derived from the period life tables).
Healthy Life Expectancy (HLE)
lx
Σ
(1 − nπ
x)nLxand
Life Expectancy with Depressionx
x
l
Σ(nπx) nLx
Healthy life expectancy (HLE) is the average number of years an individual is expected to live without depression, starting at an exact age x; life expectancy with depression represents the average number of years an individual is expected to live with depression, starting at an exact age x. To calculate HLE and life expectancy with depression, we used the prevalence of depression for individuals aged x to x + n (nπx) (obtained from the SABE survey), the total number of years
of life expectancy for individuals aged x to x + n (nLx), and the survival probability for exact age x (lx). he last two variables were obtained from the life table generated from estimates provided by SEADE. Total life expectancy (TLE) is the sum of healthy (HLE) and unhealthy years of life.
hese estimates are independent of the age structure of the population.
he SABE survey was approved by the Research Ethics Committee of the Faculdade de Saúde Pública, Universidade de São Paulo, Brazil (Process: 67/99) and by the Brazilian
c Mortality data were obtained
directly with Dr. Carlos Eugenio de Carvalho Ferreira, director of the Population Projection Area at SEADE Foundation.
d Jagger C, Hauet E, Brouard N.
National Ethics Committee (Process 315/99). Participation in the study was voluntary, and each respondent signed an informed consent form. he present study was approved by the
Institutional Review Board at the University of Illinois.
RESULTS
In 2000 and 2010, respectively, 281 (13.1%) and 65 subjects (4.8%) had missing data on
depressive symptoms. In both years, those with missing data were older than those with complete data (in 2000, 80.8 years versus 72.1, p < 0.001; in 2010, 83.5 years versus 72.3,
p < 0.001); however, there were no sex diferences between the two groups.
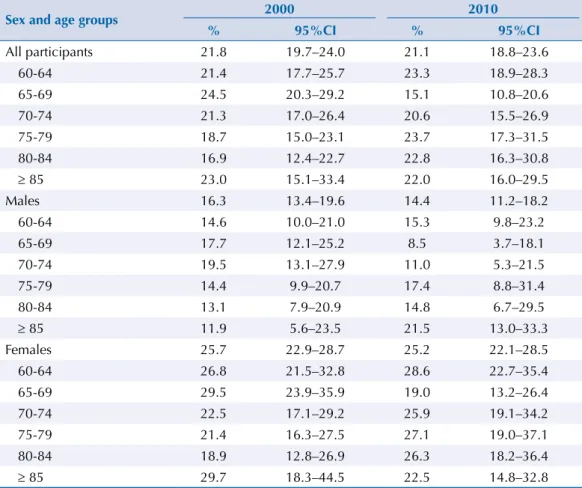
Table 1 shows the results related to the prevalence of depression in 2000 and 2010 (weighted estimates) in the Sao Paulo population of older adults. Among the 1,862 participants in the 2000 sample, 21.8% (95%CI 19.7–24.0) were categorized as having depression (i.e., scored 6 or more on
the GDS scale). he prevalence rate did not change over time: 21.1% (95%CI 18.8–23.6) of the 1,280
older adults in the 2010 sample were categorized as having depression. In the logistic regression models (results not shown, but available upon request), depression was more common among
women than among men in both periods, even after controlling for age (p < 0.0001). he depression
rate for men was 16.3% in 2000 and 14.4% in 2010, whereas the rate for women was about one fourth of the population in each year (25.7% in 2000 and 25.2% in 2010).
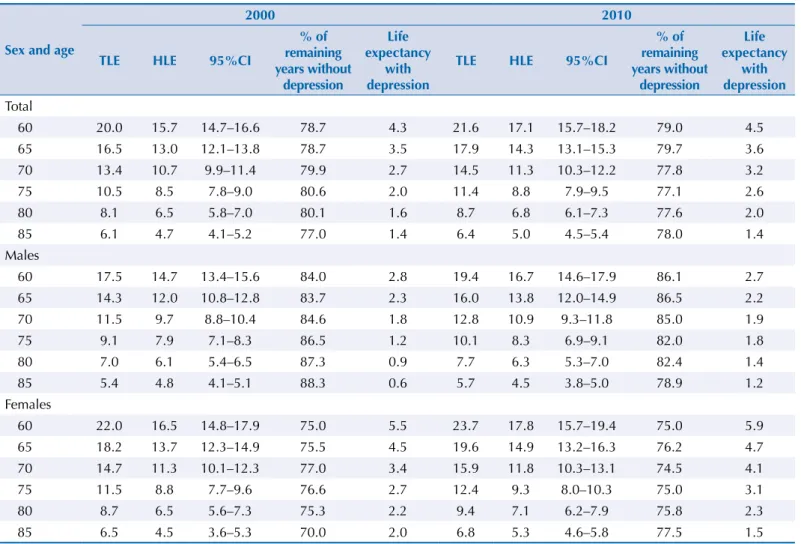
TLE increased in Sao Paulo from 2000 to 2010 for both men and women (Table 2). TLE at age 60 increased from 17.5 years to 19.4 years for men and from 22.0 years to 23.7 years for women.
he estimated average number of years lived without depression also increased. Among men,
HLE at age 60 was 14.7 years in 2000 and 16.7 years in 2010, an increase of two years. Among
women, the gain was smaller: HLE at age 60 was 16.5 years in 2000 and 17.8 years in 2010.
Table 1. Prevalence and 95%CI of depression among older adults in Sao Paulo, Brazil: 2000 and 2010 (weighted estimates).
Sex and age groups 2000 2010
% 95%CI % 95%CI
All participants 21.8 19.7–24.0 21.1 18.8–23.6
60-64 21.4 17.7–25.7 23.3 18.9–28.3
65-69 24.5 20.3–29.2 15.1 10.8–20.6
70-74 21.3 17.0–26.4 20.6 15.5–26.9
75-79 18.7 15.0–23.1 23.7 17.3–31.5
80-84 16.9 12.4–22.7 22.8 16.3–30.8
≥ 85 23.0 15.1–33.4 22.0 16.0–29.5
Males 16.3 13.4–19.6 14.4 11.2–18.2
60-64 14.6 10.0–21.0 15.3 9.8–23.2
65-69 17.7 12.1–25.2 8.5 3.7–18.1
70-74 19.5 13.1–27.9 11.0 5.3–21.5
75-79 14.4 9.9–20.7 17.4 8.8–31.4
80-84 13.1 7.9–20.9 14.8 6.7–29.5
≥ 85 11.9 5.6–23.5 21.5 13.0–33.3
Females 25.7 22.9–28.7 25.2 22.1–28.5
60-64 26.8 21.5–32.8 28.6 22.7–35.4
65-69 29.5 23.9–35.9 19.0 13.2–26.4
70-74 22.5 17.1–29.2 25.9 19.1–34.2
75-79 21.4 16.3–27.5 27.1 19.0–37.1
80-84 18.9 12.8–26.9 26.3 18.2–36.4
In both 2000 and 2010, the ratio of healthy years to total years was higher for men than for
women. his result suggests that although women lived longer than men, on average, women
were more likely to spend a higher percentage of their remaining lives with depression than men. Both men and women experienced very little change in life expectancy with depression over time. On average, women at age 60 were expected to live 5.5 years with depression in 2000 and 5.9 years in 2010. For men at age 60, life expectancy with depression was 2.8 years in 2000 and 2.7 years in 2010.
DISCUSSION
Findings show that from 2000-2010, both TLE and life expectancy without depression
increased among older adults in Sao Paulo, which may relect living more years with higher
quality of life, less disability, and better health status28. Given the association between
depression and mortality, the recent gains in life expectancy without depression can increase TLE by reducing the number of premature deaths due to several causes (e.g., suicide). Life expectancy and HLE are related to economic and social capital as well as social inequalities. In Brazil, the 2000-2010 period was marked by economic growth, improvements in social indicators, and reductions in social inequalities. According to the World Bank’s World Development Indicators database, per capita gross domestic product (measured in US dollars at 2005 prices) grew from US$4,407 in 2000 to US$5,618 in 201026. he human development
index, a composite measure including health, schooling, and income, has also improved in Brazil over recent decadese. he Gini coeicient, a measure of income inequality ranging
from 0 (complete equality) to 1 (complete inequality), fell from 0.59 in 2000 to 0.54 in 2009.
Table 2. Total life expectancy (TLE) and life expectancy without depression (HLE) among older adults in Sao Paulo, Brazil: 2000 and 2010.
Sex and age
2000 2010
TLE HLE 95%CI
% of remaining years without
depression
Life expectancy
with depression
TLE HLE 95%CI
% of remaining years without
depression
Life expectancy
with depression Total
60 20.0 15.7 14.7–16.6 78.7 4.3 21.6 17.1 15.7–18.2 79.0 4.5
65 16.5 13.0 12.1–13.8 78.7 3.5 17.9 14.3 13.1–15.3 79.7 3.6
70 13.4 10.7 9.9–11.4 79.9 2.7 14.5 11.3 10.3–12.2 77.8 3.2
75 10.5 8.5 7.8–9.0 80.6 2.0 11.4 8.8 7.9–9.5 77.1 2.6
80 8.1 6.5 5.8–7.0 80.1 1.6 8.7 6.8 6.1–7.3 77.6 2.0
85 6.1 4.7 4.1–5.2 77.0 1.4 6.4 5.0 4.5–5.4 78.0 1.4
Males
60 17.5 14.7 13.4–15.6 84.0 2.8 19.4 16.7 14.6–17.9 86.1 2.7
65 14.3 12.0 10.8–12.8 83.7 2.3 16.0 13.8 12.0–14.9 86.5 2.2
70 11.5 9.7 8.8–10.4 84.6 1.8 12.8 10.9 9.3–11.8 85.0 1.9
75 9.1 7.9 7.1–8.3 86.5 1.2 10.1 8.3 6.9–9.1 82.0 1.8
80 7.0 6.1 5.4–6.5 87.3 0.9 7.7 6.3 5.3–7.0 82.4 1.4
85 5.4 4.8 4.1–5.1 88.3 0.6 5.7 4.5 3.8–5.0 78.9 1.2
Females
60 22.0 16.5 14.8–17.9 75.0 5.5 23.7 17.8 15.7–19.4 75.0 5.9
65 18.2 13.7 12.3–14.9 75.5 4.5 19.6 14.9 13.2–16.3 76.2 4.7
70 14.7 11.3 10.1–12.3 77.0 3.4 15.9 11.8 10.3–13.1 74.5 4.1
75 11.5 8.8 7.7–9.6 76.6 2.7 12.4 9.3 8.0–10.3 75.0 3.1
80 8.7 6.5 5.6–7.3 75.3 2.2 9.4 7.1 6.2–7.9 75.8 2.3
85 6.5 4.5 3.6–5.3 70.0 2.0 6.8 5.3 4.6–5.8 77.5 1.5
e Klugman J. Human
hese values indicate a favorable change in several social and economic factors, which may
have increased both TLE and life expectancy without depression.
he results support previous indings showing a higher prevalence of depression and
depressive symptoms among older women than among older men in developing countries, including Brazil3,4,20,32. A larger proportion of older women than older men in Sao Paulo have
depression and women can expect to live a higher proportion of their remaining lives with
depression than men. hese indings are consistent with previous research on life expectancy
and HLE, which has found that even though women live longer lives, they live more years with health problems such as disability, cognitive impairment, and mental health problems2.
his study has some limitations. First, the measure of depression prevalence difered from
the measure used in other studies. In this study, participants’ depressive symptoms were
reported using the GDS 15-item subscale, and we used a cutof score of 6. Other studies on the prevalence of depressive symptoms among Brazilians have used other measures, diferent cutof points, or alternative ways of dealing with item nonresponse, all of which inluence the
estimated prevalence rate. For example, our estimate was higher than a previous estimate of the depression rate for older adults in Sao Paulo from 2002-2004 (22.0% versus 13.0%)3; which
measured depression based on questions from the GDS-30 and the Center for Epidemiologic Studies Depression Scale (CES-D 10)17,33. he current results also difer from the original SABE
reports19, which used diferent procedures for handling item nonresponse. Finally, our results
were lower than the ones of a meta-analysis that reported a 26.0% prevalence of clinically
signiicant depressive symptoms among older community-dwelling adults in Brazil4.
A second limitation of the study is related to the data collection procedures for depressive symptoms; these symptoms were self-reported by those who were cognitively intact, but those with cognitive limitations (n = 198 in 2000 and n = 196 in 2010) failed to provide information on depressive symptoms. Although missing data could also be considered an important limitation, when we compared the characteristics of respondents with missing data and those
with no missing data (at baseline), only age difered signiicantly. In further analyses (results
not shown, but available upon request), we imputed data for those with missing information
on more than ive items. Imputed prevalence rates difered slightly from the rates used in the
study (21.2% versus 21.8% in 2000, respectively, and 21.7% versus 21.1% in 2010, respectively).
When imputed values were calculated separately by sex, diferences remained small, with all
imputed prevalence rates decreasing slightly, except the rate for women in 2010 (imputed rate was 25.9%, compared with the 25.2% rate used in the analyses). Even when separated by sex,
all imputed values were within the conidence intervals presented in Table 2.
A third limitation of the study is that estimates of depression may be biased because we did not include respondents living in nursing homes at baseline and depression may be higher among this segment of the population. However, this population in Brazil is small – about 1.0% according to Camarano and Kanso10 and 0.5% according to the SABE survey; therefore, this bias is likely trivial.
Other limitations originate from the application of the Sullivan method. We employed the Sullivan method because the goal of the article was to evaluate trends over time in life expectancy with and without depression. However, we used a stationary population approach to interpret the estimates produced via Sullivan method, and thus results should be interpreted with caution because the data are dependent on past conditions of the population22. Another potential issue related to using mortality rates from life tables is that
we did not formally account for the association between depression and increased mortality risk25. An alternative to the current analytical strategy would be to incorporate mortality
by health state and health transitions (i.e., incidence and recovery) using multistate life tables21. However, as shown in other settings, longitudinal surveys tend to underestimate
deaths as a result of the omission of respondents living in nursing homes in the baseline data as well as the potential of missing deaths in follow-up waves18,29. Finally, due to the lack of
study relect only the experiences of older adults in Brazil’s largest city, which may difer
from the experiences of older people throughout the Country.
Life expectancy without depression increased from 2000 to 2010 in Sao Paulo. Further improvements in quality of life can be obtained by early diagnosis and treatment of individuals with depression. However, the underdiagnosis of depression is a serious health problem, particularly in countries such as Brazil in which many residents lack adequate access to healthcare services for diagnosis and treatment. In order to expand services and healthcare, the number of mental health care workers must increase, and access to care must improve. Given the limited resources available, community and primary health workers can be trained to perform some roles under the supervision of specialists. Some authors have called for “task shifting” programs in which nonspecialists can complete certain tasks, such as identifying cases, providing referrals, supporting medication adherence, and delivering psychosocial treatment13,15. Given the associations between mental health conditions and other health
conditions, integrating mental health care into general health care is another change that has the potential to improve outcomes13. In Brazil, the current Política Nacional de Saúde do Idoso
(PNSI – National Policy for the Health of the Elderly) seeks to improve older adults’ health and well-being through improved immunization and distribution of medication23. A more
diverse and larger workforce is also needed to deliver interventions aimed at modifying behaviors – such as physical exercise – that can improve the health outcomes of individuals with depressive symptoms5.
Finally, other innovations may involve using technology to improve medical care by expanding training and improving access to care and treatment in Brazil. Ultimately, empowering Brazilian individuals with depression and their families can lead to additional advocacy for better services, improved social inclusion, and reduced stigma13. All of these changes have the
potential to facilitate early diagnosis, better treatment, and increased healthy life expectancy.
REFERENCES
1. Almeida OP, Almeida SA. Coniabilidade da versão brasileira da Escala de Depressão em Geriatria (GDS) versão reduzida. Arq Neuropsiquiatr. 1999;57(2B):421-6. DOI:10.1590/S0004-282X1999000300013
2. Andrade FC, Corona LP, Lebrão ML, Duarte YA. Life expectancy with and without cognitive impairment among Brazilian older adults. Arch Gerontol Geriatr. 2014;58(2):219-25. DOI:10.1016/j.archger.2013.10.007
3. Barcelos-Ferreira R, Pinto Junior JA, Nakano EY, Steffens DC, Litvoc J, Bottino CMC. Clinically signiicant depressive symptoms and associated factors in community elderly subjects from Sao Paulo, Brazil. Am J Ger Psychiatry. 2009;17(7):582-90. DOI:10.1097/JGP.0b013e3181a76ddc
4. Barcelos-Ferreira R, Izbicki R, Steffens DC, Bottino C. Depressive morbidity and gender in community-dwelling Brazilian elderly: systematic review and meta-analysis. Int Psychogeriatr. 2010;22(05):712-26. DOI:10.1017/S1041610210000463
5. Barcelos-Ferreira R, Yoshio Nakano E, Steffens DC, Bottino CMC. Quality of life and physical activity associated to lower prevalence of depression in community-dwelling elderly subjects from Sao Paulo. J Affect Disord. 2013;150(2):616-22. DOI:10.1016/j.jad.2013.02.024
6. Barendregt JJ. Incidence- and prevalence-based SMPHs: making the twain meet. In: Murray CJL, Salomon JA, Mathers CD, Lopez AD, editors. Summary measures of population health: concepts, ethics, measurement and applications. Geneva: World Health Organization; 2002. p. 221-31.
7. Beekman AT, Penninx BW, Deeg DJ, Beurs E, Geerlings SW, Tilburg W. The impact of depression on the well being, disability and use of services in older adults: a longitudinal perspective. Acta Psychiatr Scand. 2002;105(1):20-7. DOI:10.1034/j.1600-0447.2002.10078.x
9. Bruce ML, Seeman TE, Merrill SS, Blazer DG. The impact of depressive symptomatology on physical disability: MacArthur studies of successful aging. Am J Public Health. 1994;84(11):1796-9. DOI:10.2105/AJPH.84.11.1796
10. Camarano AA, Kanso S. As instituições de longa permanência para idosos no Brasil. Rev Bras Estud Popul. 2010;27(1):232-5. DOI:10.1590/S0102-30982010000100014
11. Castro-de-Araujo LFS, Barcelos-Ferreira R, Martins CB, Bottino C. Depressive morbidity among elderly individuals who are hospitalized, reside at long-term care facilities, and are under outpatient care in Brazil: a meta-analysis. Rev Bras Psiquiatr. 2013;35(2):201-7. DOI:10.1590/1516-4446-2012-0905
12. Chisholm D, Diehr P, Knapp M, Patrick D, Treglia M, Simon G et al. Depression status, medical comorbidity and resource costs: evidence from an international study of major depression in primary care (LIDO). Br J Psychiatry. 2003;183(2):121-31. DOI:10.1192/bjp.183.2.121
13. DeSilva M, Samele C, Saxena S, Patel V, Darzi A. Policy actions to achieve integrated community-based mental health services. Health Aff (Millwood). 2014;33(9):1595-602. DOI:10.1377/hlthaff.2014.0365
14. DiMatteo MR, Lepper HS, Croghan TW. Depression is a risk factor for noncompliance with medical treatment: meta-analysis of the effects of anxiety and depression on patient adherence. Arch Intern Med. 2000;160(14):2101-7. DOI:10.1001/archinte.160.14.2101
15. Fairburn CG, Patel V. The global dissemination of psychological treatments: a road map for research and practice. Perspectives. 2014;171(5):495-8. DOI:10.1176/appi.ajp.2013.13111546
16. Joffe H, Chang Y, Dhaliwal S, Hess R, Thurston R, Gold E et al. Lifetime history of depression and anxiety disorders as a predictor of quality of life in midlife women in the absence of current illness episodes. Arch Gen Psychiatry. 2012;69(5):484-92. DOI:10.1001/archgenpsychiatry.2011.1578
17. Kohout FJ, Berkman LF, Evans DA, Cornoni-Huntley J. Two shorter forms of the CES-D depression symptoms index. J Aging Health. 1993: 5:179-93. DOI: 10.1177/089826439300500202
18. Kristman V, Manno M, Côté P. Loss to follow-up in cohort studies: how much is too much? Eur J Epidemiol. 2004;19(8):751-60. DOI:10.1023/B:EJEP.0000036568.02655.f8
19. Lebrão ML, Laurenti R. Saúde, bem-estar e envelhecimento: o estudo SABE no município de São Paulo. Rev Bras Epidemiol. 2005;8(2):127-41. DOI:10.1590/S1415-790X2005000200005
20. Li D, Zhang D, Shao J, Qi X, Tian L. A meta-analysis of the prevalence of depressive symptoms in Chinese older adults. Arch Gerontol Geriatr. 2014;58(1):1-9.
DOI:10.1016/j.archger.2013.07.016
21. Lievre A, Alley D, Crimmins EM. Educational differentials in life expectancy with cognitive impairment among the elderly in the United States. J Aging Health. 2008;20(4):456-77. DOI:10.1177/0898264308315857
22. Mathers C. Health expectancies: an overview and critical appraisal. In: Murray C, Salomon JA, Mathers CD, Lopez AD, editors. Summary measures of population health: concepts, ethics, measurement and applications. Geneva: World Health Organization; 2002. p.177-204.
23. Miyata DF, Vagetti GC, Fanhani HR, Pereira JG, Andrade OG. Políticas e programas na atenção à saúde do idoso: um panorama nacional. Arq Cienc Saude Unipar. 2005;9(2):135-40.
24. Ownby RL, Crocco E, Acevedo A, John V, Loewenstein D. Depression and risk for Alzheimer disease: systematic review, meta-analysis, and metaregression analysis. Arch Gen Psychiatry. 2006;63(5):530-8. DOI:10.1001/archpsyc.63.5.530
25. Pan A, Sun Q, Okereke OI, Rexrode KM, Hu FB. Depression and risk of stroke morbidity and mortality: a meta-analysis and systematic review. JAMA. 2011;306(11):1241-9. DOI:10.1001/jama.2011.1282
26. Pao H, Fu H. Renewable energy, non-renewable energy and economic growth in Brazil. Renew Sustain Energy Rev. 2013;25:381-92. DOI:10.1016/j.rser.2013.05.004
27. Penninx BW, Leveille S, Ferrucci L, Eijk JT, Guralnik JM. Exploring the effect of depression on physical disability: longitudinal evidence from the established populations for epidemiologic studies of the elderly. Am J Public Health. 1999;89(9):1346-52. DOI:10.2105/AJPH.89.9.1346
29. Romero-Ortuno R, Fouweather T, Jagger C. Cross-national disparities in sex differences in life expectancy with and without frailty. Age Ageing. 2014;43(2):222-8. DOI:10.1093/ageing/aft115
30. Wancata J, Alexandrowicz R, Marquart B, Weiss M, Friedrich F. The criterion validity of the Geriatric Depression Scale: a systematic review. Acta Psychiatr Scand. 2006;114(6):398-410. DOI:10.1111/j.1600-0447.2006.00888.x
31. Win S, Parakh K, Eze-Nliam CM, Gottdiener JS, Kop WJ, Ziegelstein RC. Depressive symptoms, physical inactivity and risk of cardiovascular mortality in older adults: the Cardiovascular Health Study. Heart. 2011;97(6):500-5. DOI:10.1136/hrt.2010.209767
32. Yaka E, Keskinoglu P, Ucku R, Yener GG, Tunca Z. Prevalence and risk factors of
depression among community dwelling elderly. Arch Gerontol Geriatr. 2014;59(1):150-4. DOI:10.1016/j.archger.2014.03.014
33. Yesavage JA, Brink T, Rose TL, Lum O, Huang V, Adey M et al. Development and validation of a geriatric depression screening scale: a preliminary report. J Psychiatr Res. 1982;17(1):37-49. DOI:10.1016/0022-3956(82)90033-4
34. Zvolensky MJ, Bakhshaie J, Sheffer C, Perez A, Goodwin RD. Major depressive disorder and smoking relapse among adults in the United States: A 10-year, prospective investigation. Psychiatry Res. 2015;226(1):73-7. DOI:10.1016/j.psychres.2014.11.064
Funding: Fundação de Amparo à Pesquisa do Estado de São Paulo (FAPESP – Process 1999/05125 [wave 1]; 2005/54947-2 [wave 2]; 2009/53778-3 [wave 3]).