781
Copyright © 2014 by Academic Publishing House
Researcher
Published in the Russian Federation
European Researcher
Has been issued since 2010. ISSN 2219-8229
E-ISSN 2224-0136
Vol. 73, No. 4-2, pp. 781-804, 2014
DOI: 10.13187/issn.2219-8229 www.erjournal.ru
UDC 7
The Opinions of Russian School Students and Teachers about Media Violence
Alexander Fedorov
Anton Chekhov Taganrog State Pedagogical Institute, Russia Prof. Dr. (Pedagogy)
E-mail: mediashkola@rambler.ru
Abstract. The influence of media violence upon Russian teenagers is rather significant. About half the teenagers were positive about its demonstration: they enjoyed films, television shows, and computer games containing on-screen violence and they admired the characters - including "bad guys". A third of the teenagers were not sure about their opinion of on-screen violence, although they claimed to not be attracted by it. Just 18% of teenagers discuss and share their opinions with their parents. The influence of Russian schools upon the teenage relationship with on-screen violence is minimal.
The findings of our analysis:
- on the whole students are more tolerant than the teachers to screen violence (men outnumber women).
- entertainment is the leading factor attracting audiences to violent scenes in both groups; - watching violent programs in high spirits is for students three times oftener than for teachers;
- both students and teachers are most likely to watch and discuss violent scenes together with friends;
- students do not like watching violent programs alone;
- 1 out of 5 teachers is eager to watch violent content media with their students, 1 out of 3 teachers is ready to discuss it with the students;
- on the average, 1 in 10 students would like to share this activity with the teacher; - students talk about violence on the screen twice as much as teachers;
- 3 times more students than teachers reported that their aggressiveness increases after the violence seen on the screen;
- images of the screen violence linger in girls‘кwomen‘ mind longer than in boys‘к men‘ц - about half of the respondents reported that they remember scenes of violence for a long time;
- both the majority of students and teachers tend to believe that screen violence affects the increase of crime in society;
- one third of teachers and students agree that most violent media texts should be banned; - quarter of teachers and students think it is necessary to prohibit all violence on the screen; - 5 times more students (vs. teachers) think things should remain like they are now, and 1 in 10 pupils consider that even more violence can be shown.
782
Introduction.
Violence is an increasing problem in modern society. Most Western research concerning violence in the media suggests that there is a connection between presentation of violence in the media and violence in society (Federman, 1997; Cantor, 2000; Potter, 1999; 2003; Slaby, 2002 and others).
The report of the ―National юommission on the юauses and Prevention of Violence‖ noted the ―weakness of the network codesз particularly the lack of effective sanctions and the absence of control over the number of violent programs. Legislative hearing in the Congress and Senate of the United States Government heard repeated demand for the reduction of televised violence‖ гGerbnerз мфууз pйфдй ьmerican Psychological ьssociation гьPьд concludedх ―there is absolutely no doubt that those who are heavy viewers of this violence demonstrate increased acceptance of aggressive attitudes and increased aggressive behavior‖ гWilsonз эйJй and othersз мффуз pймсдй ―There certainly appear to be correlation between the rise of violence depicted in media and the rise of violent acts and crimes committed by juveniles in this country. The United States has the most violent adolescent population out of all нл developed nations on Earth‖ гюantorз нлллз pй фмдй ―We uncovered a dramatic correlation between media violence and crime. When asked what their favorite movie was, the same fifty one percent (51%) of adolescents who committed violent crimes claimed that their favorite movie contained violence‖ гюantorз нлллз pй фмдй
It is clear that the problem exists in Russian and ьmerican society as wellй ―Today youth may be regularly exposed to: violent programming on broadcast TV, cable TV, and satellite TV; violent programming in motion pictures and on videocassettes, digital video disks, and Internet websites; violent audio programming delivered through traditional radios, Walkman radios, compact disk players, and Internet websites; violent interactive video games delivered through television monitors, computer monitors, portable devices, Internet web sites, and arcade games; violent toys, gamesз and other devices directly related to violent media programming‖ гSlabyз нллнз pйоммдй
I agree with JйGoldstein‘s definition of media violence productionх ―We regard violent entertainment as descriptions or images of fighting, bloodshed, war, and gunplay produced for the purpose of entertainment, recreation, or leisure. Violent entertainment includes murder and horror stories; comic books, television programs, films, and cartoons depicting war or fighting; video games with martial-arts and military themes; toy weapons and military materiel; and aggressive spectator sportsз like boxing and wrestling‖ гGoldsteinз мффуз pйндй
The scientists concludedх ―media violence can teach adolescents social scripts (approaches to solving social problems) about violence; it can create and maintain attitudes is society that condone violence; constant exposure to media violence can lead to emotional desensitization in regard to violence in real life; the social, political, and economic roots of violence are rarely exploredз giving the impression that violence is mainly an interpersonal issue‖ гSlabyз нллнз p.310).
P.David (Secretary of the Committee on the Rights of the Child, Office of the UN High Commissioner for Human Rights) writes: The theme of the child and media is typically a challenging one as it closely combines three major aspects of children‘s rightsх access to provisionз protection and participation. This multidimensional nature of the right to information is generously recognized by the Convention on the Rights of the Child in its article 17, which explicitly refers to many other provisions recognized by this human rights treaty. Therefore, a decade after the adoption of the Convention by the UN General ьssemblyз the child‘s right to information remains one of the most complex provisions to be implemented by states (David, 1999, p. 31)
783
Western scientists have researched the theme ―юhildren and Violence on the Screen‖ but this theme is new and original to the modern Russian sociocultural situation. Consequently, Russian science currently conducts little research on this theme. For example, we do have sociological research results from Dr. K.Tarasov (Moscow) who tested Russian pupils on the subject of ―Violence on the Screen‖й He writes thatх ―a questionnaire surveyз conducted by the Research Institute of Cinema Art among 510 students from 9th to 11th grades (14-17 years old) of 30 Moscow schools (52 classes) in late 1995, showed that with respect to violent films the young viewers formed three groupsй The first гррад comprises ―hyperactive‖ consumers of violent fareй Half or more of the films they had seen in theatres or on television and video during four weeks prior to the survey contained violenceй The second group гммад includes ―active‖ adherents to aggressive filmsй Violence is included in one-third of their chosen film repertoire. The third group (24%) constitutes young people with ―moderate‖ attachment to movie mayhem‖(Tarasov, 2000, p.5).
The Russian situation is different from that of the West because throughout Russian media history scenes of violence on the screen have existed without strict censorship. My content analysis of all features films produced in Russia (1041 films) shows that 43% contain violent scenes. Completed content analysis of violence on Russian television during one week indicates that serious and graphic violence in news and so-called reality-programs (about murder, crime, and accidents) is aired around the clock. The analysis also shows that fiction series and films with serious and graphic violence are most often broadcast after 10 p.m., but also relatively frequently during prime time when children are watching.
I have surveyed 430 Russian students (age from 16 to 17). The information I obtained helped me:
-take into consideration the real preferences of teenagers;
-pay attention to concrete films, television programs, genres, and themes that are popular and thus have maximum moral and psychological influence;
-quantify the students who are attracted and repulsed by scenes of violence on the screen; -reveal main factors attracting teenagers to scenes of violence on the screen (entertaining function, function of identification, compensatory function, function of recreation, professional directorship, outstanding acting, outstanding special effects, etc.). The results are necessary for comparison with written papers and discussions in order to state the self-evaluation of the audience‘s preferences and real motives as revealed in the course of the full researchц
-reveal main reasons to dislike scenes of violence on the screen;
-learn about teenage enthusiasm for acting in a violent scene in the media. The results confirmed the students' answers concerning their positive or negative attitudes towards violence on the screen; and
-determine the opinion of teenagers concerning reasons for violence and aggression in society, the influence of violence on the screen upon the increase of crime, and the prohibition of violent scenes from the screen (with reference to their future children).
To sum up the analysis of this test one may conclude that the influence of violence on the screen on Russian teenagers is rather perceptible. About a half of the teenagers are positive about its demonstration. They like films, television shows, and computer games containing scenes of violence, and they like violent characters (including "bad guys"). One-third of the teenagers claimed that they are not attracted by the violence on the screen. Only 18% of teenagers discuss and share their opinions with their parents. Teenagers practically never include teachers as interlocutors for their screen preferences. Therefore the influence of Russian schools upon the relationship between teenagers and violence on the screen is, unfortunately, zero.
This cannot help but evoke alarm, since violence on the screen penetrates into Russian society more and more since 1990. It can be safely said that in Russia the Convention of Child's Rights concerning mass media is not working. In spite of the efforts of some teacher-enthusiasts, the media education at schools, colleges, and universities remains relatively poor. Russian students have developed very little understanding of the impact of violence upon themselves.
Russian Teenagers and Media Violence
784
430 sixteen and seventeen year old students of Taganrog's high schools and of the first course of Taganrog State Pedagogical Institute.
I used a multiple choice г―closed‖д form of survey because most teens, as a rule, are not able to state their points of view concerning media preferences precisely or quicklyй ьlsoз a ―closed‖ form test is easier and takes less time to complete. The test was conditionally divided into 3 parts:
1.Violence on the Screen: Teenage Orientations and Preferences;
2.Teenage Attitude toward Violence on the Screen: Reasons and Results; and 3.Teenagers and Violence on the Screen: Situational Tests.
Part 1. Violence on the Screen: Teenage Orientations and Preferences
1. Teenagers were given a list of forty Russian and foreign films, about half of them popular comedies and melodramas containing no violence. In the other half (thrillers, horror films, criminal and war epics), violence often played a major role. Since these films are often shown on television and are available on video, we can suggest that teenagers who are attracted to violence will prefer this latter, more violent half;
2. By analogy to this, I compiled a list of popular computer games among youth. I assumed that a teenager who favored games filled with fights and shooting (Doom) would not mind seeing violence on the screen;
3. After an indirect clarification of teenage attitude towards violence on the screen, I proceeded to the direct questions 3, 4, and 5. Through these questions it was possible to learn which films, television shows, and computer games of which countries, genres, and themes contained the most violence. From a sample of forty countries, many African, Asian, and South American countries were absent because their film or television industries did not reach the Russian market.
4. Having learned the audience‘s knowledge of which genre-theme components most often accompany scenes of violence, I continued with questions 6, 7, and 8 concerning the most popular movie characters among teenagers. For that purpose, the film list was solely violent productions. Were a teenager to prefer American thrillers and horror films, then among his favorite characters would be such heroes as the Terminator or Rambo;
5. By knowing a teenager‘s favorite charactersз we supposed that among the most likable character traits were strength, courage, and self-confidence (n 7). A number of students who made such a choice would like to resemble their hero in behavior and world outlook (n 8).
Part 2. Teenage Attitude toward Violence on the Screen: Reasons and Results 1. Through direct questioning we quantified the students who were attracted and not attracted to scenes of violence on the screen. If in the first part of the test teenagers preferred violent films, violent computer/video games, and violent protagonists (such as the Terminator or Rambo), then the test-taker‘s answer to this question would be positiveй
2. With reference to the preceding query‘s answerз teenagers chose factors that attracted or repelled them to the scenes of violence. One may presume that the entertainment value of a show or recreation would attract, and that fear of blood, violence, and crime would repel.
3. Proceeding from numerous observations in cinema theaters, we assumed that teenagers attracted to violence on the screen would frequent cinemas together with friends (three or more).
4. We then asked questions concerning motives for watching violence on the screen and concerning the psychological state afterwards. Given the psychology of teenagers (aspiration to self-affirmation, appearing mature, etc.) one could not expect a majority of the teenage audience to confess that they become sad or bitter upon witnessing violence on the screen. More often, teenagers emphasized that it does not influence them.
5. It is natural that teenagers claim to not remember scenes of violence nor to discuss them, but if they do discuss them they prefer to do so among friends. The psychology of a teenager does not allow him to consider his parents as interlocutors.
Part 3. Teenagers and Violence on the Screen: Situational Tests
In this part of the test, teenagers faced hypothetical game situations. Some of the questions may seem trivial - for instance, a question about naming pets. Yet these were purposefully included so as to relax the teenagers between more serious questions.
785
only in his imagination, just one film at his disposal for a long period of time may somehow change his preferences. That is, a person who prefers watching violent films would not necessarily choose to keep Rambo on a desert island.
2. The second question concerned a comic situation with choosing names for pets. This question provided an opportunity to indirectly explore the degree of popularity of movie characters among teenagers.
3. The third question directly asked teenagers' reactions to scenes of violence on the screen. This question intentionally repeated a question in Part 2 because it was presumed that teenagers who liked scenes of violence on the screen would not switch off the television when violence was shown.
4. Such is the case with the fourth question, in which a teenager was asked about his interest in acting in scenes of violence on the screen. It was presumed that a teenager who disapproved of violence on the screen would not act in a violent film production.
5. The fifth question generated a discussion of reasons for and influence of aggression and violence in society, as well as and the prohibition of violence on the screen. This question was also aimed to affirm the answers to previous parts of the test: a person who enjoyed watching scenes of violence on the screen, probably would not point at such violence as the reason for increasing crime in real-life, nor would be pay attention to its influence nor wouldn't demand censorship).
6. The last question asked the age at which children should be allowed to watch scenes of violence on the screen. Teenagers who enjoy violence on the screen chose the lowest age possible or were against any prohibitions whatever.
The Main Aims of the Test
1. To determine the degree of popularity of violent screen productions (films, television shows, and computer games). The obtained information helped me to take into consideration the real preferences of teenagers and to pay attention to the films, genres, and themes that are popular and thus have a maximum moral and psychological influence.
2. To determine to what extent teenagers associate productions of different genres, countries, and themes with violence on the screen. The results I obtained explained the teenage approach to mass media culture and the ability to distinguish between different genres and themes. 3. To reveal the primary traits of popular movie characters - including those whom they would like to resemble. I was careful to take into consideration new fashions and trends and to pay attention to popular films and heroes.
4. To quantify the students who are attracted to scenes of violence on the screen. This number should coincide with the number of students who prefer heroes of bloody thrillers and horror films.
5. To reveal the main factors attracting teenagers to scenes of violence on the screen, such as entertaining function, function of identification, compensatory function, function of recreation, professional directorship, outstanding acting, and outstanding special effects. The results are necessary to compare with written papers and discussions in order to know the audience‘s self-evaluation of its preferences and real motives.
6. To establish the motives for disliking of scenes of violence on the screen. (This is also important for the special student course.)
7. To find out with whom teenagers prefer to watch scenes of violence on the screen, and to ascertain the communicative results and consequences of such shows. This is important for a comparison of the audience's self-evaluation with the results of the test on the whole.
8. To find out to how stable students‘ current media preferences regarding violence areй 9. To find out the type of teenage reaction to scenes of violence on the screen. The results confirmed students‘ answers to the main question of Part н of the test concerning their attitudes towards on-screen violence.
10. To learn about the imaginary readiness of teenagers to act in a violent scene in a film. The results confirmed students' answers concerning their attitudes towards on-screen violence.
786
The Results of the Test “Russian Teenagers and Violence on the Screen” (430 people were questioned, aged 16 to 17 years)
Part 1. Violence on the screen: teenage orientations and preferences
We may conclude that on-screen violence is not so popular (for students) as screen comedies. The same situation took place concerning teenage attitude toward violent computer games. Peaceful Tetris took first place (44.65% picked it) and didn't contain any violent scenes. Doom, on the other hand, was based on violence and enjoyed half Tetris‟ popularity (25.11%). (We must point out that in Russia not every family has a computer, so teenage access to computer games is still rather limited.)
An analysis suggested that teenagers know which countries produce the most violent screen productions. The United State and Hong Kong were the primary production centers. Teenagers pointed out that violence on the screen in the 1990's also became common in Russian media. It is notable that no European country (except Italy, which placed 5th with 11.39% of the votes) was identified by teenagers as a leader in on-screen violence. This may be explained not only by the "peaceful" character of European screen production, but also by the absence of Russian contact with productions from European countries (except Italy and France).
Russian teenagers distinguish well the genres and themes of screen violence: action, drama, horror, criminal, war, science-fiction, psychological, etc. Among the character traits teenagers admired were "firmness" (41.62%), "intellect" (40.23%), "power" (36.27%), and "cruelty" (19.53%). ЭKindnessЭ only gathered млйпса of teenagers‘ votesй To my mindз this supports the idea of a negative influence of on-screen violence upon the young audience.
Teenagers would like to emulate the violence movie characters in world outlook (19.76%), behavior (12.32%), attire (9.69%), job (8.60%), and attitude (7.99%). A low percentage of teenagers chose to answer this question because many teenagers considered this question to be childish and "just for kids". On the margins of some tests was written, "I'm too old to imitate anyone".
Part 2. Teenage attitude to on-screen violence: reasons and results
48.14% of the teenagers were attracted to violence on the screen, 28.84% had a negative attitude toward the violence, and 23.02% were not sure. A analysis proves that the self-evaluation of teenagers corresponds to their real screen preferences. None of the violent films or computer games couldn‘t overcomes the limit of пла popularityз that is screen production of such kind was chosen by 48% of teenagers who are supporters of screen violence according to the statistics of the table 9.
The test revealed factors that influence teenage perception and estimation of on-screen violence. Among the factors that attracted teenagers were: entertaining function, acting, direction, recreation, informative function, special effects, and action dynamics. We must also bear in mind that a high rating of the actor's and director's skill does not demonstrate that all teenagers who made such a choice are good judges of a film‘s artistic valueй Quite often a teenager who were entertained by a film also claimed that the performance and directors' work was good.
Teenagers prefer to watch television and discuss together with their friends. 22.79% of the audience discuss it regularly. Such is the case with on-screen violence. Parents acted as interlocutors in both cases with 17% of the teenagers. Among the reasons for watching on-screen violence teenagers rated ―nothing else to do‖ as an ―ok‖ гснйонадз ―good‖ гнсйнтад and ―bad‖ (11.39%) mood. The majority of them claimed that their psychological states did not change, and only a small number of the students (4%-5%) confessed that they became aggressive or bitter. The majority of the audience (65%) while assuring that their psychological states remained the same, were not inclined to remember the on-screen violence, and just 6.27% of teenagers pointed out that screen violence stayed in their memories for a long time.
Part 3. Teenagers and violence on the screen. the results of the situations' tests. Despite liking on-screen violence, not all of the 48.14% teenagers would to go to a desert island with only a videotape like The Silence of the Lambs. The first place in screen preferences was taken again by the comedies. The number of teenagers who continue to watch a film despite on-screen violence should correspond to the number of students who answered "yes" to the question of attraction to violence. The amount of teenagers who dislike on-screen violence is 30%.
787
violence and absolutely would not act in violent scenes. It is my opinion that to a large degree the economic situation in Russia explains these results.
As for the reasons behind violence and aggression in society, teenagers claimed that violence is in the nature of all humans and also mentioned psychological diseases. On-screen violence was mentioned as a cause of real-life violence only by 3.25% of teenagers. The data confirm this orientation of the audience: 33.58% believed that only psychologically sick people can possibly be influenced by on-screen violence. 33.02% considered this influence unimportant, and 14.18% of teenagers think that showing on-screen violence leads to an increase in real-life violence. Such a scattered spectrum of view points can be explained perhaps by the fact that the attitude of teenagers toward on-screen violence is not yet final, and that this is why some of them sometimes answer differently to similar questions.
12.79% of teenagers wanted violence to be proscribed from the screen and 20.23% thought that only the most cruel films and television shows should be banned. 33.02% of teenagers wanted some kind of restriction for on-screen violence. Just 3.02% of teenagers desired more on-screen violence in Russia.
Assuming the role of a censor, teenagers considered it possible to ban on-screen violence for all children (11.16%), to not let children under 10 watch it (5.11%), and to not let children under 15 watch on-screen violence (3.95%). Acting as parents they became much stricter: 38.37% did not want their children to watch violence until they were 10, and 25.34% did not want their children to watch violence until they were 15. 35.58% of teenagers were ready to let their children watch on-screen violence at any age.
Computer/Video Games: Media Violence and Russian Teenager Audience
Based on unpublished research of J.L.Sherry, L.Bensley & J.Van Eenwyk created the conclusion about the main video games/children theories:
-―Firstз psychological social learning theory suggest that at least some aggression is learned by observing and then imitating a model who acts aggressively. Aggressive video game characters, similar to TV charactersз might serve as models for aggressive behaviorй г…д according to this theory, observing and then producing violence in a video game would be expected to increase aggression.
-Second, an arousal theory predicts that if the video game player has an aggressive disposition or is angered, then playing an arousing video game might cause increased aggression due to a generalized increase in energy and intensity. According to this theory, violent video games would be expected to increase aggression only in the presence of anger from some other cause.
-Third, a cognitive theory of priming suggests that violent video games will activate related cognitive structures, making it more likely that other incoming information would be processed in an ―aggression‖ frameworkз possibly increasing aggressive behaviorй For exampleз according to this theory, someone for whom thoughts of aggression have been evoked might be more likely to interpret an ambiguous behavior as aggressive and respond accordingly.
-Fourth, catharsis theory suggest that violent video games can provide a safe outlet for aggressive thoughts and feelings. Fifth, drive-reduction theory suggest, similar to catharsis theory, that violent video games may be useful in managing aggression. According to this theory, highly stressed or frustrated individuals may play violent video games in order to re-establish emotional equilibriumз thus reducing ―real-life‖ aggressive behaviorй
Integrative model based on the notion that a combination of priming and arousal effect best account for greater aggression effects in the short term, which weaken as initial arousal wears off (Bensley, Van Eenwyk, 2000, p.4).
Video games are relatively recent invention, being first introduced in the мфтлsй эut ―in a мффс survey of teenagersз суа of boys and ола of girls included ―playing video games‖ among their non-school activities г…д both boys and girls favor games with violent contentз with boys preferring games involving human violenceз and girls preferring fantasy or cartoon violence‖гэensleyз Van Eenwyk, 2000, p.3). We can find the same conclusion in the work of E.F. Provenzo (Provenzo, 1991): 40 of 47 most popular video games in 1988 included violence as a major theme.
788
adults‖ гэensleyз Lйз Van Eenwykз Jйз нлллз pйнтдй However I agree with Jй Goldstein – some ―players who like video games with actionкadventure or martial-arts themes, for example, are not necessarily attracted by the violence. These games have other features that appeal to players – their engaging fantasyз challengeз and simulationз scorekeepingз feedbackз graphicsз and sound effects‖ (Goldstein, 1998, p.213).
J. Goldstein presents the reasons for play with war/violence toys: Biological/Physiological (to discharge energyц to achieve a desired level of arousalкsimulationкexcitementц ‖hard-wired‖ tendency to practice adult skills and roles); Psychological ( to engage in fantasy/imaginative play; to experience ―flow‖ц in response to primingкsalience of violenceц to come to terms with violenceз war, death; to achieve a desired emotional state; to experience and express intense emotions; to see justice enacted; to control and resolve conflict satisfactorily; to practice strategic planning; to set goals and determine effective means for accomplishing them; to gain a sense of mastery; to experience intimacy;
Social/Cultural (direct modeling by peers or family; indirect modeling: influences of media, marketing; to belong to a group; to exclude oneself from a (negative reference) group (e.g. parents, girls, boys who disapprove of these games); rewards and encouragement for such play; salience within a culture of war, violence; to wield power; to affect others; to elicit a predictable reaction from parents/teachers; to sample a variety of adult roles; as a reflection of cultural values – dominance, aggression, and assertion (Goldstein, 1998, p.61).
Of course all these tendencies are very typical and for Russian children audience.
Ten years ago, Russian children spent much of their time with TV and video. They watched American blockbusters. There are no deficit American films in modern Russia. The different television channels show from morning to night show dozens of foreign thrillers, melodramas, comedies and horrors. Today, Russian children from low-paid families spend many hours in computer clubs, where they play video games for a relatively small charge. Children from richer families play these games at home.
But what games do they play?
I undertook a special content analysis of 87 video games which circulate in Russian computer clubs. These are the results of the analysis:
1) practically all video games available for visitors to computer clubs (the visitors are nearly all teenagers) contain interactive criminal, military, fantastic and sporting (for instance, car races) subjects;
2) only 17.24% (15 of 87) of video games did not contain any scenes of violence; 3) 55.17% (48 of 87) of video games contained episodes of various murders;
4) 39.08% (34 of 87) of video games contained many elements of fights and different degrees of cruelty;
5) 35.63% (31 of 87) of video games included images of catastrophes;
6) As a whole, 82.75% (72 of 87) of video games contained at least one type of screen violence (murders, fights, or catastrophes). Many games presented the violence in several types and combinations of fights, murders, tortures, catastrophes, etc.;
7) The primitive video games г―shoot‖-―fire‖д are the basic repertoire of computer clubsй The more complex games - so-called "strategies" and "quests" - are less common.
789
Table 1. The age range of schoolchildren who play video games in the computer clubs
№ Age of
computer/video game users
Number of schoolchildren of
this age
Percent of schoolchildren of
this age
1 17 years 3 3.94%
2 16 years 8 10.52%
3 15 years 10 13.15%
4 14 years 10 13.15%
5 13 years 11 14.47%
6 12 years 10 13.15%
7 11 years 6 7.89%
8 10 years 9 11.84%
9 9 years 4 5.26%
10 8 years 4 5.26%
11 7 years 1 1.31%
An analysis of Table 1 shows that the teenagers from 12 to 15 years of age are the main visitors to computer clubs. The younger children (from 7 to 9 years of age), usually living under more parental supervision, form the minority (from 1 to 5 percent). Practically all visitors to computer clubs play games containing scenes of violence (83%).
]
Table 2. Themes of video games attractive to schoolchildren
№ Age of video game users:
Number of schoolchildren this age and percent
schoolchildren this age:
Number of popular video games containing elements of
violence:
Number of popular video games not containing without elements of violence:
1 17 years 3 (3.94%) 5 3
2 16 years 8 (10.52%) 11 8
3 15 years 10 (13.15%) 13 11
4 14 years 10 (13.15%) 16 6
5 13 years 11 (14.47%) 17 10
6 12 years 10 (13.15%) 14 7
7 11 years 6 (7.89%) 10 3
8 10 years 9 (11.84%) 14 9
9 9 years 4 (5.26%) 7 4
10 8 years 4 (5.26%) 4 4
11 7 years 1 (1.31%) 2 1
Total: 76 113 66
An analysis of Table 2 shows that the number of popular video games containing elements of violence, is higher than the number of the video games not containing elements of violence in all age groups. Moreover, children from 11 to 14 years of age prefer video games with murders, fights and other hard elements of violence).
Undoubtedlyз the problem of violent computer games‘ influence on shaping teenage consciousness can be not considered simple. To play violent video games and to understand real-life violence are quite different.
Russian teachers and Media Violence
790
problem. 57 secondary school teachers took part in the survey. The gender and age differentiation is shown in Table 3.
Table 3. The number of the teachers questioned, their age and gender
Age groups:
Number of teachers
Number of teachers (%)
Number of
women teachers:
Number of men teachers:
21-30 10 17,54 7 3
31-40 12 21,05 8 4
41-50 11 19,30 7 4
51-60 12 21,05 7 5
61-70 12 21,05 10 2
Total: 57 100,00 39 18
Table 4 gives us a general idea of the teachers‘ attitude towards violence in mediaй
TableЫпйЫTheЫteachers’ЫattitudeЫtowardsЫscreenЫviolence
Teachers’Ы age/gender
Number of teachers( in %) who find themselves drawn to the scenes of violence on the screen
Number of teachers (in %) who are repelled by the scenes of violence
Number of teachers (in %) whose
opinion is
ambiguous
21-30 /total 10,00 50,00 40,00
21-30 /male 0,00 33,33 66,67
21-30 /female 14,28 57,14 28,57
31-40/total 25,00 58,33 16,67
21-30/male 25,00 50,00 25,00
21-30/female 25,00 62,50 12,50
41-50/total 0,00 81,82 18,18
41-50/male 0,00 75,00 25,00
41-50/female 0,00 85,71 14,28
51-60/total 8,33 75,00 16,67
51-60/male 20,00 60,00 20,00
51-60/female 0,00 85,71 14,28
61-70/total 8,33 83,33 8,33
61-70/male 0,00 100,00 0,00
61-70/female 10,00 80,00 10,00
All age
groups/Total
10,17 70,17 19,30
All age groups/male
11,11 61,11 27,78
All age
groups/female
10,26 74,36 15,38
If we take a look at the total numbers, according to them, the number of teachers who are fascinated by the scenes of violence on the screen, is slightly over 10 per cent, while the number of those who are repelled by the screen violence is seven times more - 74%.
791
people who are against it (58%). In the age group of 21-30 the voices are divided evenly- 50% to 50%.
The gender analysis of the Table 4 data shows that on the whole, women teachers are less inclined to watch violent scenes, although in some age groups (e.g. from 21 to 30 years old) the number goes up to мпай Soз the ―pros‖ of the screen violence are more often to be found under the age of 40, and their number is slightly more among men (although to my mind, the difference in 1% cannot be considered as a significant).
Compare to the similar study among teenagers: there were 17% of the violent programs fans, 49% of the adversaries of it. Thus, although the teachers in general turned out to be more ―peaceful‖ compared to their pupilsз the gap between their preferences is not that bigз as it seems and is proclaimed by some teachers. It is in fact just 7% (17% for students and 10% for teachers). However there are much more people who resent screen violence among teachers (by 25% more than among students), which sounds rather optimistic.
Table 5. Factors attracting teachers to screen violence
Age/ gender Entert ainme nt Identifi cation Inform ation Compe nsatory Recreat ion Dynamic s/speed of action Professio nal directing Outstan ding acting Outstan ding special effects Number of teachers (%) who have chosen this answer
21-30 /total
3 30,00
60,00 20,00 0,00 20,00 20,00 20,00 0,00 0,00
21-30/male
0 0,00
66,67 0,00 0,00 0,00 33,33 33,33 0,00 0,00
21-30/female
4 42,86
57,14 28,57 0,00 28,57 14,28 14,28 0,00 0,00
31-40/total
4 1,67
16,67 16,67 33,33 25,00 33,33 25,00 25,00 25,00
21-30/male
7 5,00
25,00 25,00 25,00 25,00 50,00 25,00 25,00 25,00
21-30/female
2 5,00
12,50 12,50 37,50 25,00 25,00 25,00 25,00 25,00
41-50/total
6 3,64
36,36 27,27 27,27 27,27 54,55 27,27 27,27 9,10
41-50/male
5 0,00
25,00 25,00 25,00 50,00 75,00 25,00 25,00 0,00
41-50/female
7 1,43
42,86 28,57 28,57 14,28 42,86 28,57 28,57 14,28
51-60/total
3 3,33
25,00 25,00 16,67 25,00 33,33 41,67 41,67 16,67
51-60/male
2 0,00
20,00 40,00 20,00 20,00 60,00 40,00 40,00 20,00
51-60/female
4 2,86
28,57 14,28 14,28 28,57 14,28 42,86 42,86 14,28
61-70/total
3 3,33
33,33 41,67 16,67 8,33 25,00 33,33 25,00 25,00
61-70/male
0 3,33
50,00 50,00 0,00 0,00 50,00 50,00 50,00 50,00
61-70/female
4 0,00
30,00 40,00 20,00 10,00 20,00 30,00 20,00 20,00
All age groups /Total
4 0,35
33,33 26,31 19,30 21,05 33,33 29,82 22,81 15,79
All age groups/ma le
3 3,33
33,33 27,78 16,67 22,22 55,55 33,33 27,78 16,67
All age groups/fe male
4 5,59
792
These data show that the main appealing factor is entertainment (40%). Other factors (Identification Factor; Information Factor; Recreation Factor; Dynamics of Action; Professional Directing; Outstanding Acting; Special Effects) got the ratings from 20 to 33%. Gender differences on this level of general results are not significant, the main one being the bigger percentage of men teachers (55%) compared to women teachers (28%) who lay emphasis on the dynamics of action. There are some differentiations of opinions inside the age groups; however the small number of teachers within one age group (10-12 people) does not allow us to draw any justifiable conclusions.
Entertainment was the leading factor in students‘ motives for watching violenceз tooй эut in contradistinction to teachers, pupils did not attribute much importance to the skills of the director (2%), information factor (7%) and compensatory (7%) factor of screen texts. Both groups- teachers and students agree on the main point- that entertainment is still the leading factor drawing people to media violence.
Table 6. Reasons for resentment against screen violence
age/ gender Aversion to violence of any kind
Disgust towards seeing blood and tortured/ injured people
Avoiding to experience negative emotions
Belief that violence on the screen
increases violence in real life
Fear of violence of any kind
Number of teachers (in %)
21-30 /total 20,00 50,00 30,00 70,00 10,00
21-30/male 0,00 0,00 0,00 100,00 0,00
21-30/female 28,57 71,43 42,86 57,14 14,28
31-40/total 33,33 58,33 58,33 83,33 16,67
21-30/male 25,00 50,00 75,00 100,00 0,00
21-30/female 37,50 62,50 50,00 75,00 25,00
41-50/total 54,55 36,36 45,45 81,82 27,27
41-50/male 25,00 50,00 25,00 100,00 0,00
41-50/female 71,43 42,86 57,14 71,43 42,86
51-60/total 25,00 58,33 66,67 83,33 16,67
51-60/male 20,00 60,00 60,00 100,00 0,00
51-60/female 28,57 47,14 71,43 100,00 28,57
61-70/total 41,67 58,33 66,67 100,00 25,00
61-70/male 50,00 50,00 0,00 100,00 50,00
61-70/female 40,00 60,00 70,00 100,00 20,00
All age groups /Total
35,09 54,38 56,14 80,70 19,30
All age groups/male
22,22 44,44 50,00 88,89 5,55
All age groups/female
41,02 58,97 58,97 82,05 25,64
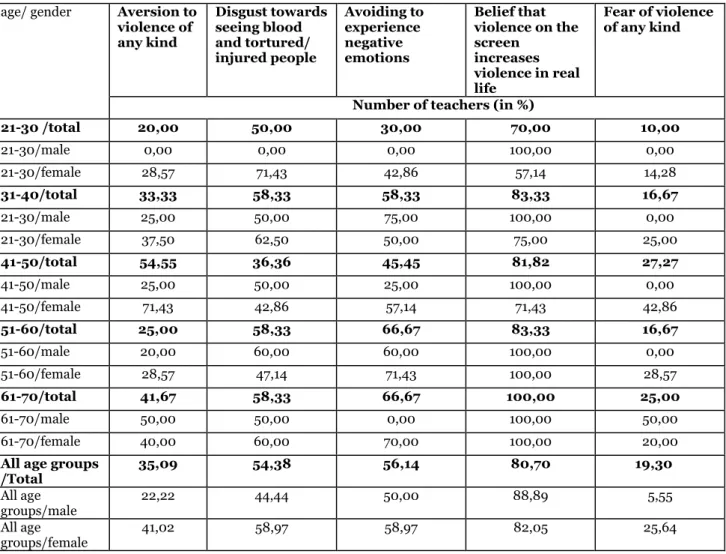
The analysis of Table 6 gives a rather clear vision of what is the most repulsive about scenes of violence for teachersй First of allз it‘s the conviction that screen violence does effect the growth of crimes in society (80%). Further on there are such factors as the aversion to images of blood, gore, graphic images of violence; unwillingness to experience disturbing emotions, and fear.
Maximum gender differences emerge in the question of fear of violence (25% of women and 5% of men), and resentment of any kind of violence (41% of women and 22% of men).
793
The comparison of the teachers‘ and students‘ opinions shows that the latter are more tolerable towards screen violence. Only 20% of students (compared to 80% of teachers) think that it affects the violence in society. Gore disgusts 25% of the students (54% of teachers). Unwillingness to experience unpleasant emotions is the reason for not-watching violent scenes for 18% of the students (56 % teachers), and resentment of any violence - 21% (35% of the teachers). The teachers‘ and students‘ percentage in the question of fear is about the sameй
Table 7. Whom do the teachers usually watch violent content programs with?
Teachers’Ы
age/gender
with
Alone Friends Girlfriend /Boyfriend /Spouse
Parents Students Children/
Grandchil dren
Others
Number of teachers (in %)
21-30 /total 40,00 60,00 50,00 10,00 0,00 0,00 0,00
21-30/male 66,67 66,67 33,33 0,00 0,00 0,00 0,00
21-30/female 28,57 57,14 57,14 14,28 0,00 0,00 0,00
31-40/total 25,00 75,00 66,67 25,00 25,00 16,67 0,00
21-30/male 50,00 100,00 50,00 25,00 50,00 25,00 0,00
21-30/female 12,50 62,50 75,00 25,00 12,50 12,50 0,00
41-50/total 36,36 72,73 45,45 18,18 36,36 36,36 18,18
41-50/male 50,00 50,00 50,00 25,00 25,00 50,00 50,00
41-50/female 28,57 85,71 42,86 14,28 42,86 28,57 0,00
51-60/total 41,67 58,33 75,00 0,00 16,67 33,33 16,67
51-60/male 60,00 80,00 100,00 0,00 20,00 40,00 0,00
51-60/female 28,57 42,86 47,14 0,00 28,57 42,86 0,00
61-70/total 33,33 83,33 83,33 0,00 16,67 50,00 0,00
61-70/male 50,00 100,00 100,00 0,00 0,00 50,00 0,00
61-70/female 30,00 80,00 80,00 0,00 20,00 50,00 0,00
All age groups /Total
35,09 70,17 64,91 10,53 21,05 29,82 3,51
All age groups/male
55,55 77,78 66,67 11,11 22,22 33,33 11,11
All age groups/female
25,64 66,67 64,10 10,26 20,51 28,20 0,00
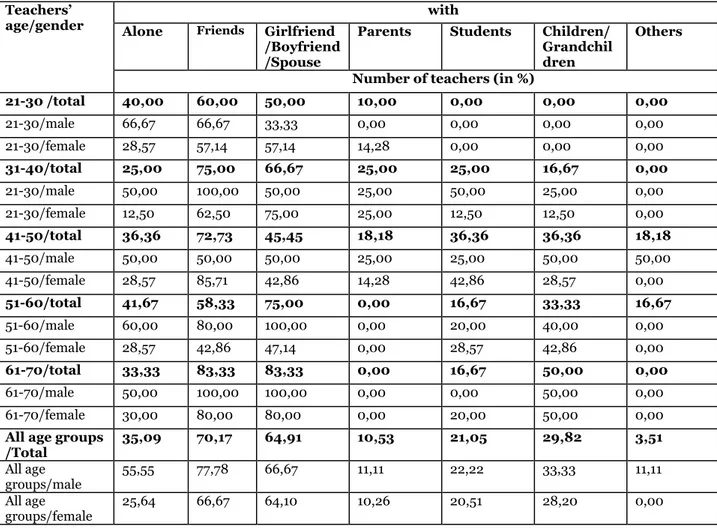
The data of Table 7 tell us that generally teachers watch programs/movies with violent content in the company of their partners/spouses (65-70%). Then in descending order follow: watching alone (35%), with children/grandchildren (30%), with students (21%), with parents (10%) and with other people (e.g. in a movie theater) (3%). Noticeably, men tend to watch violent programs by themselves twice more often as women. Not a single woman teacher reported unfamiliar people (e.g. in a cinema) as companions to watch movies with violent content.
Younger teachers in the age range of 21 to 30 do not watch scenes of violence with their children (logically considering their age) or students (0%). Elder teachers (61-70), on the contrary, are more oriented on watching them together with their children (the latter being adults of 30-40 years old).
юomparing students‘ answers with teachers‘ answersз we can notice the common grounds between these two groups: the most frequent company for watching violent programs are friends, both for the students and for the teachers. Moreover, only 10-12% of students watch them with parents, and 3-5% -with strangers.
794
watch it together with their teachers. Even in the age group of 7-8 year-olds, only 12% are eager to share this experience with their teacher.
Table 8. Typical mood before watching violent programs/ films
Teachers’Ы
age/gender high
spirits
low spirits irritated normal mood other reasons
Number of teachers in % who gave this reason:
21-30 /total 0,00 10,00 0,00 50,00 10,00
21-30/male 0,00 0,00 0,00 66,67 33,33
21-30/female 0,00 14,28 0,00 57,14 0,00
31-40/total 8,33 25,00 0,00 66,67 0,00
21-30/male 25,00 25,00 0,00 50,00 0,00
21-30/female 0,00 25,00 0,00 75,00 00,00
41-50/total 18,18 45,45 0,00 36,36 0,00
41-50/male 25,00 25,00 0,00 50,00 0,00
41-50/female 14,28 57,14 0,00 28,57 0,00
51-60/total 8,33 50,00 0,00 41,67 0,00
51-60/male 20,00 40,00 0,00 40,00 0,00
51-60/female 0,00 47,14 0,00 42,86 0,00
61-70/total 8,33 41,67 0,00 50,00 0,00
61-70/male 0,00 0,00 0,00 100,00 0,00
61-70/female 10,00 30,00 0,00 60,00 0,00
All age groups /Total
8,77 31,58 0,00 54,38 1,75
All age groups/male
16,67 22,22 0,00 55,55 5,55
All age groups/female
5,13 35,90 0,00 53,85 0,00
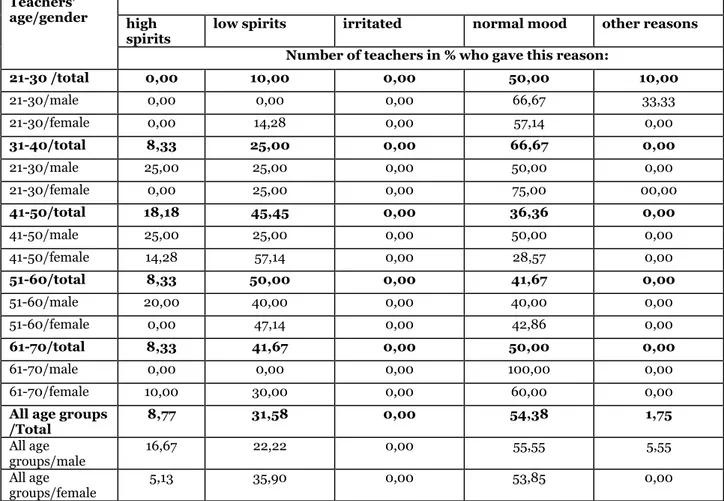
The analysis of data of Table 8 shows that teachers usually watch scenes of violence in a normal psychological state (54%). Low spirits follow with 31%, and good mood with 9%. It is worth mentioning that the gender difference is first of all revealed in the fact that men teachers more often watch media violence being in the good mood, while women teachers - in the bad mood.
The same tendency is seen in the students‘ answersх normal mood грладз low spirit гнтадй However, there are three times as many pupils (compared to teachers) who prefer to watch violent scenes in good mood (20%), that probably is not surprisingly on account of young people tending to be in high spirits overall more frequently than adults.
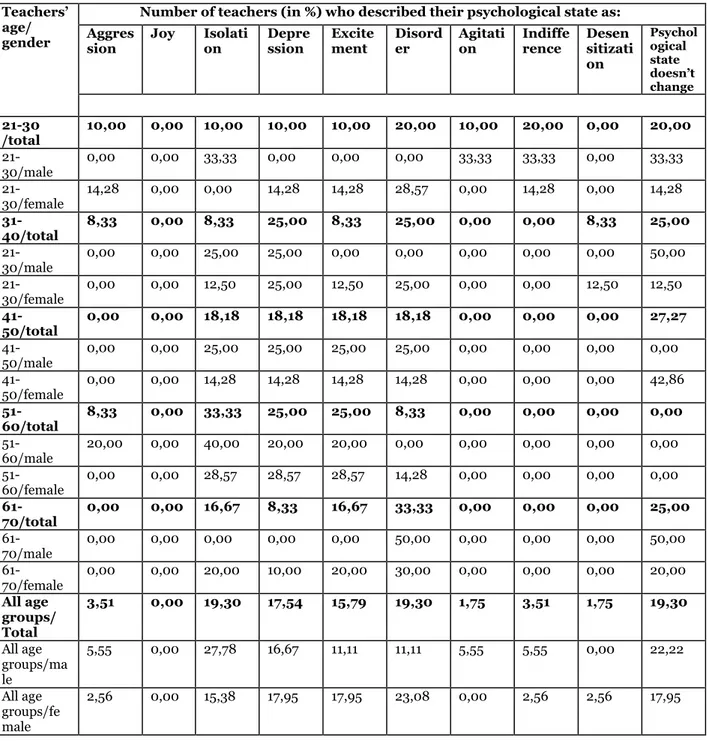
Watching violence on the screen does not evoke joyful feelings in anyone (compared to 4% of studentsдй Most frequent answers were ―isolation‖ гмфа of teachers and фа of studentsдз Then follow ―depression‖ гмта of teachers and моа of pupilsдз ―excitement‖ гмра of teachers and моа of studentsдз ―aggression‖ гоа of teachers and уа of studentsдз ―desensitization‖ гabout на of teachers and 8% of students). 19% of teachers reported that their psychological state was not affected.
795
Table 9. How do they feel after watching violent scenes?
Teachers’Ы
age/ gender
Number of teachers (in %) who described their psychological state as: Aggres
sion
Joy Isolati on
Depre ssion
Excite ment
Disord er
Agitati on
Indiffe rence
Desen sitizati on
Psychol ogical state
doesn’tЫ
change
21-30 /total
10,00 0,00 10,00 10,00 10,00 20,00 10,00 20,00 0,00 20,00
21-30/male
0,00 0,00 33,33 0,00 0,00 0,00 33,33 33,33 0,00 33,33
21-30/female
14,28 0,00 0,00 14,28 14,28 28,57 0,00 14,28 0,00 14,28
31-40/total
8,33 0,00 8,33 25,00 8,33 25,00 0,00 0,00 8,33 25,00
21-30/male
0,00 0,00 25,00 25,00 0,00 0,00 0,00 0,00 0,00 50,00
21-30/female
0,00 0,00 12,50 25,00 12,50 25,00 0,00 0,00 12,50 12,50
41-50/total
0,00 0,00 18,18 18,18 18,18 18,18 0,00 0,00 0,00 27,27
41-50/male
0,00 0,00 25,00 25,00 25,00 25,00 0,00 0,00 0,00 0,00
41-50/female
0,00 0,00 14,28 14,28 14,28 14,28 0,00 0,00 0,00 42,86
51-60/total
8,33 0,00 33,33 25,00 25,00 8,33 0,00 0,00 0,00 0,00
51-60/male
20,00 0,00 40,00 20,00 20,00 0,00 0,00 0,00 0,00 0,00
51-60/female
0,00 0,00 28,57 28,57 28,57 14,28 0,00 0,00 0,00 0,00
61-70/total
0,00 0,00 16,67 8,33 16,67 33,33 0,00 0,00 0,00 25,00
61-70/male
0,00 0,00 0,00 0,00 0,00 50,00 0,00 0,00 0,00 50,00
61-70/female
0,00 0,00 20,00 10,00 20,00 30,00 0,00 0,00 0,00 20,00
All age groups/ Total
3,51 0,00 19,30 17,54 15,79 19,30 1,75 3,51 1,75 19,30
All age groups/ma le
5,55 0,00 27,78 16,67 11,11 11,11 5,55 5,55 0,00 22,22
All age groups/fe male
2,56 0,00 15,38 17,95 17,95 23,08 0,00 2,56 2,56 17,95
796
Table 10. The teachers’ЫreflectionЫonЫscreenЫviolence
Teachers’Ы
age/gender
On-screen violence is forgotten
immediately
Violent images seen are remembered for a short time period only
On-screen violence lingers in memory for a long time
Number of teachers (in %) for whom this tendency is true
21-30 /total 20,00 40,00 40,00
21-30/male 33,33 66,67 0,00
21-30/female 14,28 28,57 57,14
31-40/total 16,67 41,67 41,67
21-30/male 25,00 50,00 25,00
21-30/female 12,50 37,50 50,00
41-50/total 27,27 36,36 36,36
41-50/male 25,00 25,00 50,00
41-50/female 28,57 42,86 28,57
51-60/total 8,33 33,33 58,33
51-60/male 20,00 40,00 40,00
51-60/female 0,00 28,57 71,43
61-70/total 8,33 41,67 50,00
61-70/male 0,00 50,00 50,00
61-70/female 10,00 40,00 50,00
All age groups /Total
15,79 38,60 45,61
All age groups/male 22,22 44,44 33,33
All age groups/female
12,82 35,90 51,28
As we can see from Table 10, almost half of the teachers remember the violent scenes for a long time, and only 16% (men twice as many as women) forget them right after the program is over.
There is a striking similarity in the answers of teachers and students here. 54% of students remember screen violence for a long term period, and only 16% are able to forget them soon. The difference between boys/girls and men/women answers are analogous, too.
These results led us to the following conclusion: 1) the time duration of the violent images lingering in one‘s mind is determined by genderз not by the ageц нд almost half of the surveyed teachers and students remember the scenes of violence they saw on the screen for a long time and only 16% of both of the groups do not recall them afterwards.
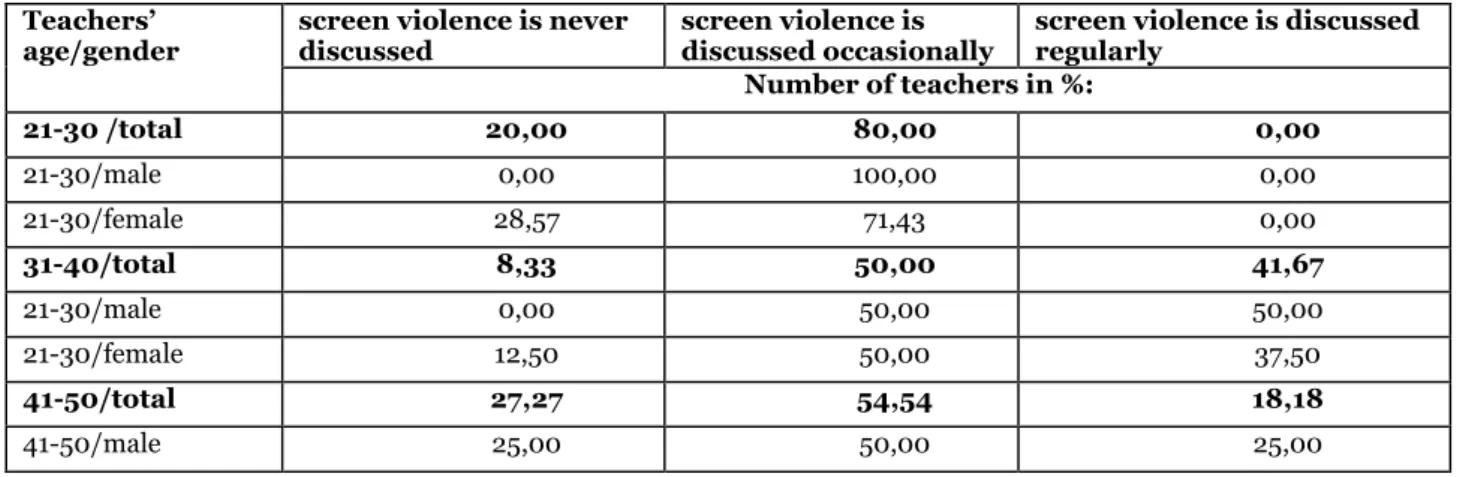
Table 11. The attitude of teachers towards discussing scenes of violence on the screen
Teachers’Ы
age/gender
screen violence is never discussed
screen violence is discussed occasionally
screen violence is discussed regularly
Number of teachers in %:
21-30 /total 20,00 80,00 0,00
21-30/male 0,00 100,00 0,00
21-30/female 28,57 71,43 0,00
31-40/total 8,33 50,00 41,67
21-30/male 0,00 50,00 50,00
21-30/female 12,50 50,00 37,50
41-50/total 27,27 54,54 18,18
797
41-50/female 28,57 57,14 14,28
51-60/total 0,00 58,33 41,67
51-60/male 0,00 80,00 20,00
51-60/female 0,00 42,86 57,14
61-70/total 16,67 66,67 16,67
61-70/male 0,00 100,00 0,00
61-70/female 20,00 60,00 20,00
All age groups /Total
14,03 61,40 24,56
All age groups/male 5,55 72,22 22,22
All age groups/female
17,95 56,41 25,64
Only 14% of the teachers never talk about the violent scenes they have seen (women outnumber men by three times). And the quarter of the surveyed teachers discuss these episodes regularly. The age ranges of teachers who are most likely to discuss the screen violence (42%) are 31-40 and 51-60. Less likely - 21-30 years old.
Thus in general teachers talk about the screen violence less frequently than their students (25% of teachers vs. 46% of students). Moreover, in comparison with the students, the number of teachers who totally ignore the issue is twice more.
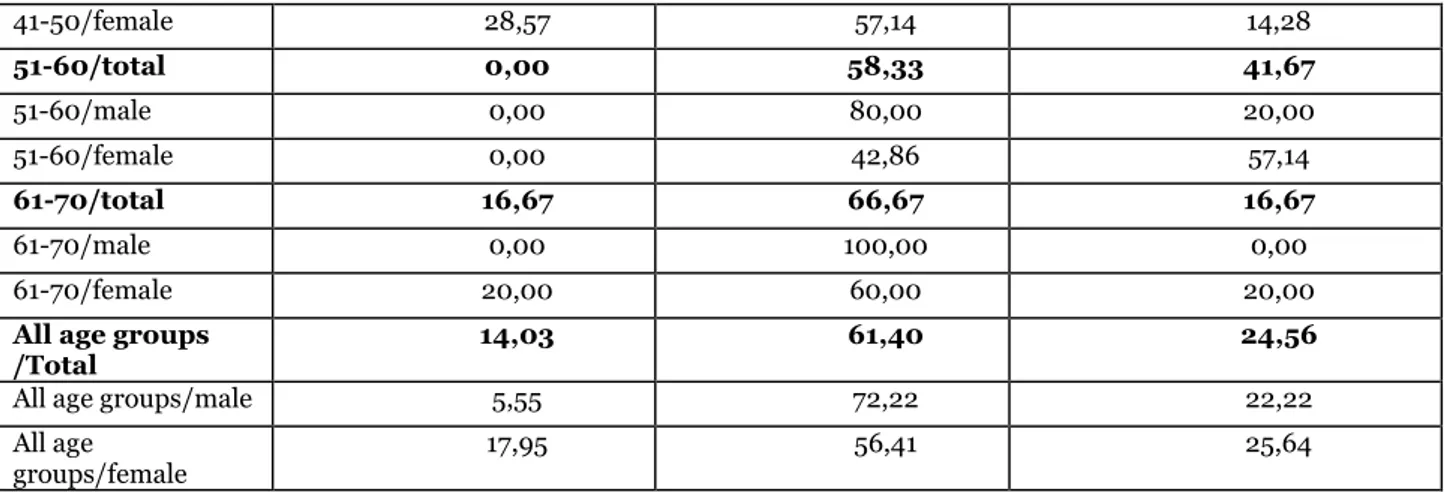
Table 12. Typical interlocutors of the teachers for discussion of the on-screen violence
Teachers’Ы
age/gender
Number of teachers in % who discuss screen violence with: Friends/Spo
uses
Parents Students Children/Grand
children
Others
21-30 /total 70,00 20,00 20,00 0,00 0,00
21-30/male 100,00 0,00 0,00 0,00 0,00
21-30/female 57,14 28,57 28,57 0,00 0,00
31-40/total 91,67 33,33 50,00 33,33 8,33
21-30/male 100,00 25,00 50,00 25,00 0,00
21-30/female 87,50 37,50 50,00 37,50 12,50
41-50/total 72,73 27,27 54,54 45,45 27,27
41-50/male 75,00 50,00 50,00 50,00 25,00
41-50/female 71,43 14,28 57,14 42,86 28,57
51-60/total 41,67 0,00 25,00 66,67 16,67
51-60/male 60,00 0,00 40,00 80,00 40,00
51-60/female 28,57 0,00 14,28 57,14 0,00
61-70/total 58,33 0,00 33,33 66,67 16,67
61-70/male 100,00 0,00 50,00 100,00 0,00
61-70/female 50,00 0,00 30,00 60,00 20,00
All age groups /Total
66,67 15,79 36,84 43,86 14,03
All age groups/male
83,33 16,67 38,89 50,00 16,67
All age groups/female
58,97 15,38 35,90 41,02 12,82
798
descending order follow: children/grandchildren as the possible interlocutors (30% - to watch together, and 44% to talk about it afterwards), students (21% for watching, 37 % for discussion), parents (10% for watching and 16 for discussion) and strangers (3% for watching and 14 for discussion). There are 30% more men than women who are eager to discuss the screen violence with their spouses or friends.
Teachers between the age of 31 and 50 are more likely to discuss this issue with their students and those between the age of 51 and 70- with their children/grandchildren.
Comparing the answers of pupils and teachers, we can note the evident similarity in the leading type of the company for the discussion of scenes of violence on the screen – friends (57% of pupils). While only 12% of the pupils are eager to discuss them with their teachers.
TableЫмойЫTeachers’ЫopinionsЫaboutЫtheЫreasonsЫofЫviolenceЫ and aggression in society
Teachers’Ы
age/gender
Teachers’ЫopinionsЫaboutЫtheЫreasonsЫforЫviolenceЫandЫaggressionsЫinЫsocietyх
Number of teachers in % who agree with the option: Psychological
deviations
Screen violence
Inherent to the human nature
Social and financial inequality
Other reasons
21-30 /total 70,00 20,00 10,00 0,00 0,00
21-30/male 66,67 0,00 33,33 0,00 0,00
21-30/female 71,43 28,57 0,00 0,00 0,00
31-40/total 41,67 33,33 25,00 16,67 00,00
21-30/male 25,00 25,00 25,00 25,00 0,00
21-30/female 50,00 37,50 25,00 12,50 0,00
41-50/total 27,27 36,36 18,18 18,18 0,00
41-50/male 25,00 50,00 25,00 0,00 0,00
41-50/female 28,57 28,57 14,28 28,57 0,00
51-60/total 25,00 41,67 8,33 41,67 0,00
51-60/male 20,00 40,00 20,00 60,00 0,00
51-60/female 28,57 42,86 0,00 28,57 0,00
61-70/total 25,00 41,67 0,00 33,33 0,00
61-70/male 0,00 50,00 0,00 50,00 0,00
61-70/female 30,00 40,00 0,00 30,00 0,00
All age groups /Total
35,09 35,09 12,28 22,81 0,00
All age groups/male
27,78 33,33 22,22 27,78 0,00
All age groups/female
38,46 35,90 7,69 20,51 0,00
In the teachers‘ opinionз main reasons for the aggression and violence in society are the psychopathologies (35% - 27% of women and оуа of menд and ―screen violence‖ горадй ноа гmen outnumber women by 7% here) prone to think that the main reason is the financial inequality of people. And only 12% (3 times more men than women) say that violence is in human nature.
I would like to point out that according to the students‘ surveyз psychopathologies are the main reason for violence, too (37%). There were 28% (less than the teachers by 8%) of those who blamed violence in mediaй However students who thought that it‘s in human nature outnumber the teachers by 7%.
799
TableЫмпйЫTeachers’ЫopinionЫaboutЫtheЫinfluenceЫofЫscenesЫofЫviolenceЫ on the screen and the increase of crime in society
Teachers’Ы
age/ gender
Number of teachers in % who think that: On-screen
violence undoubtedly leads to the increase of crime rate
On-screen violence leads to a small increase of crime
On-screen violence does not affect the crime rate because crimes existed before the invention of cinema and television
On-screen violence leads to increase of crimes commited by people with psychical deviations On-screen violence does not lead to the increase of crimes because it disgusts/ diverts people 21-30 /total
50,00 20,00 0,00 40,00 0,00
21-30/male
33,33 33,33 0,00 33,33 0,00
21-30/female
57,14 14,28 0,00 28,57 0,00
31-40/total
58,33 16,67 16,67 8,33 0,00
21-30/male
50,00 25,00 25,00 0,00 0,00
21-30/female
62,50 12,50 12,50 12,50 0,00
41-50/total
81,82 9,10 0,00 9,10 0,00
41-50/male
100,00 0,00 0,00 0,00 0,00
41-50/female
71,43 14,28 0,00 14,28 0,00
51-60/total
75,00 8,33 0,00 16.67 0,00
51-60/male
60,00 20,00 0,00 20,00 0,00
51-60/female
85,71 0,00 00,00 14,28 0,00
61-70/total
83,33 0,00 0,00 16,67 0,00
61-70/male
100,00 0,00 0,00 0,00 0,00
61-70/female
80,00 0,00 0,00 20,00 0,00
All age groups /Total
70,17 10,53 3,51 15,79 0,00
All age groups/ma le
66,67 16,67 5,55 11,11 0,00
All age groups/fe male
71,79 7,69 2,56 17,95 0,00
800
any affect of screen violence (twice as many men than women). Not a single teacher said that violence on the screen makes audience be disgusted at violence.
The majority of students also believed that the violence on the screen leads to the increase of violence in society (though comparing to teachers, there were twice less students). 22% of pupils are sure that screen violence affects crime rate to an insignificant degree. But the question about the reverse effect of the screen violence provoked the most serious difference in opinions. 11% of students think that it does make people disgust any violence, though there were no teachers who agree on that.
The conclusion is that, with the dominating opinion among both students and teachers that screen violence increases real violence in society, there are twice as many teachers than students who believe that.
TableЫмрйЫTeachers’ЫattitudeЫtowardsЫtheЫproblemЫofЫregulatingЫ violence on the screen
Teachers’Ы
age/ gender
Number of teachers in % who agree that:
Screen violence should be prohibited because it makes people aggressive The current amount of screen violence is acceptable Only the most violent and graphic scenes should be banned There may be violent scenes on the screen, but they should be inaccessibl e for small children There may be violent scenes on the screen but broadcast ed only after midnight The current amount of screen violence is not critical, there can be even more Other opinion 21-30 /total
20,00 0,00 50,00 0,00 30,00 0,00 0,00
21-30/male
0,00 0,00 33,33 0,00 66,67 0,00 0,00
21-30/female
28,57 0,00 57,14 0,00 14,28 0,00 0,00
31-40/total
8,33 8,33 41,67 25,00 16,67 0,00 0,00
21-30/male
0,00 25,00 50,00 25,00 0,00 0,00 0,00
21-30/female
12,50 0,00 37,50 25,00 25,00 0,00 0,00
41-50/total
18,18 0,00 45,45 27,27 9,10 0,00 0,00
41-50/male
0,00 0,00 50,00 25,00 25,00 0,00 0,00
41-50/female
28,57 0,00 42,86 28,57 0,00 0,00 0,00
51-60/total
25,00 0,00 41,67 33,33 0,00 0,00 0,00
51-60/male
20,00 0,00 40,00 40,00 0,00 0,00 0,00
51-60/female
28,57 0,00 42,86 28,57 0,00 0,00 0,00
61-70/total
50,00 0,00 16,67 33,33 0,00 0,00 0,00
61-70/male
100,00 0,00 0,00 0,00 0,00 0,00 0,00
61-70/female
40,00 0,00 20,00 40,00 0,00 0,00 0,00
All age groups