“Multi-Criteria Analysis of the Design
Decisions In Architectural Design Process
during the Pre-Design Stage”
M.Elango #1, Prof. Dr.M.D.Devadas.*2 1, 2.
Anna University, Chennai.25. India.
Department of Architecture, School of Architecture and Planning,
1 archelango73@gmail.com
Abstract -
To understand the importance of rational decision method over the intuitive decisions, an architectural studio project was explored with the design brief as to develop a morphological variation to create the alternatives as design solutions. All those design alternatives have been evaluated by different stakeholders namely the fellow students, faculty members, and post graduate students who are mainly the architects. The objective of the evaluation is to develop an empirical analysis and evaluation of framework for assessing the Architectural Design to check is there a correlation between the different value judgment for intuitive method of decision making and rational method of decision making, of the pre design alternatives.
Design studio in architectural education is a traditional process, based on the methodology related to the aims and objectives of those respective studio curriculum, and the experience and expectation of the faculty members as what they wants the students to learn, and expected to synthesis their knowledge gained from other sources and previous studio experiences. One of the weaknesses of the traditional studio practice is that the design exercises were given so much attention to the compositional aspects of design rather than attempting to study complex and multi-criteria approach for those decisions.
Key words: Design Decision, Intuitive Decision, Morphology, Pre-Design Stage, and Rational Method.
I INTRODUCTION
“Architectural design studios are educational environments that professional education are premised on a particular kind of pedagogy defined as “learning by doing” in the design studio” (Cikis and Cil, 2009[12], Kurt, 2009) [13]. Traditionally, the practice of architectural design is also similar to a project-based "studio" approach. In studio, designers express and explore ideas, generate and evaluate alternatives, and ultimately make decisions and take action (Luen and Gross, 1997) [14]. Several concepts enter into design decisions during the early stage of design, such as size, scale, proportion, configuration, morphology, and emphasis on context. Morphology, the study of pattern and form, is crucial to design because it constitutes an essential part of its corpus of coherent knowledge (Julienne Hanson, (2001) [1]. But they are not consciously aware of the influence of that on the design of those spaces and other performance factors.
The British architect, Bryan Lawson (Bryan Lawson 2005) [21], findings about design methodology as “ Design problems cannot be comprehensively stated. Both objectives and priorities are quite likely to change during the design process as the solution implications begin to emerge”. William M. Peña Steven A (2001) [22] states that the design process is the combination and balancing of Analysis and synthesis.
Design can be seen as a multi-criteria decision making (MCDM) process. (Harputlugil T, 2011) [15]. Architectural design is a process influenced by many, namely design variables, Performance variables and contextual variables (Laseau (2000) [16] and many stakeholders, like clients, designers, consultants and project managers etc. Each of which has impact on decision quality. Each variable and stakeholder might have different criteria and weightings depending on the objective and goal and role they play on that project. (Harputlugil T, 2011)[15].
Krzysztof Zima and Edyta Plebankiewicz (2012) [2] concluded in their research by Analysing the building shape erected in Krakow and its impact on construction costs that “Designing buildings having costs in mind, which translates into constructing buildings simpler in shape to decrease the costs of construction”.
MCDM can be defined as the evaluation of the alternatives for the purpose of selection or ranking, using a number of qualitative and/or quantitative criteria that have different measurement units (Özcan et al., 2011) [3].
II BACKGROUND OF THE STUDY A. Shape and Compactness
Depecker, Menezo et al. (2001) [4] discovered, in a simulation study of 14 different building shapes in two different French climates, that the colder the climate (>250 heating degree days, which corresponds to Paris) the stronger the correlation between shape and energy consumption. He also state that Building compactness (C) is generally defined as surface-to-volume ratio, C=�⁄V , where S is the envelope surface [m²] and V is the internal volume of the building [m³]. The size of the geometry has a great effect on the surface-to-volume ratio where a large size gives a small surface-to-volume ratio. Therefore, building compactness is sometimes expressed as the relative compactness (RC) which is the ratio between the compactness of an ideal reference building with the same volume (for orthogonal buildings a cube) (Ourghi, Al-Anzi et al. 2007) [5]. (Pessenlehner and Mahdavi 2003) [17] State that Preferable to reduce surface area that the most compact building has a relative compactness close to 1.0 and different shapes with the same volume can vary between 0.6 and 1.0. Also examined whether the simple correlation between compactness and heating load is reliable regardless of building shape (self-shading aspect), glazing amount and building orientation.
B. Compactness and Cost Related Studies
The simpler the building plan shape, the lower will be its unit construction cost. (Seely, 1996) [18]. The choice of a particular architectural solution when designing a building considerably influences the costs of its construction (Ferry and Brandon, 2007) [19]. Ibrahim (2004) [6] results confirmed the predictive powers of existing plan shape indices and that of using some of the building parameters. (The building perimeter [EWA] and floor area [FA]). E.Bostancioglu, (2010) [7] states that the increase in the change of shape that is the EWA FA ⁄ / ratio causes the biggest increase in energy costs, construction costs and increased LCC.
C. The Importance of Exploring Design Alternatives
Traditional architectural design processes, lack the rational approach, and designers typically explore only a very small number of alternatives in their work. As a result, most design processes are focused only on a relatively narrow range of possibilities. There may be various reasons like restrictions of time and other limitations.( J. Wang, (2002) [8], as well as by cognitive limits. R. Woodbury, A.L. Burrow, (2006) [9] emphasizes that, un- like in other disciplines; early in the architectural design process the architect tends to identify a strong preferred design direction, with limited design objectives and a clear concept, a so called primary generator (J. Darke, 1984) [10]. The importance of exploring different design alternatives is commonly recognized as a major characteristic of the conceptual design process (Y.C. Liu, T. Blight, A. Chakrabarti, (2003) [11]; Okudan and Tauhid, 2008) [24] providing key advantages, which could be more beneficial to architectural design processes than what current limitations allow. As stated by Wang (2002) [8], conceptual design proceeds as an incremental learning process, in which it is impossible to develop a proper solution in one shot. Instead, phases of divergence generate design alternatives; and phases of convergence select the most promising solutions (Y.C. Liu, T. Blight, A. Chakrabarti (2003). [11]
III METHODOLOGY. A. Aim
TABLE I.
The Summary of Brief to Generate Morphological Variation as Design Alternatives for the Proposed Research.
Description. For All The 40 Nos. Of Alternatives.
Objective. The brief of the design is to develop a volumetric variation using the size of sample mentioned below as constant to create the morphological variance based on the Design variables (Laseau (2000) [16] to generate various design alternatives.
Building typology and building regulations.
Multi unit Residential Building typology, with Special Building category (Regulation for special buildings p.no.32- 40, Volume II ,Development Regulations no.27., (2008), CMDA) [25].
•Min. Plot Extent = 660 sq.m. (Min area for multifamily residential development as per CMDA: 2005) [25].
•Max. Height = G+3 or Stilt+4 subject to a max. of 15.25m
•Max. FSI = 2 (including premium FSI).
Size of the sample
analyzed. 3.0x3.0 m). •A modular geometry was derived based on an elementary cube (3.0x
•(The module referred as the minimum standards for a habitable room: Requirements of parts or buildings – NBC 2005) [26].
•Volume: (660 x 2x 3) = 3960 m³. (Which is together of roughly 146 cubes and a total surface area of 1535 sq.m. as reference building).
Climatic Condition (Context variables)
B. Research Methodology
Flow chart 1: The process to develop the framework has been explained below.
Identify the design to optimise resource efficiency in architectural design process during the pre-design stage.
Identify Relevant Stake holders for evaluation. 1. The students of architecture. (Both their class mates and other students) 50%.
2. The architects cum Post Graduate students of architecture. (Most of them are either faculty members or aspiring to be faculty members). 28%.
3. The faculty members. (Both the design studio faculty members and practicing architects). 22%
To identify from alternatives, which gives maximum benefit?
To identify, which alternative consumes minimum resources.
Tangible benefits. Intangible benefits. Eg: Social benefits.etc..
Qualitative design decision..Eg: Aesthetics, Flexibility, Efficiency. Etc.
Quantitative design decision.
Mathematical based results. Eg: Algorithms, simulation tool related to climate, compactness, cost and energy etc.
Cumulative Ranking based on the Pareto analysis to identify the top 5 ranks from 40 alternatives. (Fig: 1, 2, 3 and 4) (Appendix 3)
Subjective evaluation:
Priority based Ranking with in 4 nos. in one group (sub group).
Based on overall composition.
Numerical evaluation:
Comparative evaluation, based on overall composition. compactness and aesthetics.
1-10 scale ranking.
Relative compactness evaluation:
based on mathematical calculations.
Rc = the ratio between the compactness of reference building and compactness of designed building.
Cumulative Ranking based on the analysis using the design variables influencing the decision during the pre- design stage such as size, shape, width to length ratio, shape factor, etc.. (Table 3 & 4)
Final Cumulative Ranking based on the resource – benefit analysis to identify the design from the top 5 ranked alternatives. (Fig: 5 & Appendix 2).
Stage: 1.
Stage: 2. Alternative technology /
Alternative materials.
Reduction of resources / conventional materials.
Geometric Efficiency.
Relative Geometric Efficiency (RGE) = the ratio between the Geometric Efficiency of
reference building and Geometric Efficiency of
designed building. Intuitive judgement of stakeholder. (From survey).
The students have used the physical model as well as 3D visualisation models using sketch up or 3Dmax or any tool which they are comfortable with, to explore their ideas as to enable them to understand better to take the decisions. Now we have the best 40 alternative design out of 160 (40*4) alternatives these entire 40 best alternatives have been identified (appendix 1) as their best possible alternatives based on their intuitiveness and level of design judgement.
During the second stage submission the multi criteria method of evaluation has followed, with a survey from 59 samples consisting of students, faculty members and P.G. Students. All those best alternatives from each of the students were randomly grouped as four in one group. Those were numbered as 1A, 1B, 1C, 1D...10A, 10B, 10C, 10D. For the purpose of evaluation process.
Those design alternatives were evaluated based on subjective evaluation within each sub-group of 4 alternatives as the priority of ranking, numerical evaluation method to assign value based on 1 – 10 scale based and relative compactness measured from their drawing by comparing its surface area with the reference building for a given volume (Mahdavi, A., Gurtekin, B (2002) [23].
IV RESULTS The analysis of results has been done on a two stages.
The first stage, the analysis has to be used for evaluation of data from the survey through the survey questionnaire and mathematical calculations taken from the stake holders as mentioned above. The Pareto analysis tool was used to sort the least preferred alternatives to identify the top 5 alternatives for each type of evaluations. And the cumulative ranking based on the design decision (Appendix 3) of Subjective evaluation, Numerical Evaluation and Relative Compactness.
During the second stage, the evaluation has been done for the top 5 alternatives based on the variables affecting the compactness and morphology of any buildings which are directly beneficial to the resources used in a project. The variables are, the relative compactness, proportion of building (width to length ratio), and total height of the building, characteristic length and external wall area to floor area. Using these parameters the alternatives have been compared with the impact of those variables to the design decision to identify the optimum design by conducting the resource benefit analysis. (Appendix 2).
A. Stage 1: The first case: Effect of Subjective Evaluation on Morphological Variation Results
The stack holders have been asked to rank their priorities from priority no 1 to 4 through a randomly selected sub groups containing 4 options in each sub-group. The above values identified as frequencies have been tabulated as an average score from the survey format and Final cumulative value for each alternative has been assigned and sorted using the Pareto-analysis.
Figure 1: Effect of Subjective evaluation on Morphological variation Results
B. Stage 1: The Second Case: Effect of Numeric Evaluation on Morphological Variation.
The stack holders have been asked to assign weighted scale of 1 to 10 (1 as their lowest score to 1 and highest as 10). The above values identified as frequencies have been tabulated as an average score from the survey of all the 59 samples. Final cumulative value for each alternative has been assigned and sorted using the Pareto-analysis.
0.84 0.84 0.81 0.81
0.78 0.78
0.73 0.72 0.71 0.71
5% 5% 11% 11%
16% 21%
25% 30%
34% 34%
Saroja Pradeep Ronald Sabari Abiram Akshaya Manoj Soundhar Keshini Nithya
Fernandez
2C 3B 7C 8B 6A 9D 1A 10A 5B 8C
Pareto Analysis: Subjective Evaluvation.
Figure 2: Effect of Numeric evaluation on Morphological variation Results.
C. Stage 1: The Third Case: Effect of Relative Compactness Evaluation on Morphological Variation. Based on mathematical calculations i.e. Rc = the ratio between the compactness of reference building (and compactness of designed building. i.e. (R.C. = surface area of designed object / surface area of reference block (1535).
Figure 3: Effect of Relative Compactness evaluation on Morphological variation Results.
0.75 0.75 0.72 0.72 0.72 0.71 0.71 0.71
0.70 0.70
8% 8% 15% 15% 15%
22% 22% 22% 29% 29%
S
ar
oja
R
on
al
d
S
ab
ar
i
P
ri
y
an
ka K
ath
re
san
P
ra
d
eep
Dhe
e
pi
k
a
K
e
sh
in
i
S
ar
at
M
an
oj
B
a
la
cha
nde
r
2C 7C 8B 9C 3B 4A 5B 10C 1A 7A
freq.
cu.%
0.87 0.87
0.83
0.71 0.71 0.68 0.68
0.67 0.66 0.65
5% 5% 9%
13% 13% 17% 17%
20% 24%
28%
Dheepika Priyanka Kathresan
Jocelyn Manoj Sarat Nithya
Fernandez
Ishwarya Sri Akila Saroja Ayushi
4A 9C 9A 1A 10C 8C 10B 6C 2C 5D
Pareto Analysis: Relative Compactness Evaluation.
D. Stage 1: The Final Case: Effect of Overall Evaluation on Morphological Variation
Figure 4: Effect of Overall evaluation on Morphological variation Results to identify top 10 ranks.
TABLE II.
Pareto analysis: Results to identify top 5 ranking. (Appendix 3)
S.no. Shape no
Name of the student. Cu.% (subjective) Cu.% (Rc) Cu.% (numeric) Overall deviation Overall value %
1 2C Saroja 5% 24% 8% 12% 88%
2 7C Ronald 11% 47% 8% 22% 78%
3 1A Manoj 25% 13% 29% 22% 78%
4 3B Pradeep 5% 58% 15% 26% 74%
5 4A Dheepika 56% 5% 22% 28% 72%
6 10C Sarat 56% 13% 22% 30% 70%
7 8C Nithya Fernandez 34% 17% 50% 34% 66%
8 9C Priyanka Kathresan 86% 5% 15% 35% 65%
9 8B Sabari 11% 85% 15% 37% 63%
10 5B Keshini 34% 55% 22% 37% 63%
5% 11%
25%
5%
56% 56%
34% 86% 11% 34% 24% 47% 13% 58% 5%
13% 17%
5%
85%
55%
8% 8%
29%
15%
22% 22%
50%
15% 15%
22% 88%
78% 78%
74% 72% 70%
66% 65% 63% 63%
0% 10% 20% 30% 40% 50% 60% 70% 80% 90% 100% S ar oja R on al d M an oj P ra d eep Dhe e pi k a S ar at N it hya Fe rna nde z P ri y an ka K ath re san S ab ar i K e sh in i
2C 7C 1A 3B 4A 10C 8C 9C 8B 5B
Over all Evaluation.
E. Stage 2: The Final Case: Effect of Overall evaluation on Morphological variation Results to identify top 5 ranking.
TABLE III.
Compression of Variables affecting the Compactness and Morphology for top 5 ranking models.
S.No .
Variables affecting the Compactness and Morphology
SAROJ A (2C)
PRADEE P (3B)
RONALD (7C)
MANOJ (1A)
DHEEPICA (4A)
Referenc e building.
1 W/L 1 1.21 1 1 1 1.2
2 R.C. 0.665 0.487 0.517 0.710 0.870 1.000
3 Characteristic Length (L.C.) 1.706 1.250 1.329 2.024 2.235 2.570
4 Wall to floor ratio:
(P/ S) 1.150 1.393 1.661 0.980 0.914 0.750
5 Shape Factor or G.E
(Building) (A/S) 1.750 2.389 2.248 2.916 1.336 1.162
6 R.G.E 1.505 2.054 1.933 1.410 1.149 1.000
TABLE IV.
Compression of Values for the Variables affecting the Compactness and Morphology for top 5 ranking models.
From the below analysis we can identify the shape no 4A (Deepika) has got the benefits of 85.27 % and the deviation from the reference building as 14.90 (Relative Geometric Efficiency) stands first amongst the five alternatives (Appendix 2).
Figure 5: Effect of Overall evaluation on Resource and Benefit.
50.500
105.400
93.300
41.000
14.900 69.56
60.13 56.72 69.90
85.27
0.000 20.000 40.000 60.000 80.000 100.000 120.000
Resource – Benefit Analysis
Relative Geometric Efficiency Benefits
S.No. Variables affecting the Compactness and
Morphology
SAROJA (2C)
PRADEEP (3B)
RONALD (7C)
MANOJ (1A)
DHEEPICA (4A)
1 W/L ratio 83.33333 100.8333 83.33333 83.33333 83.333333
2 R.C. 66.450 48.684 51.736 71.000 87.018
3 Charectristic Length (L.C.) 66.401 48.647 51.697 78.761 86.953
4 Wall to floor ratio: (P/ S) 65.217 53.834 45.144 76.531 82.090
5 Shape Factor or G.E (Building) (A/S)
66.400 48.647 51.697 39.850 86.952
Total 69.042 58.221 55.890 70.066 85.27
V DISCUSSIONS A. The Correlation Coefficient Analysis.
The correlation coefficient analysis has been conducted between the subjective decision ranking (intuitive), Numeric decision ranking (intuitive) and relative compactness ranking (mathematical model) with overall ranking between the students, faculty members and architects group participated in the survey.
1. CASE 1: Correlation between subjective decision (intuitive) and overall ranking.
Figure 6: The correlation coefficient is 0.709985828
2. CASE 2: Correlation of Relative compactness ranking and overall ranking.
Figure 7: The Correlation Coefficient is 0.596167 0.000
0.200 0.400 0.600 0.800 1.000
0.000 0.200 0.400 0.600 0.800 1.000
Su
b
jec
ti
ve
Ra
n
k
in
g
Overall Ranking
Subjective Ranking vs. Overall ranking
overall ranking
0.000 0.100 0.200 0.300 0.400 0.500 0.600 0.700 0.800 0.900 1.000
0.000 0.200 0.400 0.600 0.800 1.000 1.200
Rel
a
ti
ve
C
o
m
.
Ra
n
k
in
g
.
Overall Ranking
Relative Compactness Ranking Vs. Overall ranking
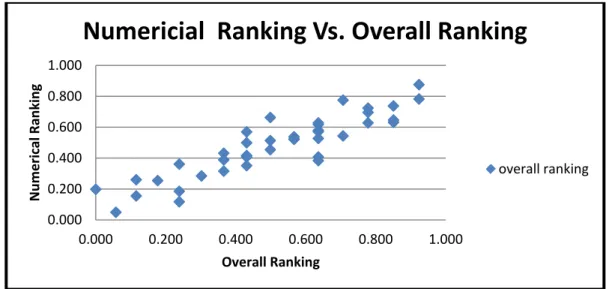
3. CASE 3: Equal value in Numeric value weightage with difference in other weightage and overall ranking. (Table 10).
Figure 8: the correlation coefficient is 0.90402.
From the above correlation coefficient there is a strong correlation between the Numeric decision ranking (intuitive) and overall ranking (0.90402) (fig.10). There is the correlation coefficient is 0.709985828 (fig 8) between the subjective decision ranking (intuitive) with overall ranking which shows there is a moderate relation. However the correlation coefficient shows that relatively lower correlation between the Relative compactness ranking (mathematical model) with overall ranking (0.596167) (fig 9).
1. The intuitive judgement and single objective decision alone cannot be used to judge the alternative to predict the best possible design with the possible minimum information by any designer which can be accessible during the pre-design stage. This has proved the requirement of multi-criteria tool with a rational approach to predict the optimum design solution during the pre-design stage.
2. This is evident that the results of intuitive judgements as listed in table 1 and results of multi-criteria as listed in table no 4 gives different opinion.
VI LIMITATIONS AND SCOPE FOR FURTHER IMPROVEMENT:
From the research the following are identified as the limitation and scope for further research:
1. The constraints of the site and other geographical influences were not considered for this design development but those factors could impact the development of design.
2. Only a morphological variation alone considered for the evaluation. But in practice the major factors could majorly influence the design decision such as the internal arrangement, performance or qualitative aspects like, day lighting; natural ventilation, thermal performance etc are not considered as the criteria for evaluation.
3. If any further research could add the above mentioned tangible benefits or intangible benefits (eg: social, economical, cultural etc.) they can add to the framework in such a way that it can be a continuous research process so that at the end we will have a comprehensive rational tool to evaluate the design decisions during the pre- design stage. This will be available as a very useful tool to the architects, clients and promoters to reduce the negative impact they possibly create on the built environment.
4. There is also possibility of change in result may be possible, based on the typology of building and relative importance of the architects during their design process.
ACKNOWLEDGEMENT
To the following peoples to share their time and valuable expert information and sharing of their knowledge: The Professor and Head and students of third year architecture, Dept. Of Architecture, Anna University, Chennai, India. And to all those who participated in the survey as expert members. (The faculty members of internal and external, the U.G. and P.G. students of SAP).
0.000 0.200 0.400 0.600 0.800 1.000
0.000 0.200 0.400 0.600 0.800 1.000
Nu
m
er
ic
a
l Ra
n
k
in
g
Overall Ranking
Numericial Ranking Vs. Overall Ranking
REFERENCE
A. Refereed journals
[1] Julienne Hanson, Morphology and Design. Reconciling intellect, intuition, and ethics in the reflective practice of architecture.
Proceedings. 3rd International Space Syntax Symposium Atlanta (2001).
[2] Krzysztof Zima and Edyta Plebankiewicz, “Analysis of the building shape erected in Krakow and its impact on construction
costs”. organization, technology and management in construction · an international journal 4(1) (2012) pp 411- 419.
[3] Özcan, T., Çelebi, N., Esnaf, Ş., Comparative Analysis Of Multi-Criteria Decision Making Methodologies And Implementation
Of A Warehouse Location Selection Problem. Expert Systems with Applications, (2011).
[4] P. Depecker, C. Menezo, J. Virgone, S. Lepers, “Design of buildings shape and energetic consumption”. Building and
Environment 36 (2001) 627–635.
[5] Ourghi, R.; Al-Anzi, A.; Krarti, M. A simplified analysis method to predict the impact of shape on annual energy use for office
buildings, Energy Conversion and Management 48(1) (2007) : pp.300–305.
[6] Ahmed doko Ibrahim, Effect of changes in layout shape on unit construction cost of residential building –samaru journal of
information studies, vol.7 (2007). Pp.24-31.
[7] E.Bostancioglu, “Effect of building shape on a residential buildings construction cost, energy and life cycle costs.” Architectural
Science review, 53:4, (2010), pp.441- 467.
[8] J. Wang, Improved engineering design concept selection using fuzzy sets, International Journal of Computer Integrated
Manufacturing 15 (1) (2002) pp.18–27.
[9] Woodbury, R.F., & Burrow, A.L., “Whither Design space?” AIEDAM (2006), 20(02), pp. 63-82.
[10] Darke, J., “The Primary Generator and the Design Process”, Developments in Design Methodology, Nigel Cross, Open
University, John Wiley & Sons, (1984) pp.175-188.
[11] Y.C. Liu, T. Blight, A. Chakrabarti, “Towards an ‘ideal’ approach for concept generation, Design Studies” 24 (4) (2003) 341–355.
B. Books and Proceedings of Conferences.
[12] Çıkış, Ş., & Çil, E. . Problematization of assessment in the architectural design education: First year as a case study. Procedia Social and Behavioural Sciences, 1, (2009), pp.2103–2110.
[13] Kurt, S. An analytic study on the traditional studio environments and the use of the constructivist studio in the architectural design
education. Procedia Social and Behavioural Sciences, 1, (2009) pp. 401–408.
[14] Ellen Yi-Luen Do, Mark D. Gross, The Design Studio Approach: Learning Design in Architecture Education, In Design
Education Workshop, J. Kolodner & M. Guzdial (eds.) EduTech/NSF, College of Computing, Georgia Institute of Technology, September 8 -9, (1997) Atlanta.
[15] Harputlugil T.,Gültekin A.T., Matthijs Prins, Conceptual Framework For Potential Implementations Of Multi Criteria Decision
Making (MCDM) Methods For Design Quality Assessment, Management and Innovation for a Sustainable Built Environment, (20 – 23 June 2011), Amsterdam, The Netherlands.
[16] Laseau, P. Graphic Thinking for Architects & Designers. (2000), USA.
[17] Werner Pessenlehner and Ardeshir Mahdavi, “Building Morphology, Transparency, and Energy Performance”, (2003) Eighth
International IBPSA Conference, Eindhoven, Netherlands.
[18] Seeley, I.H. Building Economics. Macmillan, (1996). London.
[19] Ferry, D. and Brandon, P. Cost Planning of Buildings. Granada, (1991) London.
[20] Schon D.A., “ Educating the reflective Practioner, Jossey – Bass, (1989) Sanfrancisco.
[21] Bryan Lawson, “How Designers Think, The Design Process Demystified”, Fourth Edition, Architectural press, (2005) Oxford.
[22] William M. Peña Steven A. Parshall, “Problem Seeking - An Architectural Programming Primer”. (2001) HOK Team, 4th
Edition.
[23] Mahdavi, A., Gurtekin, B., “Shapes, Numbers, and Perception: Aspects and Dimensions of the Design Performance Space”.
Proceedings of the 6th International Conference: Design and Decision Support Systems in Architecture, the Netherlands, ISBN 90-6814-141-4. (2002) pp 291-300.
[24] Okudan, G. E. and Tauhid, S.:, Concept selection methods – a literature review from 1980 to 2008, Int. Journal of Design
Engineering, 1(3), (2008), 243–277.
[25] Regulation for special buildings p.no.32- 40, Volume II, Development Regulations no.27. (2008), CMDA.
DHEEPICA (4A): First choice. Manoj (1A) : Second choice’
Saroja (2C): Third Choice. Ronald (7C): Fourth Choice.
Pradeep (3B): Fifth Choice.
Appendix 3: Overall Ranking. (Pareto analysis)
Overall Ranking.
S.no. Shape no Name
cu.% (Subjective
)
cu.% R.C. Frequency
cu.% Numeric frequency
overall %
1 2C Saroja 5% 24% 8% 88%
2 7C Ronald 11% 47% 8% 78%
3 1A Manoj 25% 13% 29% 78%
4 3B Pradeep 5% 58% 15% 74%
5 4A Dheepika 56% 5% 22% 72%
6 10C Sarat 56% 13% 22% 70%
7 8C Nithya Fernandez 34% 17% 50% 66%
8 9C Priyanka Kathresan 86% 5% 15% 65%
9 8B Sabari 11% 85% 15% 63%
10 5B Keshini 34% 55% 22% 63%
11 9B Sam 43% 32% 36% 63%
12 5A Siddarth 39% 39% 36% 62%
13 4D Aparna 39% 51% 36% 58%
14 2A Sumithra 64% 28% 36% 57%
15 6C Sri Akila 52% 20% 57% 57%
16 7A Balachander 76% 32% 29% 54%
17 9A Jocelyn 86% 9% 43% 54%
18 9D Akshaya 21% 85% 36% 53%
19 10B Ishwarya 83% 17% 43% 52%
20 1D Vaikunth 68% 32% 43% 52%
21 5C Vignesh 60% 36% 50% 51%
22 4B Lalitha 39% 55% 57% 50%
23 3C Nithya Reddy 48% 66% 50% 45%
24 10A Soundhar 30% 77% 63% 43%
25 3A Samyuktha 86% 32% 57% 42%
26 6B Prithviraj 60% 81% 36% 41%
27 3D Arthi 89% 32% 57% 41%
28 5D Ayushi 92% 28% 63% 39%
29 7D Preetika 56% 92% 36% 38%
30 6A Abiram 16% 100% 76% 36%
31 2B Vidyalakshmi 68% 70% 57% 35%
32 1B Dhivya Dharshini 72% 70% 63% 32%
33 10D Priyanka G 83% 62% 70% 28%
34 8D G. Aiswarya P 83% 51% 88% 26%
35 1C Abinaya 79% 62% 82% 25%
36 6D Aysha 97% 43% 100% 20%
37 4C Shobana 95% 73% 76% 19%
38 7B Mohanapriya 92% 73% 88% 16%
39 8A Surya 100% 89% 76% 12%