MASTER
THESIS
IN
FINANCE
“
E
QUITY
-L
IKE
M
ANDATORY
C
ONVERTIBLES
:
A
C
APITAL
R
AISING
A
LTERNATIVE
”
B
RUNOP
INTOB
ESSAS
TUDENTID:
24635
Abstract
Hybrid securities has played an important role in helping firms with their specific business strategy challenges by mitigating market imperfections and increasing sources of capital and costs efficiency through the deep customization they generally allow. In this work, I study equity-like mandatory convertible securities, its issuers’ characteristics, needs and challenges. These securities are dividend enhanced, automatically converted into common equity at maturity and have either limited or capped upside potential while fully participating in the downside losses. I find that firms issuing mandatory convertibles have greater non-debt tax shields and lower corporate tax rates, suggesting a tax exhaustion state. Issuers also display higher default probability, lower levels of internal funds, liquidity, solvency and financial stability and, more importantly, a deterioration of these variables close to the offering, which supports the choice for a safer option to raise capital whenever firms are financially troubled, highly levered and/or generally incapable of complying with future debt commitments. Despite some industry biasedness, some evidence shows that managers support their decisions on industry target benchmarks (e.g. indebtedness levels) and that equity-like mandatory convertible securities help firms with sequential financing needs.
NOVA School of Business and Economics Maastricht University
1.1 Research Question and Objectives ... 6
1.2 Academic Contribution ... 6
1.3 Structure ... 7
2. Equity-Like Mandatory Convertibles ... 7
2.1 Ordinary Convertible Securities ... 7
2.2 Mandatory Convertibles ... 8
3. Literature Review and Hypothesis ... 13
3.1 Tax Benefits Hypothesis ... 15
3.2 Financial Distress Hypothesis ... 16
3.3 Static Trade Off Theory ... 17
3.4 Optimal Capital Structure Hypothesis ... 18
3.5 Staged-Investment Hypothesis ... 19
3.6 Cash-Flow Shortage Theory ... 19
3.7 Pecking Order Theory ... 20
4. Data and Methodologies ... 21
4.1 Sample Selection ... 21
4.2 Summary Statistics ... 22
5. Discussion of Results ... 26
5.1 Tax Benefits Hypothesis ... 26
5.2 Financial Distress Hypothesis ... 27
5.3 Static Trade Off Theory ... 33
5.4 Optimal Capital Structure Hypothesis ... 35
5.5 Staged-Investment Hypothesis ... 36
5.6 Cash-Flow Shortage Theory ... 37
5.7 Pecking Order Theory ... 38
6. Summary and conclusion ... 38
Acknowledgments ... 39
References ... 40
Table 2 – Industry SIC Codes Correspondence ... 22
Table 3 – Sample Summary Statistics ... 24
Table 4 – Tax Benefits Hypothesis ... 26
Table 5 – Bankruptcy Risk ... 28
Table 6 – Financial Slack ... 29
Table 7 – Liquidity... 30
Table 8 – Solvency... 31
Table 9 – Financial Stability ... 33
Table 10 – Correlation of Buy-and-Hold Abnormal Returns ... 34
Table 11 – Optimal Capital Structure ... 35
Table 12 – Capital Expenditures ... 36
Table 13 – Operating Cash Flows ... 37
LIST OF FIGURES Figure 1 – Probability of conversion as a criterion to equity or debt behavior of convertibles ... 8
Figure 2 – Value of PERCS ... 11
Figure 3 – Value of DECS ... 12
Figure 4 – Value of Mandatory Convertibles in the US Market (2005-2015)... 25
Figure 5 – Value of Mandatory Convertibles in the US Market per Industry (2005-2015) ... 25
LIST OF ABREVIATIONS
ACES - Automatically Convertible Equity Securities
TRACES - TRust ACES
DECS - Dividend Enhanced Convertible Stock
PEPS - Premium Exchangeable Participating Shares
PRIDES - Preferred Redeemable Increased Dividend Equity Securities
FELINE PRIDES - Flexible Equity-Linked Exchangeable PRIDES
PRIZES - Participating Redeemable Indexed Zero-premium Exchangeable Securities
STRYPES - Structured Yield Product Exchangeable for Common Stock
TARGETS - Targeted Growth Enhanced Terms Securities
1.
Introduction
In the last two decades, financial innovation has played an important role in increasing the number
of sources of capital and the costs efficiency of raising capital. The new hybrid securities, created
every year, allow for customization of firms’ specific needs, mitigate market imperfections and help issuers in their business strategy specific challenges.
1.1 Research Question and Objectives
In this work, I analyze equity-like mandatory convertible securities, its issuers’ characteristics, needs and challenges. My main objective is to understand the motivations underlying the issue of
this specific type of securities and how these affect the issuing firms.
These securities exist under the form of various acronyms, depending on the underwriting
investment bank, being the two most popular forms PERCS and DECS.
Although mandatory convertible securities feature a variety of payoff structures, they have three
fundamental features: i) they are automatically converted into ordinary shares at maturity; ii) they
have either limited or capped upside potential, as compared with its underlying common stock,
while frequently participate fully in issuers’ losses, and iii) they are dividend enhanced since its dividend yield is typically higher than that of the underlying common stock.
1.2 Academic Contribution
Research about equity-like mandatory convertible securities, besides scarce and generally
outdated, is still very fragmented, with few theoretical background and empirical support. The most
abundant and more directly related research studies convertibles in general, preferred stock and the
choice between debt-like and equity-like securities and/or convertibles.
In this sense, this works aims to bring some attention and enlightening to this field of study,
particularly to the financial innovation introduced by the specificities of equity-like mandatory
1.3 Structure
This work is organized as follows: in section 2, I provide a brief theoretical framework of
equity-like mandatory convertible securities. In section 3, I link these specific instruments with the
existing literature on mandatory convertibles, general convertibles, capital structure, trade-off
theory and agency costs theory. In section 4, I describe the data and methodologies used in the
empirical part of this work. In section 5, I provide the empirical results, for the hypotheses aided
in section 3, and analyze the conclusions. Finally, in section 5, I provide a summary of the
discussion of results and a brief conclusion.
2.
Equity-Like Mandatory Convertibles
2.1 Ordinary Convertible Securities
Ordinary convertibles are instruments that can be converted by its holder into the underlying
ordinary shares at a pre-specified price and at, or before, a pre-specified date. Frequently, they can
also be redeemed at the option of its issuer.
In its essence, these instruments are typically under the form of preferred shares or bonds. Because
they are convertible into common stock, these securities correlate with the movements of its
underlying stock.
Both convertible debt and convertible preferred stocks are hybrid instruments. In fact, these
securities have both equity and debt features, like common stock, they benefit from the appreciation
potential of issuer’s ordinary shares and, like bonds, they can have cash redemption at maturity and fixed coupon payments.
In this sense, ordinary convertibles can be tailored to look more like bonds or more like equity. For
instance, the higher the coupon paid, the lower the probability it will be converted and/or the lower
the conversion price, the higher the probability it will be converted. The higher the probability of
Figure 1 – Probability of conversion as a criterion to equity or debt behavior of convertibles
Convertible securities are often referred as a mean to raise equity “through the backdoor”. The three main reasons firms use convertibles to raise external capital are: i) the conversion feature
enables issuers to obtain equity financing on a deferred basis, avoiding the immediate dilution on
old stockholders’ wealth and, partially, the often negative price reaction; ii) they generally require fewer covenants and preserve additional debt capacity as investors base is usually different, and
iii) the conversion feature often allows issuers to benefit from lower coupon or dividend rates, as
compared with non-convertible securities.
From the issuers’ standpoint, these instruments are often referred as a useful mean to reduce the costs of information asymmetry, which can make equity financings particularly costly for smaller
firms and/or firms with limited additional debt capacity.
On the other hand, convertibles appeal to a variety of investors, with different risk profiles and
investment goals. Common investors of convertibles are dedicated convertible funds, which look
for upside opportunities and limited downside, hedge funds, more interested in arbitrage
opportunities, equity funds, which use convertibles to smooth portfolio volatility, and high-yield
funds, which typically invest in convertibles as an alternative to fixed-income investments.
2.2 Mandatory Convertibles1
Although mandatory convertible securities feature a variety of payoff structures and different
denominations according to the investment bank underwriting the offer, they perform very much
1 The theoretical base proposed by Arzac (1997) on mandatory convertibles is mostly the starting point of this research paper and, even though I
will challenge his hypotheses later, for this theoretical section, they will be considered true.
Straight Equity
Zero Coupon Convertibles Mandatory Convertibles
Low Coupon Convertibles
High Coupon Convertibles
Straight Debt
Equity-Like
Debt-Like Lowest
Highest
P
ro
b
ab
il
it
y
o
f
C
o
n
v
er
si
o
like the underlying ordinary share and have three fundamental features: i) they are automatically
converted into ordinary shares at maturity; ii) they have either limited or capped upside potential,
as compared with its underlying common stock, but frequently participate fully in issuers’ losses, and iii) the dividend yield is typically higher than that of the underlying common stock.
Like general convertible securities, mandatory convertibles also help firms reduce the costs of
information asymmetry, allowing them to raise capital without giving away equity too cheaply, or
paying a high interest rate on an alternative debt source.
According to Arzac (1997), firms issuing equity-like mandatory convertibles are usually larger,
highly leveraged and/or temporarily “financially troubled” that wants to raise capital while
avoiding unnecessary dilution and underpricing.
“Much as convertibles accomplish for smaller growth firms, mandatory convertibles enable large issuers with growth (or recovery) prospects that may not be fully reflected in their current stock prices to signal their confidence”
(Arzac, 1997)
Mandatory convertibles are particular appropriate to narrow the gap of information between
investors and managers because, although they perform like the underlying ordinary shares, they
are less sensitive than straight equity or debt to changes in risk of the issuer. There are two offsetting
effects to changes in issuer’s risk after the issuance of such instruments: i) the claim to the underlying decreases in value but, ii) the option on the underlying, which is built in the convertible,
becomes more valuable due to the higher volatility of the underlying. 2
Some other benefits of issue mandatory convertible securities are: i) they allow firms to issue less
costly delayed common equity; ii) they often receive a full equity credit by rating agencies and
regulators; iii) they limit excessive financial default risk by substituting interest payments for
dividends, which can be waived and accumulated if the firm is not able to pay them; iv) by
promising a higher fixed income stream, in exchange for the limited upside potential, they send a
stronger expression of confidence in firm’s future to the market; v) compared to straight equity, they reduce the negative signaling effect and the resulting dilution of old shareholders wealth, and
vi) some specific mandatory convertible securities’ payoff structures can be tax deductible.
From the demand standpoint, investors generally seek for high dividend yields, downside
protection, capital appreciation, or some combination of these.
The reasons that justify the demand for mandatory convertibles are, among others, the following:
i) compared with the underlying stocks, and even in declining interest rates and dividend yields
environments, mandatory convertibles provide a high coupon, in exchange for limited upside
potential and having to mandatorily convert into the underlying at a premium price, ii) investors
are more protected in case of bankruptcy before the conversion date since mandatory convertibles
have higher level of subordination compared to the underlying, iii) as mentioned above, compared
with conventional equity or debt, mandatory convertibles are less sensitive to changes in issuer’s risk after the offer, which makes these securities useful tools to reduce information asymmetry
between management and investors, and iv) mandatory convertibles provide both a fixed income
stream and a capital appreciation, which can result in a greater after-tax return for taxable investors
as compared with other fixed income securities. Some other specific advantages of mandatory
convertibles sub-types, compared with conventional equity or debt, are presented in the respective
sections below.
On the issuers’ side, firms naturally seek to offer less of some or all the features investors wish. The role of the investment banks is therefore to design securities that falls into the set of attributes
that satisfies both the issuers and the investors at any given point in time. This matching would
then increase the popularity of such securities which would attract market-makers that would
provide more liquidity and narrower bid-ask spreads.
I describe the most relevant groups of mandatory convertibles in detail, below:
Limited Upside Potential
Limited upside potential mandatory convertibles typically include PERCS or PERQS (Morgan
Stanley), STRYPES (Merril Lynch), TARGETS (Smith Barney) or YES (Goldman Sachs). Since
the most popular form of these sub-type of mandatories are PERCS (Preferred Equity Redemption
Cumulative Securities), these will be the focus of this section.
PERCS are dividend enhanced mandatory convertible preferred stocks, with a typical maturity of
three years. Its dividends are cumulative, higher than those of the underlying stock and investors
in this instruments receive priority over common stocks in case of bankruptcy before maturity, or
until the issuer redeems them by exercising his call option and forcing the conversion before
Since at issue this securities’ call has a strike price around 20-25% above the underlying stocks, if the issuer exercise his option and calls the conversion, investors gains are capped at the strike price.
If not, upon conversion investors receive a variable fraction of the underlying, typically depending
on its price at the time. In this sense, PERCS investors receive a higher dividend yield, as compared
to common shareholders, at the price of fully participating in the downside losses while having
limited upside participation. Although less common, investors can be allowed to call the conversion
after some point in time and before the maturity.
In terms of valuation, PERCS are made of three components: i) a dividend cash-flow received until
maturity; ii) a ordinary share received at maturity, and iii) a call option on the underlying (issuer’s common stock), written to the issuer by the holder, with a strike price equal to the cap. Figure 2
depicts the value of PERCS given the cash flow structure:
Figure 2 – Value of PERCS
PERCS issuers face a tradeoff between providing investors with a higher dividend yield or a greater
cap. The lower the dividend yield relative to common stocks, the lower the cap accepted by
investors. This tradeoff works within a reasonable range of values, since a too high dividend yield
would result in cap so low that would transform PERCS in something more close to a subordinated
note, with almost no capital gain potential.
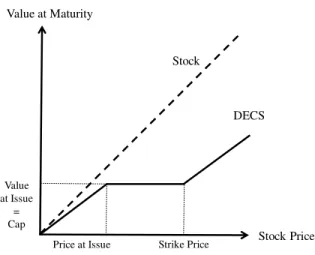
Upside Participating
The most widespread mandatories falling within this category are DECS (Salomon Brothers),
PRIDES, FELINE PRIDES, PHONES and PRIZES (Merril Lynch), ACES and TRACES
PERCS Stock
Value at Maturity
Value at Issue
Price at Issue Cap
(Goldman Sachs) or PEPS (Morgan Stanley). The most popular are DECS (Dividend Enhanced
Convertible Stock) and the next paragraphs will focus on analyzing its features and particularities.
Unlike PERCS, DECS do not limit capital gains in case the underlying stock appreciates, making
them more suitable for bullish investors as compared to capped mandatories. In exchange, investors
in these securities only start participating in the capital gains of the underlying once its price reaches
a certain minimum threshold, higher than the price at the time of the offering. Additionally, the
conversion ratio is variable with the maturity price, which by its turn, and similarly to Asian
options, is calculated using the average of a certain number of trading days before the maturity
(typically 20 days).
Finally, as PERCS, typically DECS can be early called its issuer, and less frequently by its holder,
and they are typically issued at the same price of the underlying common stock. The issuer company
has in this sense the flexibility of deciding on two variables, the dividend yield and the conversion
ratio (including the strike price of the out-of-the-money call option on the underlying stock, that is
the price threshold), the conversion ratio itself and its progression scale (normally smaller as higher
is the common stocks’ appreciation).
In this context, Figure 3 depicts the tradeoff between these two variables.
Figure 3 – Value of DECS
For a higher dividend yield, and between certain minimum limits, investors will accept a higher
strike price and vice-versa.
DECS Stock
Value at Maturity
Value at Issue
= Cap
Downside Protection
Some hybrid form of both sub-types was inevitable arranged by the always “altruistic” underwriting investment banks and a floor was also introduced to the DECS’s framework. This is more popular in Europe rather than in the US and, regardless of this downside protection, rating
agencies also consider it equity because it does not imply cash redemption.
This additional feature, which is basically a “knock-out warrant” also help firms signaling stronger confidence in the future of common stock, and therefore in their firms. Naturally, issuers of these
hybrid form of mandatory convertibles will face a tradeoff between a lower cap and/or floor and a
lower dividend yield or vice versa.
3.
Literature Review and Hypothesis
Since the modest appearing of mandatory convertibles in 1988, their popularity has heavily
increased in the following years, in special during periods of recession.
The reason that seems to justify this popularity is a twofold. On the one hand, these are generally
securities that seem to help a variety of issuers to reduce costs of information asymmetry when
raising capital, avoiding, among others, the lemon’s problem. On the other hand, these securities include very flexible features, that accommodate the special circumstances and needs of its
different issuers.
New variations of these securities every year, add increasingly flexibility, better and more creative
tax treatments or simply a new way of taking advantage of market rules (e.g. recent earnings
management regulations regarding dilution of EPS), but mostly, a new fancy acronym.
Whatever the reasons that justify their popularity, mandatory convertibles have had high demand,
both from investors and issuers, and this alone justifies the effort of investment banks to constantly
rebrand these securities with new names and, sometimes, even new features.
Despite its popularity in the market, this is still a very much fragmented academic field with few
theoretical background, research, and empirical support, specifically about equity-like mandatory
convertible securities.
Chemmanur et al. (2003) provides an equilibrium theoretical model to justify the choice by
features mix (conversion ratio, cap on capital appreciation and dividend yield). This model assumes
a market characterized by asymmetric information, high costs in case of financial distress and other
capital raising alternatives such as straight equity, straight debt and ordinary convertibles. The
model foresees that, in equilibrium, firms are more likely to choose straight debt or ordinary
convertibles if the level of information asymmetry is large and the probability of default is low,
and are more likely to choose mandatory convertibles if levels of information asymmetry is lower
and probability of financial distress is higher. Since none of the conclusions were empirically
supported, I attempt to test some of the conclusions in this work.
Arzac (1997) and Ramirez (2011) presents a theoretical description of PERCS, DECS and other
mandatory convertibles, in which they explore valuation techniques and propose some
explanations to justify the choice of these hybrid securities as a mean to raise capital.
Arzac (1997) focus more on providing an historical contextualization, a description of the several
types of mandatory convertibles, and the characteristics of its issuers. In his work, Arzac (1997)
claims that firms issuing mandatory convertibles do so because these securities help them reduce
the costs of information asymmetry and the dilution associated with equity issuances, and the
typical firm issuing mandatory convertibles is highly levered, with high default risk and financial
distress costs.
On the other hand, Ramirez (2011) emphasized more the different equity-like and debt-like
characteristics, that distinguishes the several derivatives, mandatory convertibles and other
alternatives. Namely the author mentions how the conversion probability and the payment of a
principal influence the equity or debt behavior in terms of fiscal treatment and, sometimes more
importantly, the rating agencies treatment (please refer to Figure 1). The author continues by
describing the conversion mechanisms of several real life examples.
Regarding Arzac (1997) and Ramirez (2011) works, because these explanations were not
empirically supported, I will challenge some of them across this work.
Despite the scarce and, in general, outdated research on mandatory convertibles, there are
significant research about preferred stock issuance, the choice between convertible debt and
convertible preferred stock and more generally, about the choice between debt and equity.
Lewis and Verwijmeren (2011) examines how firms choose fixed income claims, the method of
comparing its features with other securities’. The authors show that the choice of fixed income claims is mostly driven by concerns regarding corporate taxes, refinancing costs and agency costs
while the method of payment choice depends mostly on reported earnings per share strategies.
Finally, they show that highly levered firms, needing extra debt capacity, usually include
mandatory conversion features.
While Lewis and Verwijmeren (2011) base their analyses on comparing offers of several different
types of securities, every time I challenge some of their hypotheses, I compare my sample with
industry averages instead. I believe this technique presents a more unbiased analysis and would
prove itself consistent every time the derived conclusions of both works points in the same
direction.
Similarly, Lee and Figlewicz (2000) study the characteristics of firms that issue convertible debt
versus firms that issue convertible preferred stock. The authors’ findings are in line with, financial distress, tax benefits, agency and optimal structure theories. Additionally, they show that the two
types of convertibles are issued by different groups of firms. The authors continue by arguing that
firms with larger non-debt tax shields and higher levels of financial, operating and default risks are
more likely to choose convertible preferred stocks. On the other hand, firms with greater free cash
flows and growth potential, compared with the first group, are more likely to choose convertible
debt.
More generally, I test my sample for other economic theories, such as financial distress and
asymmetric information problems (Stein, 1992), financial structure and signaling techniques (Ross,
1977), tax advantages of issuing debt (Modigliani & Miller, 1958) and agency costs between
stockholders and bondholders (Jensen & Meckling, 1976).
The inclusion of a mandatory conversion feature hugely impacts the conclusions derived from a
decision-making and investment standpoint. Nevertheless, when appropriate and with the
necessary adjustments, I test in this work the findings of the previously mentioned studies.
Next I present the hypothesis I will test later in this work.
3.1 Tax Benefits Hypothesis
Equity-like mandatory convertibles, usually under the form of mandatory convertible preferred
Since interest payments generate tax shields, issuers that can benefit from these should, in general,
prefer debt-like securities since they are a less expensive way to raise capital as compared to
equity-like alternatives. Conversely, firms that are not able to take advantage of tax shields from additional
interest obligations should prefer equity-like mandatory convertibles.
Lee and Figlewicz (2000) show that firms with lower levels of profits and/or firms that have lower
marginal tax rates, are less able to take advantage of direct tax benefits from additional interest
obligations, therefore they should find equity-like mandatory convertibles a less expensive way to
raise capital.
Furthermore, DeAngelo and Masulis (1980) argue that non-debt tax shields, such as depreciations
and tax loss carryforwards, can make tax shields from additional interest obligations redundant.
Similarly, Auerbach and Poterba (1987) argue that firms with high levels of non-debt tax shields
are likely to be in a “tax exhaustion state” and therefore face a close to zero marginal tax rate on additional interest obligations.
In summary, and as pointed out by Lee and Figlewicz (2000), larger depreciations should imply
lower average and marginal tax rates, which ceteris paribus, should also mean that firms with high
levels of depreciations and/or tax loss carryforwards should find mandatory convertibles a less
expensive way of raising capital.
To test this hypothesis, I use EBITDA Margin to measure the initial income positions while
avoiding potential scale effects, Depreciations standardized by the level of revenues, to measure
the level of non-debt tax shields and the Effective Corporate Tax Rate, to measure the level of
taxation. The variables used are measured with data for the fiscal year preceding the offer.
I expect that firms issuing mandatory convertibles will have lower EBITDA margins, higher
depreciations, and lower effective corporate tax rates, when compared to its industry peers.
3.2 Financial Distress Hypothesis
The financial distress hypothesis claims that firms with higher financial distress costs will prefer
to raise capital through the alternative that bears the lowest probability of default. Although
underwriting costs associated with debt financing are often lower than equity issues, these
financially troubled firms have generally weak credit profiles and/or debt covenants, which makes
As previously mentioned, equity-like mandatory convertibles become an attractive option because
these securities do not require the repayment of a principal. Moreover, they have a positive impact
in the financial leverage and in the credit profile of its issuer because they create additional debt
capacity, and provide highly flexible features that can better suit the specific needs of its issuer.
Hereof, when compared to its industry peers, overall I expect to observe that the firms in my sample
have higher bankruptcy risks, lower levels of internal funds, liquidity, solvency, and financial
stability that is, higher indebtedness and financial leverage and lower interest coverage.
To test for bankruptcy risk I follow Altman (1968) methodology and use his Z-Score indicator for
the 3 years preceding the offer. As for the levels of internal funds, I use Excess Cash Margin, for
the 3 years preceding the offer, calculated as the ratio of operating cash flow minus operating
income to revenues. Finally, to test for liquidity and solvency levels, I use a plurality of variables,
using information of the 3 years preceding the offer, and aiming to find consistent conclusions both
for the short and long-term. The selected variables for the short-term liquidity are the Current Ratio
and the Quick Ratio and for the long-term solvency, the EBIT Interest Coverage ratio, Net Debt to
EBITDA and the Debt Service Coverage Ratio. Lastly, to test for the financial stability, and overall
capital structure, I use Debt to Equity, Debt to Assets and Debt to Enterprise Value.
To the extent of the tests described above, more important than the absolute values of each variable
and their deviation to the industry peers’ averages, are the trends observed during the period preceding the offer. By observing a worsening of the financial status, one can conclude that
equity-like mandatory convertibles might have become a valid option for these firms given their increased
financial distress costs whereas they were not considered a suitable option to raise capital before.
This can also mean that mandatory convertibles are a solution of last resort for firms that exhausted
every other solution to raise capital and are struggling to survive.
3.3 Static Trade Off Theory
Complementarily to the financial distress hypothesis, the static trade off theory suggests that
whenever firms have too much debt and non-valuable tax shields, additional leverage increases can
MacKIE‐MASON (1990) shows that firms with high probability of bankruptcy prefer equity issues rather than debt because the higher costs of financial distress exceed the tax benefits of additional
debt.
As a complementary test to this theory, I isolate some of the variables used to test previous
hypothesis, namely: Depreciations, Effective Corporate Tax Rates, Altman’s Z-Score, EBIT Interest Coverage and Debt to Equity Ratio.
I expect to observe that my sample of issuers includes companies with higher levels of
depreciations and/or lower tax rates, which would show that they have limited capacity to benefit
from tax advantages from additional debt. Lower Z-Scores and Interest Coverage Ratios and higher
Debt to Equity Ratios, would show high levels of financial distress costs.
Finally, Huckins (1999) suggests that market response to equity issuances should be most positive
for firms with high levels of indebtedness and overall financial risk. I test this by comparing the
buy-and-hold 52 Week Abnormal Returns of issuers common stocks, in the period following the
offer, to issuers’ Altman’s Z-Score, EBIT Interest Coverage and Debt to Equity Ratios of the period preceding the offer. I would expect to find a negative correlation between these two variables.
3.4 Optimal Capital Structure Hypothesis
Research shows that managers tend to make decisions based on industry target benchmarks.
Specifically, the optimal capital structure theory suggests that managers tend to pursue target
indebtedness ratios, comparing their firms with its respective industry averages.
Billingsley et al. (1994) show evidence that cross-sectional differences in capital structure are
justified by industry averages. Thus, in an effort to converge to industry target levels, I would
expect that firms with higher leverage ratios, as compared to its industry peers, are more likely to
issue equity than debt.
I test my sample for this hypothesis, by comparing the deviations of my sample firms Debt to
Equity Ratios to its industry peers, in the one year following the offer to the same variable in the
3.5 Staged-Investment Hypothesis
Mayers (1998) shows that firms with sequential financing needs are more likely to issue convertible
debt. The author argues that matching the maturity of such convertibles with the time when the
firm needs a new round of financing lowers the financing costs and create extra debt capacity at
the time the firm most needs.
Equity-like mandatory convertible securities would suit even better these firms with sequential
financing needs, because with those, firms would have more predictability over financial distress
costs, which could be triggered by an early conversion with cash redemption.
Following Mayers’ argument, and as pointed out in Lewis and Verwijmeren (2011) work, unlike convertible debt, with equity-like mandatory convertible securities the timing of conversion to
equity is certain, as is the non-repayment of principal. Therefore, the extra debt capacity created
by mandatory convertibles is certain, unlike in any other type of non-mandatory convertibles.
Following the methodology of Lewis and Verwijmeren (2011), I would expect that firms with large
future investment requirements anticipate their need of new financing through the use of
equity-like mandatory convertibles.
Since future investment is not observable, I use Capital Expenditures in the year preceding the offer
as a proxy for future investment, and would expect to find higher levels of this variable for my
sample of issuers as compared with its industry peers.
3.6 Cash-Flow Shortage Theory
Earlier I hypothesized that highly leveraged companies are more likely to choose equity over debt
when raising capital and that financially trouble firms would prefer mandatory convertibles due to
its lower risk of default.
However, and as pointed out by Huckins (1999) in his work on mandatory convertibles, Ross
(1977) shows that debt levels and firm values are positively correlated because they are signaling
the market that they will be able to comply with their debt commitments.
Conversely, Miller and Rock (1985) show that external capital raising generally have a negative
This hypothesis implies that equity-like mandatory convertibles would be bad news, but since they
have often attached a high dividend yield, the negative signaling effect should be neutralized by
this form of market signaling that the firm as the capacity of fulfill this level of fixed payment.
To test the signaling effect of issuing mandatory convertibles, I look to the 52 week stock abnormal
returns in the post offer period, the offer’s dividend yield and the operating cash flows (standardized by revenues level) in the three years preceding the offer and in the year of the offer.
I expect to observe a decline in operating cash flows before the offer, which would cause the need
to raise capital, and positive correlation between the offered dividend yield and post-announcement
stock abnormal returns.
3.7 Pecking Order Theory
Akerlof (1995) and Myers and Majluf (1984) argue that, in the peaking order model, a new equity
issue is discounted by the market as a “lemon” because the market believes management has
privileged information and the stock price should be peaking.
Arzac (1997) goes further and argues that mandatory convertibles help to reduce costs of
information asymmetry, that often makes equity issues more expensive for firms with little
additional debt capacity, or financially troubled. Arzac (1997) continues by arguing that these
securities also enable firms with growth or recovery prospects to signal their confidence to the
market, avoiding this way the equity as a “lemon” problem.
In a world with information asymmetry, firms in need of external funds and aiming to maximize
shareholder’s value, would anticipate market’s response, and prefer its safest alternative available to raise capital, with straight equity being the riskiest. As equity-like mandatory convertibles are
safer than common equity, they should rank before common equity, and therefore should not be as
much discounted as the latter.
I hypothesize that, the market response in the post-offer period should be most positive when
issuer’s common equity is underpriced before the offering, showing that equity-like mandatory convertibles attenuates the lemon’s problem.
To test this, I compare abnormal returns up to three years before the offer with abnormal returns
4.
Data and Methodologies
This section presents the sample selection methodology as well a sample summary statistics
4.1 Sample Selection
Table 1 – Data Filters Summary
Data filters applied to issues of convertible securities collected from SDC Platinum. Filters include the match with information retrieved from Thomson Reuters Database (Eikon and Datastream), Compustat and SEC. Number of Events refers to the number of issuances remaining after the application of each filter
The convertible issues were retrieved from SDC Platinum Database for the years 2005 through
2015 and made by firms based in the United States of America. Table 1 shows that, in this first
stage, I obtain 2664 events from SDC Platinum database for a total of around $785 billion.
I then impose a number of data filters. The first filter reduces my sample to 2593 offers and requires
all issues to be made in US Dollars, which is in accordance with the preliminary filter imposed
directly in SDC Platinum database of only USA issuers.
Secondly, I exclude issues made by firms belonging to the financial and real estate industries, by
filtering the 2-digit SIC codes I intend to exclude (52, 53, 55 and BC). This is because convertibles
issued by financial firms are mostly synthetic products and REITS are essentially tax-exempt firms
with several restrictions on dividends payouts, which would severely bias the test of my
hypotheses. This filter reduces my sample to 1594 offers.
The third filter imposes a “mandatory conversion” flag, one of the data fields exported from SDC Platinum database. This filter leaves me with 69 remaining offers.
The fourth filter I apply imposes the existence of financial data for the three years preceding the
offer and also for the 52 weeks after the offer, both for the issuing firms and the correspondent
deals. This filter is accomplished through the match of the remaining events, and its issuers, with
data from Thomson Reuters (Eikon and Datastream) and Compustat databases. This reduces my
sample to 42 events.
Filter Phase Number of Events Filters Description
1 2664 Total number of convertible issues retrieved from SDC Platinum Database between 2005 and 2015
2 2593 Currency: Issues in US Dollars
3 1594 Non-financial Industries: Issuers with 2-digit SIC other than 52, 53, 55 or BC 4 69 Mandatory Conversion: Issues with mandatory conversion flag (SDC Platinum) 5 42 Data Availability: Events with Thomson Reuters and Compustat match
Finally, I manually screened the 42 SEC filings corresponding to the offers remaining and
cross-checked the previous applicable filters once more. This final filter reduces my sample to 31 events
totaling around $18 billion. Its summary statistics can be found in Table 3.
In order to have data I could compare my sample to, I then collected additional data for my sample
issuers’ industries from Thomson Reuters (Eikon and Datastrem) and Compustat databases. This financial data was screened by values in US Dollars and exported only for firms based in the United
States of America.
This data was further grouped by SIC code and each financial variable’s average matched with my final sample firms, for the period under analysis. The industry correspondence is presented in Table
2
Table 2 – Industry SIC Codes Correspondence
4.2 Summary Statistics
In this section I present the most relevant summary statistics for my sample of 31 equity-like
mandatory convertible securities’ offers.
Table 3 presents final sample’s summary statistics, Figure 4 plots the evolution, in terms of value, of the mandatory convertible securities issuances in the US market across the period under analysis
(2005-2015) and finally, Figure 5 adds an additional layer of detail to Figure 4, by including
industry disaggregation for both absolute and relative values.
Issuers’ Characteristics
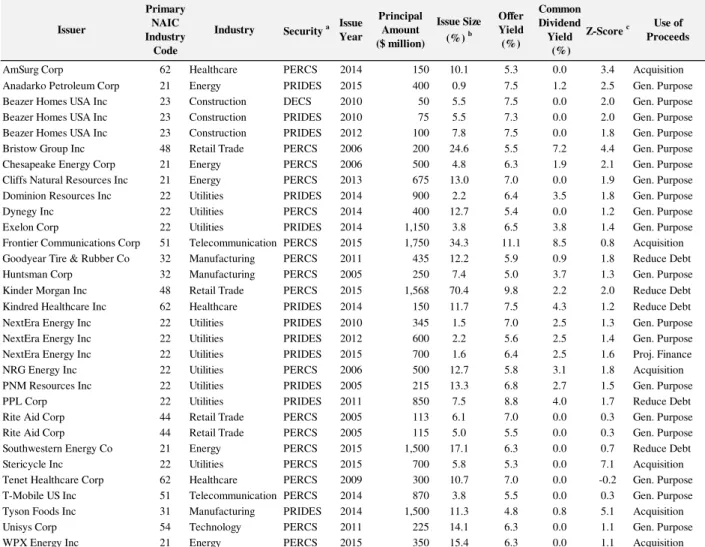
Table 3 presents the 26 firms that issued a total of 31 mandatory convertible securities in the US
market between 2005 and 2015. These issuances sum up to c$18 billion and are made of 18 PERCS,
Industry 2-digit SIC Code # Events # Issuing Firms
Energy 21 5 5
Utilities 22 10 8
Construction 23 3 1
31 32 44 48
Telecommunication 51 2 2
Technology 54 1 1
Healthcare 62 3 3
Total 31 26
3
4
3
3 Manufacturing
12 PRIDES and 1 DECS. Regarding the issuers, and bearing in mind that all financial firms and
REITS were excluded, my final sample includes 10 offers made by 8 Utilities firms and 5 offers
made by 5 Energy firms. The remaining offers were made by firms either from Construction,
Manufacturing, Retail Trade, Telecommunication, Technology or Healthcare industries. More
information about the disaggregation by industry of the offers can be found in Table 2 and Figure
5.
Issue size, compared with issuer’s market value before the offer, range from 0.9% (Anadarko Petroleum Corp) to 70.4% (Kinder Morgan inc) and its average stood at 11.4% or an average
principal of $ 569 million.
As for the dividend yields offered in these issuances, values range from 4.8% (Tyson Foods Inc)
to 11.1% (Frontier Communications Group) with an average of 6.6%. If compared with common
stock’s dividend yields, these are clearly inferior, with values ranging from 0% to 8.5%, an average of 1.8% and a median even lower of 0.9%.
In terms of credit profile, Altman’s Z-Scores depicts generally troubled firms, with values ranging from -0.2 (Tenet HealthCare Corp) to 7.1 (Stericycle Inc) and an average of 1.8, which is exactly
the breakpoint of the distress zone in terms of bankruptcy probability.
Finally, in terms of use of proceeds, the biggest slice of my sample (19 firms) claimed they intend
to use the proceeds for general purposes, which is usually perceived as investments in firm’s
liquidity (working capital, reduce short-term debt, capex, etc.), 6 firms showed intention of using
the proceeds to finance acquisitions, 5 firms to reduce indebtedness and one firm to finance an
Table 3 – Sample Summary Statistics
Final sample summary statistics. The events presented were primarily collected from SDC Platinum database and later supported with data from Thomson Reuters database (EIKON and Datastream) and Compustat. Finally, all the applicable variables were cross-checked through the corresponding SEC filings and the adjusted accordingly.
a "PERCS" stands for Preference Equity Redemption Cumulative Stock, "PRIDES" for Preferred Redeemable Increased Dividend Equity Security and "DECS" for Dividend Enhanced Convertible Stock.
b "Issue Size" equals issue's principal amount divided by market value of issuer before the offer.
c Z-Score refers to the Altman Z-Score of the last 12 months preceding the offer. The base sample utilized for the calculation of such indicator
considers a division of manufacturing and non-manufacturing firms. Generally, firms with a score above 3.0 have a low probability of bankruptcy, and those with a Z-Score of less than 1.8 have a relatively high probability of bankruptcy.
Trends in the issuance of mandatory convertible securities
Although my sample is considerably larger than those obtained in previous studies (typically less
than half the number of events of my sample), which can be a good predictor of the increase of
popularity among these hybrid instruments, my sample and period of analysis is still rather small
to enable the inference of valid industry wide conclusions.
Source: SDC Source: EIKON
Issuer
Primary NAIC Industry
Code
Industry Security a Issue Year
Principal Amount ($ million)
Issue Size (%) b
Offer Yield (%) Common Dividend Yield (%)
Z-Score c ProceedsUse of
AmSurg Corp 62 Healthcare PERCS 2014 150 10.1 5.3 0.0 3.4 Acquisition
Anadarko Petroleum Corp 21 Energy PRIDES 2015 400 0.9 7.5 1.2 2.5 Gen. Purpose
Beazer Homes USA Inc 23 Construction DECS 2010 50 5.5 7.5 0.0 2.0 Gen. Purpose
Beazer Homes USA Inc 23 Construction PRIDES 2010 75 5.5 7.3 0.0 2.0 Gen. Purpose
Beazer Homes USA Inc 23 Construction PRIDES 2012 100 7.8 7.5 0.0 1.8 Gen. Purpose
Bristow Group Inc 48 Retail Trade PERCS 2006 200 24.6 5.5 7.2 4.4 Gen. Purpose
Chesapeake Energy Corp 21 Energy PERCS 2006 500 4.8 6.3 1.9 2.1 Gen. Purpose
Cliffs Natural Resources Inc 21 Energy PERCS 2013 675 13.0 7.0 0.0 1.9 Gen. Purpose
Dominion Resources Inc 22 Utilities PRIDES 2014 900 2.2 6.4 3.5 1.8 Gen. Purpose
Dynegy Inc 22 Utilities PERCS 2014 400 12.7 5.4 0.0 1.2 Gen. Purpose
Exelon Corp 22 Utilities PRIDES 2014 1,150 3.8 6.5 3.8 1.4 Gen. Purpose
Frontier Communications Corp 51 Telecommunication PERCS 2015 1,750 34.3 11.1 8.5 0.8 Acquisition Goodyear Tire & Rubber Co 32 Manufacturing PERCS 2011 435 12.2 5.9 0.9 1.8 Reduce Debt
Huntsman Corp 32 Manufacturing PERCS 2005 250 7.4 5.0 3.7 1.3 Gen. Purpose
Kinder Morgan Inc 48 Retail Trade PERCS 2015 1,568 70.4 9.8 2.2 2.0 Reduce Debt
Kindred Healthcare Inc 62 Healthcare PRIDES 2014 150 11.7 7.5 4.3 1.2 Reduce Debt
NextEra Energy Inc 22 Utilities PRIDES 2010 345 1.5 7.0 2.5 1.3 Gen. Purpose
NextEra Energy Inc 22 Utilities PRIDES 2012 600 2.2 5.6 2.5 1.4 Gen. Purpose
NextEra Energy Inc 22 Utilities PRIDES 2015 700 1.6 6.4 2.5 1.6 Proj. Finance
NRG Energy Inc 22 Utilities PERCS 2006 500 12.7 5.8 3.1 1.8 Acquisition
PNM Resources Inc 22 Utilities PRIDES 2005 215 13.3 6.8 2.7 1.5 Gen. Purpose
PPL Corp 22 Utilities PRIDES 2011 850 7.5 8.8 4.0 1.7 Reduce Debt
Rite Aid Corp 44 Retail Trade PERCS 2005 113 6.1 7.0 0.0 0.3 Gen. Purpose
Rite Aid Corp 44 Retail Trade PERCS 2005 115 5.0 5.5 0.0 0.3 Gen. Purpose
Southwestern Energy Co 21 Energy PERCS 2015 1,500 17.1 6.3 0.0 0.7 Reduce Debt
Stericycle Inc 22 Utilities PERCS 2015 700 5.8 5.3 0.0 7.1 Acquisition
Tenet Healthcare Corp 62 Healthcare PERCS 2009 300 10.7 7.0 0.0 -0.2 Gen. Purpose
T-Mobile US Inc 51 Telecommunication PERCS 2014 870 3.8 5.5 0.0 0.3 Gen. Purpose
Tyson Foods Inc 31 Manufacturing PRIDES 2014 1,500 11.3 4.8 0.8 5.1 Acquisition
Unisys Corp 54 Technology PERCS 2011 225 14.1 6.3 0.0 1.1 Gen. Purpose
In this sense, I present below a brief analysis of some of the most flagrant industry trends during
this period which, given its statistical validity, the reader should interpret with caution and not
necessarily as universally transposable to other time periods or markets.
Figure 4 – Value of Mandatory Convertibles in the US Market (2005-2015)
As presented by Figure 4, the total value of mandatory convertible offers in the US market
increased significantly in the last 2 years of my period of analysis, adding to around 69% of total
sample issuances. Moreover, the same metric was rather small in the 2 years immediately after the
beginning of the 2008 crisis, totaling only 4%.
The evolution of values does not seem indicative of a gain in popularity across the period since
there are no defined positive trend. Nevertheless, conclusions can be biased by the financial crisis
of 2008.
Figure 5 – Value of Mandatory Convertibles in the US Market per Industry (2005-2015)
Figure 5 shows that, in addition to being the most representative industry in the mandatory
convertibles market during the period under analysis, both in absolute and relative values, the
Utilities industry is also one of the most frequent participant in this market with issuances of
693 1,200 300 470 1,510 700 675 5,120 6,968 0 1,000 2,000 3,000 4,000 5,000 6,000 7,000
2005 2006 2009 2010 2011 2012 2013 2014 2015
($ M IL L IO N )
VALUE OFMANDATORYCONVERTIBLES IN THEUS MARKETS
0 500 1,000 1,500 2,000 2,500
2005 2006 2007 2008 2009 2010 2011 2012 2013 2014 2015
($ M IL L IO N )
VALUE OFMANDATORYCONVERTIBLES IN THEUS MARKETS PERINDUSTRY
CONSTRUCTION
ENERGY
HEALTHCARE
MANUFACTURING
RETAILTRADE
TECHNOLOGY TELECOMMUNICATION UTILITIES 0% 20% 40% 60% 80% 100%
2005 2006 2009 2010 2011 2012 2013 2014 2015
(%
)
% OFMANDATORYCONVERTIBLES IN THEUS MARKETS PERINDUSTRY
UTILITIES
TELECOMMUNICATION
TECHNOLOGY
RETAILTRADE
MANUFACTURING
HEALTHCARE
ENERGY
mandatories in 7 of the 10 years analyzed. In contrast, the least participant industries are
Construction ($ 225 million) and Technology ($ 225 million).
It seems clear the existence of a structural break around 2007/2008, years in which there was no
issuance of mandatories. Moreover, it is visible the increased participation of more and different
industries from this point in time onwards, with also more and larger issuances.
5.
Discussion of Results
In this section I examine the results of the tests performed on the hypotheses presented in section
5. The hypotheses tested are sorted as following: 5.1) Tax Benefits Hypothesis; 5.2) Financial
Distress Hypothesis; 5.3) Static Trade Off Theory; 5.4) Optimal Capital Structure Hypothesis; 5.5)
Staged-Investment Hypothesis; 5.6) Cash-Flow Shortage Theory, and 5.7) Pecking Order Theory
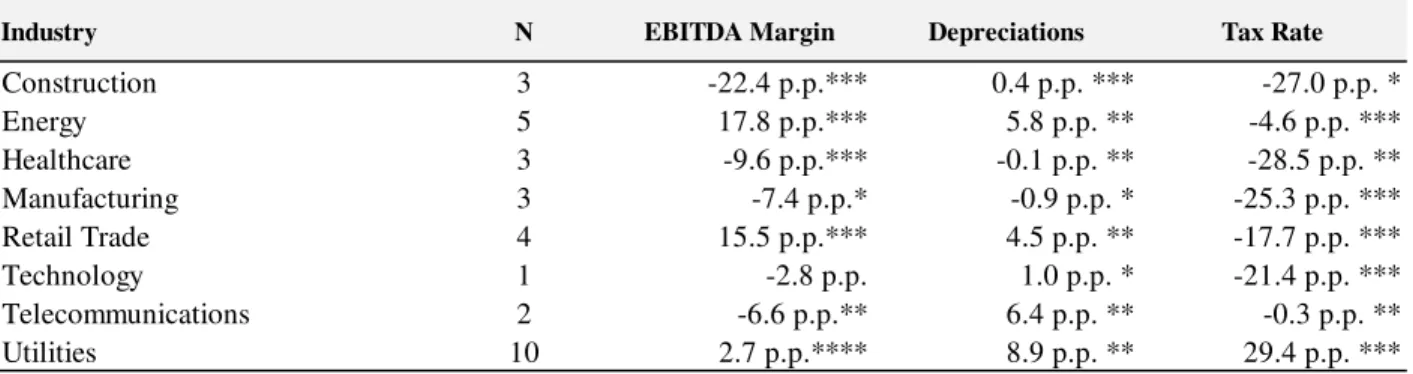
5.1 Tax Benefits Hypothesis
Larger depreciations should imply lower average and marginal tax rates, which ceteris paribus,
should also mean that firms with high levels of depreciations and/or tax loss carryforwards should
find mandatory convertibles a less expensive way of raising capital.
Table 4 – Tax Benefits Hypothesis
Deviations of sample firms averages from its industry averages using data relative to the end of the fiscal year preceding the issuance of equity-like mandatory convertible securities by the sample firms. EBITDA Margins are computed using EBITDA and Total Revenues provided by Thomson Reuters. Depreciations are Depreciation Expenses standardized by Total Revenues provided by Thomson Reuters. Tax Rates are Effective Tax Rates provided by SDC Platinum and Thomson Reuters. All deviations are calculated over arithmetic averages and blank values are not considered as an occurrence. Relative standard errors are calculated as standard error of mean divided by mean and expressed as percentage.
*** Indicates a relative standard error inferior to 10%.
*** Indicates a relative standard error between 10% and 50%.
*** Indicates a relative standard error between 50% and 100%.
The results for the EBITDA Margins are mixed and seems to suggests influence by industry
specificities since deviations’ magnitude is substantial.
Industry N EBITDA Margin Depreciations Tax Rate
Construction 3 -22.4 p.p.*** 0.4 p.p. *** -27.0 p.p. *
Energy 5 17.8 p.p.*** 5.8 p.p. ** -4.6 p.p. ***
Healthcare 3 -9.6 p.p.*** -0.1 p.p. ** -28.5 p.p. **
Manufacturing 3 -7.4 p.p.* -0.9 p.p. * -25.3 p.p. ***
Retail Trade 4 15.5 p.p.*** 4.5 p.p. ** -17.7 p.p. ***
Technology 1 -2.8 p.p. 1.0 p.p. * -21.4 p.p. ***
Telecommunications 2 -6.6 p.p.** 6.4 p.p. ** -0.3 p.p. **
Consistent with Auerbach and Poterba (1987), results for Depreciations seems to support the
hypothesis that higher non-debt tax shields, such as depreciations, play a role in how firms raise
capital. Specifically, they are more likely to choose equity-like mandatory convertible securities.
Although not shown in Table 4, data shows that deviations of sample’s average depreciations from its industry peers are most positive for industries with more weight of depreciations to revenues,
which brings more consistency to my previous conclusions.
Finally, Table 4 shows that firms with lower Effective Corporate Tax Rates, as compared to its
industry peers, are more likely to choose mandatory convertible securities. Similarly, and as it
would be expected, deviations of this variable are larger for firms with lower profit levels and
higher depreciations (except for Utilities, where although our sample shows higher profitability,
also shows higher depreciations compared to its industry benchmark).
Apart from the mixed results found in the profitability levels, these results are consistent with the
tax benefits theory and with Lee and Figlewicz (2000) previous findings.
5.2 Financial Distress Hypothesis
The financial distress hypothesis claims that firms with higher financial distress costs will prefer
to raise capital through the alternative that bears the lowest probability of default.
Bankruptcy Risk
Altman’s Z-Score is a metric commonly used as a bankruptcy predictor and, however there are other important factors to take into consideration, values for this variable below 1.8 generally
Table 5 – Bankruptcy Risk
Values for sample firms, its industry peers, and deviations of the former to the latter using data relative to the end of the three fiscal years preceding the issuance of equity-like mandatory convertible securities by the sample firms. Zscore variable refers to Altman’s Z-Score provided by Thomson Reuters EIKON. Values of Zscore below 1.8 are classified “distress zone”, between 1.8 and 2.99 “grey zone” and above 2.99 “safe zone”. Relative standard errors are calculated as standard error of mean divided by mean and expressed as percentage.
*** Indicates a relative standard error inferior to 10%.
*** Indicates a relative standard error between 10% and 50%.
*** Indicates a relative standard error between 50% and 100%.
For this metric, data shows that issuing firms are either below or close to this threshold in the year
preceding the offer. Furthermore, apart from the manufacturing, which presents very large relative
standard errors in all years, and the healthcare industry, all other issuers are below its industry
averages.
As for the change in the years preceding the offer, there is a general deterioration of this score as
closer the firms are from the issue year. This indicates a worsening of its financial situation and
most likely an increase of the financial distress costs. If we control these trends for benchmark
firms, results become more mixed, nevertheless sample firms seem to deteriorate more than its
industry peers.
These results are consistent with my hypothesis that firms with high financial distress costs prefer
to raise capital using safer securities, being equity-like mandatory convertibles our benchmark
security in this comparative analysis.
t-1 t-2 t-3 t-1 t-2
Sample 2.0 *** 2.6 ** 4.7 ** -0.6 -2.1
Bench. 4.6 ** 4.3 ** 4.6 ** 0.4 -0.4
Dev. -2.7 -1.7 0.0 -1.0 -1.7
Sample 1.6 ** 2.8 ** 3.8 ** -1.1 -1.1
Bench. 4.0 * 8.9 * 31.0 * -4.9 -22.1
Dev. -2.4 -6.1 -27.2 3.8 21.0
Sample 1.5 ** 1.3 ** 1.7 ** 0.1 -0.4
Bench. -0.4 2.1 * -0.8 * -2.5 2.8
Dev. 1.9 -0.7 2.5 2.6 -3.2
Sample 2.3 3.1 3.3 -0.8 -0.2
Bench. -2.8 -32.3 -33.8 29.5 1.4
Dev. 5.1 35.5 37.1 -30.4 -1.6
Sample 1.8 ** 2.5 ** 0.9 ** -0.8 1.7
Bench. 8.6 * 8.0 * 7.4 0.5 0.6
Dev. -6.8 -5.5 -6.6 -1.3 1.1
Sample 0.0 *** 0.0 *** 0.1 *** 0.0 0.0
Bench. 21.3 ** 18.7 ** 5.9 ** 2.6 12.9
Dev. -21.3 -18.7 -5.8 -2.6 -12.9
Sample 0.2 ** 0.4 ** 0.4 ** -0.2 0.1
Bench. 4.3 3.9 0.1 0.4 3.8
Dev. -4.1 -3.5 0.3 -0.6 -3.7
Sample 0.1 ** 0.2 ** 0.2 ** 0.0 0.0
Bench. 0.2 * 0.3 ** 0.3 ** -0.1 0.0
Dev. 0.0 -0.1 -0.1 0.1 -0.1
Financial Slack
Firms with low levels of internal funds are less likely to incur in future debt commitments due to
their greater inability to satisfy the resultant debt service obligations.
In this sense, I assume that the levels of excess cash in the years preceding the offer are a good
proxy for future availability of funds, in a scenario where firms did not raise any capital.
Table 6 – Financial Slack
Values for sample firms, its industry peers, and deviations of the former to the latter using data relative to the end of the three fiscal years preceding the issuance of equity-like mandatory convertible securities by the sample firms. Excess Cash Mg variable refers to the ratio of operating cash flow minus operating income to revenues and is presented in %. Input values to this variable are provided by Compustat and Thomson Reuters EIKON. Changes in Excess Cash Mg over the period under analysis are presented in percentage points. Relative standard errors are calculated as standard error of mean divided by mean and expressed as percentage.
*** Indicates a relative standard error inferior to 10%.
*** Indicates a relative standard error between 10% and 50%.
*** Indicates a relative standard error between 50% and 100%.
Results for this variable show both a worsening of the level of internal funds, as firms approach
the issue date, and a consistent negative deviation from its industry peers’ internal funds.
In this regard, I find support in the data for my hypothesis since firms raising funds through
securities that do not imply future cost commitments have lower levels of internal funds as
compared with industry benchmarks.
t-1 t-2 t-3 t-1 t-2
Sample 20.8 *** 50.1 ** 30.0 *** -58.5 66.8
Bench. 71.2 * 52.8 * 57.6 * 34.9 -8.4
Dev. -50.4 -2.7 -27.6 -93.4 75.2
Sample 34.3 *** 42.0 ** 43.2 ** -18.4 -2.6
Bench. 202.5 * 65.1 * 248.9 * 211.3 -73.9
Dev. -168.2 -23.0 -205.7 -229.6 71.2
Sample 11.5 *** 12.5 *** 11.5 *** -7.8 8.7
Bench. 32.0 * 48.7 * 19.8 * -34.3 146.4
Dev. -20.5 -36.2 -8.3 26.4 -137.6
Sample 4.0 *** 6.0 *** -1.2 *** -34.4 -588.7
Bench. 2516.3 479.4 585.6 424.9 -18.1
Dev. -2512.4 -473.4 -586.8 -459.3 -570.5
Sample 5.3 *** 14.3 *** 24.9 -63.1 -42.3
Bench. 2.5 ** 3.2 ** 3.8 -22.0 -14.3
Dev. 2.8 11.1 21.1 -41.1 -28.0
Sample 2.5 *** 4.7 *** 7.8 *** -47.0 -39.1
Bench. 2131.2 * 1874.3 * 588.5 * 13.7 218.5
Dev. -2128.7 -1869.6 -580.7 -60.8 -257.6
Sample 19.1 *** 42.9 ** 37.6 *** -55.5 14.0
Bench. 431.1 * 392.4 * 12.6 * 9.9 3016.0
Dev. -412.0 -349.5 25.1 -65.4 -3002.0
Sample 13.9 *** 15.9 *** 20.4 *** -12.5 -22.3
Bench. 15.1 * 28.2 * 27.4 * -46.3 2.9
Dev. -1.3 -12.3 -7.0 33.8 -25.2 Utilities
(N=10)
Telecommunications (N=2)
Technology (N=1) Retail Trade (N=4) Manufacturing (N=3) Healthcare (N=3) Energy (N=5) Construction (N=3)
Liquidity
The variables used aim to assess on firms’ capacity to fulfill short-term financial obligations (within one year), being that, by analyzing both current and quick ratios, I intend to overcome potential
biasedness introduced by inventories’ liquidity, which could differ from industry to industry and is therefore avoided by the quick ratio (also known as acid-test ratio). These metrics also bring more
consistency to my analysis of internal funds, specifically in the shorter-term.
Table 7 – Liquidity
Values for sample firms, its industry peers, and deviations of the former to the latter using data relative to the end of the three fiscal years preceding the issuance of equity-like mandatory convertible securities by the sample firms. Current Ratio variable refers to the ratio of total current assets to total current liabilities and Quick Ratio refers to the ratio of total current assets minus inventories to total current liabilities. Input values to this variable are provided by Thomson Reuters EIKON. Changes in the variables over the period under analysis are presented in absolute values. Data for construction industry is not available for these variables. Relative standard errors are calculated as standard error of mean divided by mean and expressed as percentage.
*** Indicates a relative standard error inferior to 10%.
*** Indicates a relative standard error between 10% and 50%.
*** Indicates a relative standard error between 50% and 100%.
In the year preceding the offer, although values for Current Ratio are not very clear, they are mostly
in line with the benchmark for most of the industries. On the other hand, Quick Ratio deviations
from the benchmark are more pronounced and negative, which supports my hypothesis.
As for the two and three years before the offer, both variables show a larger negative deviation
from its industry peers, which also supports my hypothesis.
Regarding the trends of these two variables over the years preceding the offer, results are mixed
for the year immediately preceding the issuance but the years before show more conclusive trends,
t-1 t-2 t-3 t-1 t-2 t-1 t-2 t-3 t-1 t-2
Sample 0.8 ** 1.1 ** 1.7 ** -0.3 -0.3 0.8 ** 0.9 ** 1.5 ** -0.1 -0.4
Bench. 1.4 ** 1.4 ** 1.5 ** 0.0 -0.1 2.4 ** 2.5 ** 2.5 ** 0.0 0.0
Dev. -0.6 -0.3 0.2 -28.2 -27.7 -1.6 -1.6 -1.1 -5.1 -40.3
Sample 1.5 ** 1.4 ** 1.6 ** 0.1 -0.1 1.6 ** 1.6 ** 1.8 ** 0.0 -0.1
Bench. 1.4 ** 1.4 ** 1.4 ** 0.0 0.0 1.8 ** 2.0 ** 1.8 ** -0.1 0.1
Dev. 0.0 -0.1 0.1 6.4 -12.9 -0.1 -0.4 0.0 13.1 -19.2
Sample 1.6 ** 1.8 1.7 -0.1 0.0 1.0 *** 1.2 1.0 -0.1 0.2
Bench. 1.8 ** 1.8 ** 1.6 ** 0.0 0.1 2.6 ** 2.4 ** 2.0 ** 0.1 0.2
Dev. -0.2 0.0 0.1 -11.1 -10.3 -1.6 -1.3 -1.0 -20.2 -3.4
Sample 0.6 *** 0.7 *** 0.7 -0.1 0.0 1.2 *** 1.2 *** 0.6 0.0 0.9
Bench. 1.5 ** 1.5 ** 1.5 ** 0.0 0.0 1.0 ** 1.0 ** 1.0 ** 0.0 0.0
Dev. -0.9 -0.8 -0.8 -4.4 -5.8 0.2 0.2 -0.4 -1.4 88.6
Sample 1.4 *** 1.2 *** 1.1 *** 0.1 0.1 1.3 *** 1.2 *** 1.1 *** 0.2 0.1
Bench. 1.4 ** 1.5 ** 1.3 ** 0.0 0.1 3.1 ** 3.3 ** 2.7 ** -0.1 0.2
Dev. 0.0 -0.2 -0.2 19.3 -2.2 -1.7 -2.1 -1.7 21.7 -9.6
Sample 1.9 * 1.0 ** 2.0 0.8 -0.5 1.5 * 1.1 ** 2.2 * 0.4 -0.5
Bench. 1.9 ** 1.8 ** 1.7 ** 0.0 0.1 2.6 ** 2.6 ** 2.4 ** 0.0 0.1
Dev. 0.0 -0.8 0.3 77.8 -55.1 -1.1 -1.5 -0.2 35.4 -59.6
Sample 0.9 ** 0.9 ** 0.8 *** 0.1 0.1 1.0 ** 1.1 ** 0.8 ** -0.1 0.3
Bench. 1.0 ** 1.0 ** 1.0 ** 0.0 0.0 1.0 ** 1.0 ** 1.0 ** 0.0 0.0
Dev. 0.0 -0.1 -0.1 7.0 9.2 0.0 0.1 -0.2 -5.7 28.5 Utilities
(N=10)
Telecommunications (N=2)
Technology (N=1) Retail Trade (N=4) Manufacturing (N=3) Healthcare (N=3) Energy (N=5)
Quick Ratio Change Current Ratio Change