Evaluation of reference genes for real-time PCR studies
of Brazilian Somalis sheep infected by gastrointestinal nematodes
Lilian Giotto Zaros
1, Luiz Lehmann Coutinho
2, Lúcia Helena Sider
3, Henrique Rocha de Medeiros
1,
Maria Rosalba Moreira das Neves
4, Camila Loures Benvenuti
4, Andrine Maria do Carmo Navarro
4and Luiz da Silva Vieira
31
Universidade Federal do Rio Grande do Norte, Natal, RN, Brazil.
2
Escola Superior de Agricultura Luiz de Queiroz, Universidade de São Paulo, Piracicaba, SP, Brazil.
3Embrapa Caprinos e Ovinos, Sobral, CE, Brazil.
4
Universidade Estadual Vale do Acaraú, Sobral, CE, Brazil.
Abstract
Precise normalization with reference genes is necessary, in order to obtain reliable relative expression data in re-sponse to gastrointestinal nematode infection. By using sheep from temperate regions as models, three reference genes, viz., ribosomal protein LO (RPLO), glyceraldehyde 3-phosphate dehydrogenase (GAPDH) and succinate dehydrogenase complex subunit A (SDHA), were investigated in the abomasum, abomasal lymph nodes and small intestine of Brazilian Somalis sheep, either resistant or susceptible to gastrointestinal nematodes infections. Real time PCR was carried out by using SYBR Green I dye, and gene stability was tested by geNorm. RPLO was an ideal reference gene, since its expression was constant across treatments, presented lower variation, and was ranked as the most stable in abomasum and lymph node tissues. On the other hand, SDHA was the most stable in the small in-testine followed by RPLO and GAPDH. These findings demonstrate the importance of correctly choosing reference genes prior to relative quantification. In addition, we determined that reference genes used in sheep from temperate regions, when properly tested, can be applied in animals from tropical regions such as the Brazilian Somalis sheep.
Key words:control genes, gastrointestinal nematodes, ovine, real-time RT-PCR.
Received: October 15, 2009; Accepted: March 30, 2010.
Gastrointestinal nematode parasitism causes severe losses in sheep production (Inghamet al., 2008). Animals respond to this infection by activating the proliferation of T Helper (TH) which secretes cytokines related to
resis-tance and susceptibility to gastrointestinal nematode in-fections (Zaroset al., 2007). The study of these and other molecules is important for understanding the mechanisms involved in immune response to gastrointestinal nematode infections.
Several methods and techniques can be used for mea-suring mRNA levels, such as real-time PCR (RT-PCR) technology, which provides sensitivity and accuracy (Gar-cia-Crespo et al., 2005). Nevertheless, several variables need to be controlled in gene expression analysis, such as the amount of starting material, RNA integrity and enzy-matic efficiency, as well as differences between tissues and cells in overall transcription activities (Vandesompele et al., 2002; Andersenet al., 2004). These controls can be
ob-tained by using internal control genes, called reference genes or housekeeping genes, whose expression should not vary among tissues or cells under investigation (Andersen
et al., 2004). An ideal reference gene is universally valid, with a constant expression level across all tissue samples, cells, experimental treatments and designs (Vandesompele
et al., 2002).
The identification of ideal reference genes in studies with ruminants, such as sheep and cattle, has been the topic of several publications from Australia, New Zealand, Can-ada and the United States (Caoet al., 2006; Jasmeret al., 2007; Smeedet al., 2007), yet little has been reported on their use in tropical cattle infected by parasites (Zaroset al.,
2007; Bricarelloet al., 2008; Regitano et al., 2008) and none in sheep. Thus the importance of analyzing whether previously reported reference genes, extensively used in studies of animals from temperate regions, are applicable to sheep raised in the tropics.
The aim of this work was to evaluate the stability of three reference genes – ribosomal protein LO (RPLO), glyceraldehyde 3-phosphate dehydrogenase (GAPDH) and succinate dehydrogenase complex subunit A (SDHA) - in
Send correspondence to Lilian Giotto Zaros. Universidade Federal do Rio Grande do Norte, Campus Universitário s/n, Lagoa Nova, Caixa-Postal 1524, 59072-970 Natal, RN, Brazil. E-mail: [email protected].
Brazilian Somalis sheep resistant and susceptible to gastro-intestinal nematode infections.
A herd of three to four-month-old Brazilian Somalis sheep were raised on native caatinga pasture at “Embrapa Caprinos e Ovinos” in Sobral, Ceará, in north-eastern Bra-zil (3°41’32” S e 40°20’53” W). The animals were kept for 98 days in pasture naturally infested with nematode larvae and without anthelmintic treatment. Individual body weight, blood and fecal samples were collected weekly. Based on mean fecal egg counts (FEC) over the 98 days, the eight most resistant animals (i.e. those with the lowest mean FEC) were classified as the resistant group, whereas the eight most susceptible (i.e.those with the highest mean FEC) were classified as the susceptible group. Tissues sam-ples from animals in both groups were collected after slaughter.
Tissue samples from the abomasum, abomasal lymph nodes and small intestine were collected immediately after slaughter, frozen in liquid nitrogen, and then transported to the laboratory, where they were maintained at -80 °C. Total RNA was extracted according to Chomczynski and Sacchi (1987), using Trizol Reagent (Invitrogen Co., Carlsbad, CA, USA). RNA concentration was assessed by spectro-photometry at OD 260 nm, purity checked by the OD 260/280 ratio, and integrity verified by denaturing agarose-gel electrophoresis. cDNA was reverse transcribed from 5.0mg of total RNA by using an oligo(dT) primer and Superscript II (Invitrogen Co, Carlsbad, CA, USA), ac-cording to manufacturer’s instructions.
Three reference genes, RPLO, GAPDH and SDHA, were tested. Primer sequences were obtained from Caoet al.(2006) for RPLO and Smeedet al.(2007) for GAPDH and SDHA. The primers were analyzed using the NetPrimer software tool site in order to avoid secondary structures, such as hairpins and loops. Primers crossed vari-ous exons to differentiate cDNA and genomic DNA ampli-fication.
Real time PCR was carried out using LightCyclerTM (Roche Diagnostics, Mannheim, Germany) and SYBR Green I (Roche Diagnostics, Mannheim, Germany), ac-cording to manufacturer’s instructions. Each sample was analyzed in a total reaction volume of 20mL, consisting of 4 ng of cDNA, 1X SYBR Green I dye, the required amount of MgCl2, and forward and reverse primers (Table 1).
Reac-tions were incubated in a LightCycler, following specific conditions for each gene (Table 1). Initial denaturation and denaturation steps were the same for all the primers,i.e.
95 °C for 5 min and 95 °C for 10 s, respectively. For each experiment, a non-template reaction was included as nega-tive-control, besides duplicates of each sample. Threshold cycle (Ct) values were determined at the same fluorescence threshold line for all the genes, and the Ct value for each sample was obtained by calculating the arithmetic mean of duplicate values.
The specificity of RT-PCR products was evaluated by melting curve analysis, agarose gel electrophoresis and di-rect sequencing of amplified products. Melting curve anal-ysis of the three genes was done within the range 70 °C to 95 °C at 0.1 °C/s. Sequencing was done using the DYEna-mic ET DyeTerminator Sequencing Kit (Amersham Bio-science, Piscataway, NJ, USA) and the ABI 3100 Auto-mated DNA Sequencer (Applied Biosystems).
Serial cDNA dilution curves were produced in order to calculate the amplification efficiency of all genes. A graph of threshold cycle (Ct)vs.log10relative copy number
of the sample from a dilution series was produced. The slope of the curve was used to determine amplification effi-ciency (Pfaffl, 2001): Effieffi-ciency = 10(-1/slope).
To evaluate the stability of reference gene expression, the geNorm tool was applied (Vandesompeleet al., 2002). geNorm uses the average pair-wise variation of a gene in relation to the other genes analyzed, with the geometric mean as normalization factor. Genes are scored by a gene expression stability value (M-value). The gene with the highest M-value,i.e.the least stable, is then excluded in a stepwise fashion until the most stable genes are determined. Before analyses, Ct values were converted into relative quantities, with PCR efficiency in mind. Genes were ana-lyzed both individually and group wise.
The General Linear Model (GLM) procedure of the Statistical Analysis System Institute (SAS, 1991) was ap-plied for variance analysis of cycle threshold (Ct) values. Comparison of Ct means was carried out using a Student’s t test. Results were expressed as arithmetic means (± stan-dard deviation and coefficient of variation) of non-trans-formed data.
All RNA samples were examined for purity, integrity and concentration before cDNA synthesis. The absorbance
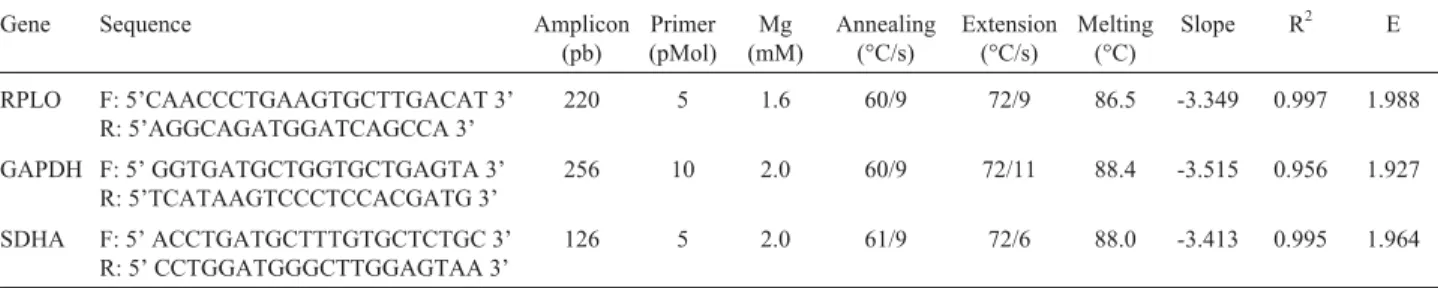
Table 1- PCR conditions and slope, correlation coefficient (R2) and efficiency values (E) for each reference gene.
Gene Sequence Amplicon
(pb)
Primer (pMol)
Mg (mM)
Annealing (°C/s)
Extension (°C/s)
Melting (°C)
Slope R2 E
RPLO F: 5’CAACCCTGAAGTGCTTGACAT 3’
R: 5’AGGCAGATGGATCAGCCA 3’
220 5 1.6 60/9 72/9 86.5 -3.349 0.997 1.988
GAPDH F: 5’ GGTGATGCTGGTGCTGAGTA 3’ R: 5’TCATAAGTCCCTCCACGATG 3’
256 10 2.0 60/9 72/11 88.4 -3.515 0.956 1.927
SDHA F: 5’ ACCTGATGCTTTGTGCTCTGC 3’
R: 5’ CCTGGATGGGCTTGGAGTAA 3’
ratios of all samples at OD260/OD280were between 1.8 and
2.0, thereby indicating that all were free of proteins or phe-nol potentially accumulated during RNA extraction.
Following real-time PCR-specific conditions, the analysis of melting temperatures, amplicon sizes and se-quencing data demonstrated the specificity of the PCR re-actions. All genes presented a single peak in the melting curve, thereby indicating the absence of primer-dimer for-mation during the reaction and amplification specificity. The melting temperatures for all the genes are presented in Table 1. According to Zaroset al. (2007), melting curve analysis is a quick method for checking RT-PCR specific-ity. Nevertheless, in some cases, the melting temperatures of RT-PCR products of different lengths are the same, therefore indistinguishable by melting curve analysis. Con-sequently, amplified products were sequenced and gene identity was confirmed to guarantee specificity.
Efficiency values obtained for real-time PCR amplifi-cation of the three reference genes ranged from 1.92 to 1.98, this indicating that amplification efficiency was near the theoretical optimum level of 2 (Wilkening and Bader, 2004). Efficiency values (E), slope values and correlation coefficients (R2) for each primer pair are shown in Table 1.
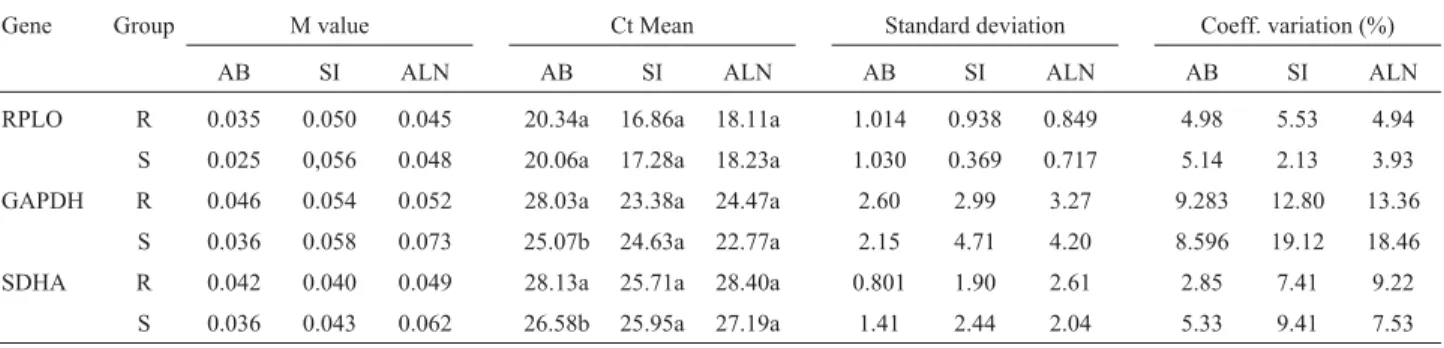
Ct values for the three tissues ranged from 16.86 to 20.34 for RPLO, 22.77 to 28.06 for GAPDH and 25.71 to 28.40 for SDHA. The lower Ct value for RPLO indicated that this gene had reached the threshold of detection with less amplification cycles than GAPDH and SDHA, and thus was more abundant in the small intestine, abomasum lymph nodes and abomasum, respectively (Table 2). The coefficient of variation in the three tissues ranged from 2.13 to 5.53 for RPLO, 8.59 to 19.12 for GAPDH and 2.85 to 9.41 for SDHA, across all the tissues and groups. The mRNA levels for RPLO were not different (p > 0.05) be-tween resistant and susceptible groups for each tissue. On the other hand, GAPDH and SDHA presented different mRNA levels in the abomasum tissue of resistant and sus-ceptible groups (p < 0.05) (Table 2).
From geNorm analysis it was inferred that all the three genes reached high expression stability with low M values (Table 2) below the default limit of M = 1.5
(Van-desompeleet al., 2002). Furthermore, RPLO was ranked as the most stable gene, followed by SDHA in the abomasum and abomasal lymph nodes, in both resistant and suscepti-ble animals. On the other hand and also in both groups, SDHA was selected as the best reference gene in the small intestine, followed by RPLO (Table 2). These differences in ranking reflect the existence of a tissue-specific metabo-lism and/or unknown tissue specific factors. The combina-tion of RPLO and SDHA was suitable, yielding a V2/3value
of 0.015 for the resistant group and 0.010 for the suscepti-ble in the abomasum, and 0.015 and 0.025 in lymph nodes, respectively. In the small intestine, the best combination was SDHA and RPLO, with V2/3values of 0.015 and 0.038
for resistant and susceptible groups, respectively, all less than the cutoff value 0.15. The V value indicates systematic variation calculated as pair wise variation, for repeated RT-PCR experiments on the same gene.
When these reference genes were analyzed in all the samples together, e.g., resistant and susceptible groups as one group, the same pattern of stability was ob-served.
Although GAPDH is widely used as an internal con-trol gene and has traditionally been considered to be univer-sal (Giuliettiet al., 2001; Bustin, 2002; Bustinet al., 2005), problems associated with its use have been pointed out (Ke
et al., 2000; Suzukiet al., 2000), as was confirmed in the present work. Zaroset al. (2007) evaluated GAPDH and RPL-19 expression in the abomasum, abomasal lymph nodes and the small intestine of cattle, both resistant and susceptible to gastrointestinal nematode infection, and as-certained that GAPDH is not suitable as a reference gene, because its expression was not constant across treatments and presented higher variation than RPL-19. Cao et al.
(2006) also observed that GAPDH was not the most stable reference gene in studies with sheep. These data are in agreement with our findings in which GAPDH presented the greatest variation compared to ribosomal protein, the latter being the most stable gene of the two, in the abo-masum and abomasal lymph nodes.
On the other hand, Garcia-Crespoet al.(2005) proved GAPDH to be the most stable gene in five out of six tissues
Table 2- Analysis of RPLO, GAPDH and SDHA reference genes in the abomasum (AB), small intestine (SI) and abomasal lymph nodes (ALN) from re-sistant (R) and susceptible (S) groups.
Gene Group M value Ct Mean Standard deviation Coeff. variation (%)
AB SI ALN AB SI ALN AB SI ALN AB SI ALN
RPLO R 0.035 0.050 0.045 20.34a 16.86a 18.11a 1.014 0.938 0.849 4.98 5.53 4.94
S 0.025 0,056 0.048 20.06a 17.28a 18.23a 1.030 0.369 0.717 5.14 2.13 3.93
GAPDH R 0.046 0.054 0.052 28.03a 23.38a 24.47a 2.60 2.99 3.27 9.283 12.80 13.36
S 0.036 0.058 0.073 25.07b 24.63a 22.77a 2.15 4.71 4.20 8.596 19.12 18.46
SDHA R 0.042 0.040 0.049 28.13a 25.71a 28.40a 0.801 1.90 2.61 2.85 7.41 9.22
S 0.036 0.043 0.062 26.58b 25.95a 27.19a 1.41 2.44 2.04 5.33 9.41 7.53
in sheep susceptible to scrapie, with SDHA in second place, whereas RPL0 was considered to be a good reference gene in mesenteric lymph nodes. According to our results, RPL0 was found to be the most stable gene in the abomasum and abomasal lymph nodes, although less stable in the small in-testine. Similarly, Bricarelloet al.(2008) used RPL-19, a member of the ribosomal protein family, to determine cytokine gene expression (IL-2, IL-4, IL-8, IL-12p35, IL-13, TNF-a, IFN-g, MCP-1, MCP-2 and glycoprotein MUC-1) in Nelore cattle with different degrees of resis-tance to nematode infection, and obtained reliable results in its use as reference. Similar results were observed by Regitano et al. (2008), also with RPL-19 as reference gene, when studying mRNA levels of cytokines related to resistance in Nelore cattle, with and withoutBoophilus microplusinfestation.
Although there are few reports on the use of SDHA as a reliable reference gene, our results suggest its usefulness as a reference gene for the small intestine from sheep in-fected by gastrointestinal nematodes. Similar results were obtained by Mulubambaet al.(2008) using SDHA as a ref-erence gene in studies with sheep infected by Mycobacte-rium avium.
Accurate normalization of gene expression levels is an absolute prerequisite for reliable results, especially when biological significance of suitable gene expression differences is studied. Relatively little attention has been paid to the systematic study of normalization procedures and their impact on studies of gene expression.
Our findings clearly demonstrate that, without prior validation, the three reference genes used in sheep from temperate regions cannot be employed in studies involving tropical sheep. We further demonstrated that in Brazilian Somali sheep infected with endoparasites, there is no single universal reference gene for all the tissues. RPLO was ranked as the most appropriate reference gene for the abo-masum and abomasal lymph nodule tissues, and SDHA as that for the small intestine. Consequently, this inherent variation has to be considered and the stability of the refer-ence genes needs to be studied in each scenario prior to any relative quantification study in order to obtain results that are as accurate as possible.
Acknowledgments
We wish to thank Marco Aurélio Delmondes Bom-fim, PhD, from Embrapa Caprinos e Ovinos. This work was supported by the Fundação Cearense de Apoio ao Desen-volvimento Científico e Tecnológico (FUNCAP) and Em-presa Brasileira de Pesquisa Agropecuária (Embrapa Ca-prinos e Ovinos). Lilian Giotto Zaros and Henrique Rocha de Medeiros received financial support from Conselho Na-cional de Desenvolvimento Científico e Tecnológico (CNPq). Luiz Lehmann Coutinho is a recipient of a CNPq research-productivity scholarship.
References
Andersen CL, Jensen JL and Ørntoft TF (2004) Normalization of real-time quantitative reverse transcription-PCR data: A model-based variance estimation approach to identify genes suited for normalization, applied to bladder and colon cancer data sets. Cancer Res 64:5245-5250.
Bricarello AP, Zaros LG, Coutinho LL, Rocha RA, Silva MB, Kooyman FNJ, De Vries E, Yatsuda AP and Amarante AFT (2008) Immunological responses and cytokine gene expres-sion analysis to Cooperia punctatainfections in resistant and susceptible Nelore cattle. Vet Parasitol 155:95-103. Bustin SA (2002) Quantification of mRNA using real-time
re-verse transcription PCR (RT-PCR); trends and problems. J Mol Endocrinol 29:23-39.
Bustin SA, Benes A, Nolan T and Pfaffl MW (2005) Quantitative real-time RT-PCR – A perspective. J Mol Endocrinol 34:597-601.
Cao H, Kabaroff LC, You Q, Rodrigues A, Boermans H and Karrow NA (2006) Characterization of ovine hepatic gene expression profiles in response toE. colilipopolysaccharide using a bovine cDNA microarray. BMC Vet Res 2:34. Chomczynski P and Sacchi N (1987) Single step method of RNA
isolation by acid guanidinium thiocyanate-phenol-chloro-form extraction. Anal Biochem 162:156-159.
Garcia-Crespo D, Juste RA and Hurtado A (2005) Selection of ovine housekeeping genes for normalization by real-time RT-PCR; analysis of PrP gene expression and genetic sus-ceptibility to scrapie. BMC Vet Res 1:746-6148-1-3. Giulietti A, Overbergh L, Valckx D, Dacallonne B, Bouillon R
and Mathieu C (2001) An overview of real time quantitative PCR: Applications to quantify cytokine gene expression. Methods 25:386-401.
Ingham A, Reverter A, Windon R, Hunt P and Menzies M (2008) Gastrointestinal nematode challenge induces some conser-ved gene expression changes in the gut mucosa of geneti-cally resistant sheep. Int J Parasitol 38:431-442.
Jasmer DP, Lahmers KK and Brown WC (2007)Haemonchos contortusintestine: A proeminent source of mucosal anti-gens. Parasitol Imunol 29:139-151.
Ke LD, Chen Z and Yung WKA (2000) A reliability test of stan-dard-based quantitative PCR: Exogenous vs. endogenous standards. Mol Cell Probes 14:127-135.
Mulubamba K, Smeed J, Gossner A, Watkins C, Dalziel R and Hopkins J (2008) Differential expression of pattern recogni-tion receptors in the three pathological forms of sheep para-tuberculosis. Microbes Infect 10:598-604.
Pfaffl MW (2001) A new mathematical model for relative quanti-fication in real-time RT-PCR. Nucleic Acids Res 29:2002-2007.
Regitano LCA, Ibelli AMG, Gasparin G, Miyata M, Azevedo ALS, Coutinho LL, Teodoro RL, Machado MA, Silva MVGB, Nakata LCet al.(2008) On the search for markers of tick resistance in bovines. Dev Biol 132:225-230. SAS (1991) Statistical Analysis System, SAS Procedures Guide,
v. 6.11. Cary Institute Inc, New York.
Smeed JA, Watkins CA, Rhind SM and Hopkins J (2007) Differ-ential cytokine gene expression profiles in the three patho-logical forms of sheep paratuberculosis. BMC Vet Parasitol Res 3:18.
Vandesompele J, De Preter K, Pattyn F, Poppe B, Van Roy N, De Paepe A and Speleman F (2002) Accurate normalization of real-time quantitative RT-PCR data by geometric averaging of multiple internal control genes. Genome Biol 3:e34. Wilkening S and Bader A (2004) Quantitative real-time
polymer-ase chain reaction: Methodical analysis and mathematical model. J Biomol Tech 15:107-111.
Zaros LG, Bricarello PA, Amarante AFT and Coutinho LL (2007) Quantification of bovine cytokine expression using real-time RT-PCR methodology. Genet Mol Biol 30:575-579.
Internet Resources
NetPrimer, http://www.premierbiosoft.com/netprimer/index.html (June 5, 2008).
geNorm, http://medgen.ugent.be/genorm (January, 2009).
Associate Editor: Bertram Brenig