DISCLOSURES AND DISCLAIMER AT THE END OF THE DOCUMENT PAGE 1/36 SEE MORE INFORMATION AT WWW.FE.UNL.PT
E
QUITY
R
ESEARCH
M
ASTERS IN
F
INANCE
After reviewing Galp’s strategy and market outlook, our FY10 price target is €14.10 per share and recommendation is to buy.
We welcome Galp’s strategic shift towards E&P now that the oil market is recovering from the present crisis and demand for oil products is expected to keep on increasing. We value proved, probable and contingent reserves in Angola and Brazil identifying and valuing major managerial flexibilities with real options.
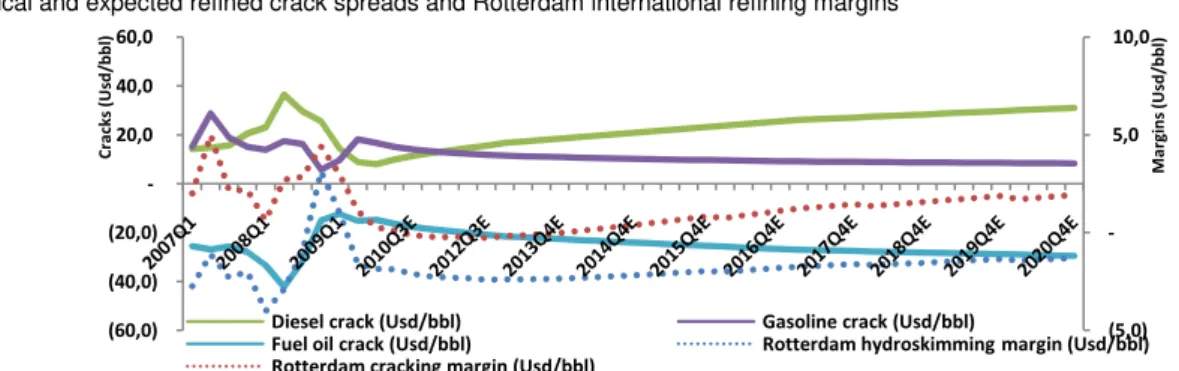
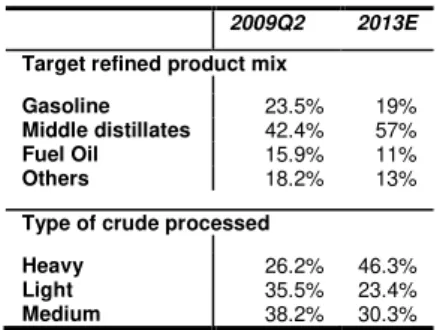
The current outlook for the refining market denotes several challenges: tightening of the gasoline/crack spread and surplus of refined products even in Iberian countries. So, we project Galp’s refining margin to be under pressure in the next year, and then start recovering yet at a slow pace as the diesel crack spread finds its ascendant path and Galp’s conversion project is concluded.
Galp will maintain its competitive advantage in the marketing segment especially in the wholesale market. The competition in the retail market was augmented by supermarkets’ entrance, however collaborative strategies are limiting their growth and preventing them from threatening supermarkets.
In G&P, the rationalization of Capex, reprogramming CCGT and cancelling wind projects, diminished the potential value of the portfolio. Regulated gas keeps contributing to cash flow’s stability.
All in all, although the current challenges and uncertainties, Galp is creating strong roots for future success with E&P providing the company’s earnings and growth momentum.
Company description
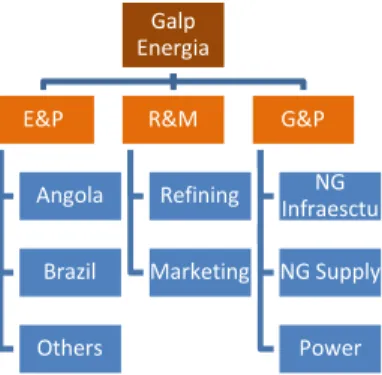
Galp Energia is a multi-energy operator with three main business segments: exploration and production (E&P); refining and marketing (R&M); and gas and power (G&P). The company main business area is R&M (leader in Portugal) being E&P the current value driver given the promising exploration portfolio held (Angola and Brasil). Additionally, Galp is also leader in domestic natural gas market and is expanding to power generation.
05
J
ANUARY2010
G
ALP
E
NERGIA
C
OMPANY
R
EPORT
OIL
&
GAS
A
NALYST
:
M
ARCO
H
ENRIQUES
[email protected]
The journey never ends
A new strategic focus in challenging yet promising times
Recommendation: BUY (High risk)
Vs Previous Recommendation Buy
Price Target FY10: 14.10 €
Vs Previous Price Target 14.10 €
Price (as of 5-Jan-10) 12.74 €
Upside potential 10.68%
Reuters: Galp:LS, Bloomberg: Galp:LP
52-week range (€) 12.95-7.22 Market Cap (€m) 10,561.46 Outstanding Shares (m) 829
Source: Bloomberg
Source: Bloomberg
(Values in € millions) 2008 2009E 2010E Sales 15,188 11,851 12,639 Operating costs (14,906) (11,069) (11,793) Operating costs RCA (14,200) (11,183) (11,761) EBITDA 282 782 846 EBITDA RCA 988 667 878
EBITDA margin (%) 2% 7% 7%
EBITDA RCA margin (%) 7% 6% 7%
Operating profit 1 457 484 Operating profit RCA 693 334 460
Operating profit margin (%) 0% 4% 4%
Operating profit RCA margin (%) 5% 3% 4% Net income (8) 345 306 Net income RCA 478 247 265 EPS (adj) 0.58 0.30 0.32
ROCE 12% 5% 5%
Net debt 1,864 2,282 3,058 Net debt/Equity 85% 96% 123% Net bebt/EBITDA 1.9 3.4 3.5 P/E (adj) 12.50 41.01 44.05 EV/EBITDA RCA 7.3 17.2 13.5 Source: Galp Energia, Analyst estimates
90% 100% 110% 120% 130%
2
3
-0
6
-2
0
0
9
0
8
-0
7
-2
0
0
9
2
3
-0
7
-2
0
0
9
0
7
-0
8
-2
0
0
9
2
2
-0
8
-2
0
0
9
0
6
-0
9
-2
0
0
9
2
1
-0
9
-2
0
0
9
0
6
-1
0
-2
0
0
9
2
1
-1
0
-2
0
0
9
0
5
-1
1
-2
0
0
9
2
0
-1
1
-2
0
0
9
0
5
-1
2
-2
0
0
9
2
0
-1
2
-2
0
0
9
0
4
-0
1
-2
0
1
0
GALP ENERGIA COMPANY REPORT
EQUITY RESEARCH 05JANUARY 2010
PAGE 2/36
Table of Contents
Executive summary ... 3
Valuation ... 3
Sensitivity Analysis ... 5
Company description ... 7
Shareholder Structure ... 8
E&P ... 8
Market Environment ... 8
Brazil ... 9
Angola ... 11
Venezuela ... 11
Other international stakes ... 12
Capital Expenditures ... 12
Valuation ... 12
R&M ...16
Market Environment ... 16
Portugal and Spain market outlook ... 17
Wholesale and Retail Markets ... 19
African Market ... 22
Capital Expenditures ... 23
Valuation Summary ... 23
NATURAL GAS ... 24
Galp activities: liberalized market ... 24
Regulated market ... 26
Regulated distribution ... 27
Regulated supply ... 27
Natural gas valuation ... 28
POWER ... 28
OUTLOOK FOR G&P EARNINGS ... 29
GROUP EARNINGS AND FINANCIALS ... 30
FINANCIAL STATEMENTS ... 32
EXHIBITS ... 33
GALP ENERGIA
EQUITY RESEARCH
E
The prese decisions recognize the comp attractive in R&M an We identi have a po Galp’s str Conseque and explo bright, na restructuri due to the conversio As to mar has priorit supermark recent ec revise dow market fo projects a Our price /share if w
V
We value assets in Nonequity shortfalls found usin time-limite the projec plausibly cash flows value of ta and strate Regarding capital. O
UCF/ oil
field NPV/oil fied Indentify options
Value real option Identify oil
fied's volatility "Extraordi
nary" Capex
Ordinary Capex
Black & Scholes
"Fair" value oil
field
Add PV debt side effects Valuation according to enterprise DCF model
Future prospects are
attractive yet challenges are substantial
Figure 1: Oil field valuation chain
Source: Analyst estimates More than ever focus is necessary
Refining environment will post main challenges
A strategic focus shift to E&P is needed
Galp’s marketing competitive advantage has strong roots
Price target of €14.10/share with an upward potential of €16.85 per share
10 years of explicit forecast period
COMPANY
05JANUA
Executive summary
esent company report aims to highlight the opp ns Galp will face looking forward in E&P, R&M an ize the coming years to be of crucial importance for pany. Still, we are sure that the roots being c ve growth rate if Galp responds wisely to the actua and focus its attention in E&P, namely in Brazil and ntify the major managerial flexibilities Galp has in positive option value that must be considered and strategic shift to E&P since it is where the main gro uently, we expect high returns as well as high risk ploration uncertainties. On the contrary, the outlo namely regarding refining margins. The years to co turing in the refining sector and Galp will be affec the surplus in Iberia of refined products. However, w sion project and the differentiation it allows, to be a k arketing, Galp has a natural competitive advantag ority access to resources: due to its refineries. Rega arkets will continue to growth yet collaborative stra economic downturn and the longer than expect
ownward Galp’s natural gas volume projections. S for both refined products and natural gas. Fina are significantly de-valued given the recent cancel ice target FY10 is €14.10/share having an upwa if we consider the value of managerial flexibilities em
Valuation
ue Galp according to a sum-of-the-parts (SOTP) m include nonconsolidated subsidiaries and othe ity financial claims comprise total consolidate lls and minorities. Regarding the E&P segment, the
sing the Adjusted Present Value (APV) method as e ited project and thus the level of debt is generally ject. Even though the length is uncertain, the exp forecasted knowing the amount of recoverable ws were discounted at the unlevered cost of equit f tax shield was measured. As oil fields have embe ategic options, the E&P segment was analysed/va
ing other areas, the discount rate used was the we Our explicit forecast period comprises 10 years –
NY REPORT
UARY 2010
PAGE 3/36
pportunities, threats and and G&P segments. We for the overall success of created will sustain an tual challenges especially
nd Angola.
in its E&P projects which nd priced. We agree with rowing opportunities are. risks due to development tlook for R&M is not as come will imply a global fected as well, especially r, we consider the current
a key success factor. tage in wholesale since it
garding the retail market, strategies will limit it. The ected recovery make us . Spain will become a key nally, Power assets and cellation of wind projects. ward potential of €16.85 embedded in oil fields.
GALP ENERGIA COMPANY REPORT
EQUITY RESEARCH 05JANUARY 2010
PAGE 4/36
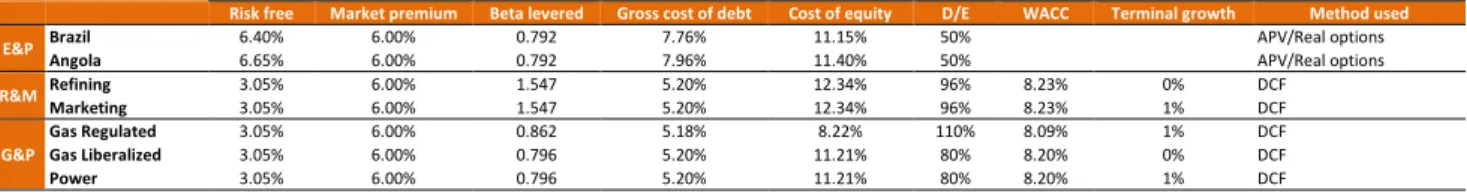
until 2020. By 2020, we expect the current projects to be fully implemented and Galp to reach a steady state, with constant growth, margins, capital turnover, and WACC. In order to assess the continuing value, we use the value driver formula1. For each segment a set of comparables was identified to find the unlevered industry beta. Regarding E&P, comparables were companies that only produced and explored petroleum offshore as they are a proxy for Galp’s systematic risk. The same applies for R&M, Gas and Power areas. The difference in terms of political risk – which is notably different among Angola, Brazil and in Europe – was considered in the risk free rate. Thus, the higher cost of equity for Angola reflects the higher political risk compared to Brazil measured in terms of the yield on national treasury long term bonds2. However, the higher political risk of Angola is compensated by the higher technological risk of Brazil. Finally, market risk premium was set in 6%, reflecting market’s inherent and future volatility in accordance with financial literature3. A special treatment must be devoted to regulated gas activities: with comparables, the weighted average cost of capital after tax is 6.32%. However, to the extent that regulatory risks are not customary in the overall equities market, it may be argued that regulatory risks will not be incorporated into the market’s estimate of required return. Thus, regulatory risk would be a form of non-diversifiable risk that would need to be compensated for in addition to our 6.32% estimation. These risks include: disallowance of capital expenditure and of certain costs incurred in the operation of the business; asymmetric expectations relating revenues; and discretionary behaviour of the regulator. These requires setting a target return under regulation higher than the required return implied by CAPM to compensate investors for the expected loss due to regulatory risk4. Regarding cost of debt, we rely on Galp’s historical average effective interest rate; default premium actual and expected; and current and forecasted capital structure for each area (interest bearing debt-to-equity). Table 1 – Valuation assumptions5
1 !
" ## $ %& '" ##(; * ++ , -./0 -.0 =>12? 2< #48: 49 5123 62 2789:;: 823:5<1234$2 5123 62 2789:;: 823:5<
2
10Y “Letra do Tesouro Nacional” for Brazil and 10Y “Obrigações de Tesouro Angola” for Angola (some analysts use the 5Y since it is more liquid). The difference in terms of the risk free rate also reflects the different inflation rate among countries: Europe, Brazil and Angola
3
Cf. Mehra, R.; and Prescott, E. C. “The equity premium in retrospect”; Handbook of the economics of Finance; 2003
4@&A
:(32$B94 :5> C DE
CF % @&A:(# GHC DE
CIJK% 0% H N:; O=>1 P Q+ R + Q; OS2$ A AT ++ U + ; OV:? Q + * Q R + , ; N:
WA , , A P X Y Q +XA AT U Y R A P A A. Historically for Galp, out of what is invested, 85% is considered and the remaining 15% is not allowed by the regulator (Source: ERSE). This includes ongoing fixed assets. Finally the discretionary component is fixed at 0.7%. So, the post-tax cost of capital comes: @&A:(32$B94 :5> CDE
CF % @&A:(# GHC DE
CIJK% 0% H N: [\%% 6.32% H \%% 0 H 0.7% 8.09%
5 Cost of equity and cash flows in E&P are denominated in US dollars assuming an annual inflation rate of 2% as to update lifting and other operational costs
and beta and cost of equity are unlevered, whereas for R&M and G&P they are denominated in European € assuming and inflation rate of 2%. For those, the risk free rate corresponds to the 10-year German Eurobond and the implied effective tax rate is 25%. The terminal growth rate is presented in real terms. Regarding D/E assumed, it is substantially smaller than actual and projected for the near future, since the actual high leverage is a consequence of large investments in a period of tight profitability and earnings. Thus, D/E is projected to converge to the mentioned targets.
Risk free Market premium Beta levered Gross cost of debt Cost of equity D/E WACC Terminal growth Method used
E&P Brazil 6.40% 6.00% 0.792 7.76% 11.15% 50% APV/Real options
Angola 6.65% 6.00% 0.792 7.96% 11.40% 50% APV/Real options
R&M Refining 3.05% 6.00% 1.547 5.20% 12.34% 96% 8.23% 0% DCF
Marketing 3.05% 6.00% 1.547 5.20% 12.34% 96% 8.23% 1% DCF
G&P
Gas Regulated 3.05% 6.00% 0.862 5.18% 8.22% 110% 8.09% 1% DCF
Gas Liberalized 3.05% 6.00% 0.796 5.20% 11.21% 80% 8.20% 0% DCF
Power 3.05% 6.00% 0.796 5.20% 11.21% 80% 8.20% 1% DCF
Regulatory risk not priced by CAPM, yet non-diversifiable
Valuation betas found with segment specific
comparables
Political risk is a major source of risk
Regulatory risk comes in addition to the market’s estimate cost of capital
Source: Analyst estimates Cost of debt and debt to equity ratio reflects target future capital structure
GALP ENERGIA COMPANY REPORT
EQUITY RESEARCH 05JANUARY 2010
PAGE 5/36
Concerning non-operating assets, we consider nonconsolidated associates that include investments in international pipelines, oil and refined products storage and non-consolidated natural gas investments. Galp regularly receives dividends coming from these investments. Therefore, after finding an appropriate forecasting dividends driver, the Gordon Dividend Growth Model6 was applied. The discount rate used in the model is the weighted average cost of capital of which the investment refers to, i.e., investments in natural gas associates are discounted with the discount rate for that area. Regarding non-equity financial claims, net debt consists of interest bearing debt net of operating cash. Pension shortfalls were estimated according to the assumptions and forecasts provided by Galp.
Based on our estimations we value Galp as €14.10 per share, without flexibility. Table 3: SoTP Valuation
1
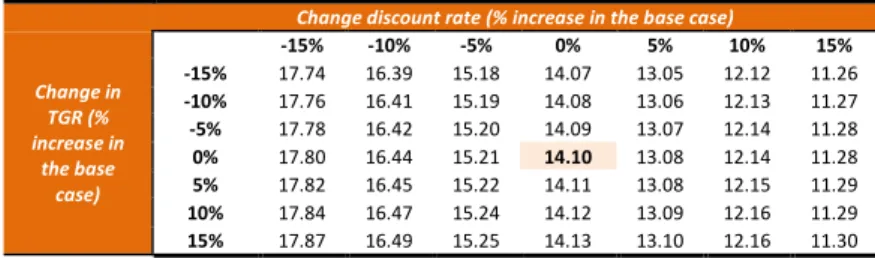
Sensitivity analysis
We consider four main factors that can influence greatly our price target: discount rate and terminal growth rate; Brent prices and exchange rate ($/€). Other risks could be considered, however these reflect much of Galp’s major uncertainties. If the discount rate increases due to an increase in cost of debt or equity, our price target tends to decrease. The increase in cost of debt, usually due to an higher D/E and consequently default premium, does not lead directly to an increase in
6
c ∑:i & '3V:1ef ,(H&3ef V:1h%& '$($(%& '3ef (h
7 Economic value presented represents value for Galp considering its share in each project. Figures in € Million
Table 2: Equity investments forecasting drivers
Equity Investments
Forecasting driver
CLH R&M Sales
CLC R&M Sales
International
pipelines NG Sales SetGás NG Sales
Others Consolidated
sales
€ Million EV7
% fo EV EV/EBITDA 10E €/Per Share Valuation method
Angola
Block 14 447.54 0.54 APV/Real options
Block32 623.88 0.75 APV/Real options
Block 14K-A-IMI 100.01 0.12 APV
Interest tax shield 123.05 0.15 APV/Tax shield effect
Brasil
Tupi (BM-S-11) 2,168.41 2.61 APV/Real options
Iara (BM-S-11) 1,316.08 1.59 APV/Real options
Bem-te-vi (BM-S-8) 279.27 0.34 APV/Real options
Caramba (BM-S-21) 146.31 0.18 APV/Real options
Júpiter (BM-S-24) 665.05 0.80 APV/Real options
Interest tax shield 927.61 1.12 APV/Tax shield effect
Exploration and production 6,797.13 49% 31.91 8.20
Refining 1,830.04 13% 2.20 DCF
Marketing 2,534.63 18% 3.06 DCF
Refining & Marketing 4,364.67 31% 10.29 5.26
Gas 2,570.63 18% 3.10 DCF
Supply 1,297.23 1.56 DCF
Infrastructures 1,273.40 1.54 DCF
Power 172.34 1% 0.21 DCF
Gas & Power 2,742.97 20% 14.77 3.31
Total EV 13,904.77 16.77
Net debt FY10e 2,560.98 3.09 Pension shortfalls FY 10e 279.01 0.34 Minorities FY10e 28.08 0.03
Associates 656.14 0.79 Dividends Growth Model
27% EMPL - Europe MaghrebPipeline, Ltd 286.58
33% Gasoduto Al-Andaluz, S.A. 44.70
49% Gasoduto Extremadura, S.A. 59.16
65% CLC - Companhia Logística de Combustíveis, S.A. 98.50
5% CLH - Compañia Logística de Hidrocarboros, S.A. 63.98
45% Setgás, S.A. 74.01
41% Tagusgás, S.A. 29.20
Equity 11,692.85
# Shares (m) 829.25
Per share 14.10
Variables chosen embody many of the uncertainties faced by Galp
Discount rate has a great impact in Galp’s value
Source: Analyst estimates
Managerial flexibilities can boost value, in addition to the €14.10/share, up to
€2.75/share
GALP ENERGIA COMPANY REPORT
EQUITY RESEARCH 05JANUARY 2010
PAGE 6/36 1,49
1,51 1,53 1,55 1,57 1,59
1
W
3
W 2M 4M 6M 1Y
1
8
M 3Y 5Y 7Y 9Y
1
5
Y
€
/U
sd
Forward exchange rate
the discount rate: only if the marginal cost (bankruptcy and financial distress costs) is higher than the marginal benefit (cost of debt smaller than cost of equity). Cost of equity can increase due to investors’ risk perception change relating to assets. Terminal growth rate affects slightly our price target, since, only in natural gas, power and marketing a terminal growth rate was assumed yet small reflecting market’s maturity, but for natural gas distribution given its early stage. As oil fields are time limited and refining market is stagnated, we assume no growth rate. Table 4: Galp’s price target for different discount rates and terminal growth rates (TGR)
Change discount rate (% increase in the base case)
Change in TGR (% increase in
the base case)
-15% -10% -5% 0% 5% 10% 15%
-15% 17.74 16.39 15.18 14.07 13.05 12.12 11.26
-10% 17.76 16.41 15.19 14.08 13.06 12.13 11.27
-5% 17.78 16.42 15.20 14.09 13.07 12.14 11.28
0% 17.80 16.44 15.21 14.10 13.08 12.14 11.28
5% 17.82 16.45 15.22 14.11 13.08 12.15 11.29
10% 17.84 16.47 15.24 14.12 13.09 12.16 11.29
15% 17.87 16.49 15.25 14.13 13.10 12.16 11.30
The most relevant variable seems to be the exchange rate. When the exchange rate increases, meaning that US dollar depreciates, our price target decreases. Conversely a valorisation of the US dollar leads to an increase in our price target. So, the stronger the dollar, the higher is our price target. A significant portion of Galp’s costs and revenues are generally denominated in or tied to US dollars. Moreover, changing the exchange rate indirectly changes oil prices since they are denominated in dollars and so the effect is magnified. For the next year exchange rate is expected to stabilize around $1.51 per €1. Then, US dollar is expected to further depreciate as signals regarding the recovery of US economy are still weak. We have incorporated this forward exchange rate in our model assuming a long term exchange rate of $/€ 1.54. On the other hand, the effect of changes in Brent prices seems to be weaker. Actually, effects are greatly balanced by the nature of Galp’s activities, in fact, they provide a natural hedging to changes in energy prices. An increase in the price of Brent leads to an increase in revenues from E&P that eventually will be offset by the increase in raw materials’ prices (crude oil used in Galp’s refineries; natural gas purchases; deterioration of the international refining margin). Thus, the effect is balanced. When Galp had a smaller exposure to E&P, stock prices were more affected by changes in oil prices. Nowadays, the high exposure to E&P made Galp more dependent on the strength of dollar8. Table 5: Galp’s price target for different Brent prices and Exchange rates.
Change Brent Prices (% increase in the base case)
Change $/€ (% increase in the base
case)
-15% -10% -5% 0% 5% 10% 15%
-15% 17.58 17.42 15.92 16.41 16.23 22.64 15.72
-10% 16.54 16.42 14.81 15.55 15.43 14.15 15.03
-5% 15.62 15.53 13.69 14.78 14.70 13.48 14.42
0% 14.78 14.73 12.36 14.10 14.06 13.15 13.87
5% 14.02 14.00 10.14 13.47 13.49 12.81 13.37
10% 13.33 13.34 9.88 12.91 12.83 12.46 12.91
15% 12.70 12.74 9.57 12.39 12.44 12.11 12.50
8 The market is now becoming aware of this. In fact in the last three years, the correlation between changes in Galp’s stock prices and changes in Brent’s
prices was 0.503 (p-value: 0.086); whereas the correlation with changes in exchange rate was 0.933 (p-value: 0.040). Source: Bloomberg and Galp Energia.
Graph 1: Forward €/Usd Exchange rate
Source: Bloomberg; as of 14 December, 2009
Source: Analyst estimates
Source: Analyst estimates Changes in TGR slightly affect our price target
GALP ENERGIA
EQUITY RESEARCH
Galp Energia
E&P
Angola
Brazil
Others R&M
Refining
Marketing G&P
NG Infraesctu
NG Supply
Power
50 223 223
519 1903
2006 2007 2008
Million boe
Reserves proved and probable
Contingent resources Angola
Contingent resources Brazil
C
Founded Galp is o presented with oper Production Through t offshore a yet mainly extent in reserves1 responsib the exten rates incre developm 14 in Ang and Mato Portugal. Matosinho conversio medium d Galp prod project, it and retail enhanced more than Spain. Aft the sourc gas; the liberalised power, th installed e portfolio b R&M prov main focu 13. G&P, Near chal
9 Cubic metres
10 Billion barrel of oil equivalent
11 Potentially recoverable from known accumulations 12 Thousand barrels of oil per day
13 Refined products include: Naphtha (3%); Gasoline
proportions of the total production, in 2008 .Naphtha,
Table 6: E&P; R&M and G&P KPIs
2006 2007 2008
Average working interest production (kbbl/d)
9.5 17.0 15.1 Products processed
(Million tonnes) 14.7 13.8 13.1 Refined product
sales (Million tonnes) 16.2 16.0 16.0 Sales to direct
clients (Million tonnes) 9.0 9.4 9.6 Natural gas sales
volumes (Million m3 9) 4,596 5,377 5,638
Number of natural
gas clientes ('000) 757 816 868 Electric power
generation (GWh) 577 594 489
Figure 2- Galp’s organizational chart
Figure 3: Galp resources base according to its stake in exploration projects in which it is involved
Source: Galp Energia
Source: Galp Energia
Source: Galp Energia
20%
55% 25%
E&P R&M G&P
Source: Galp Energia
Graph 2: Share of business segments in Galp’s operating profit RCA (2008)
COMPANY
05JANUA
Company Description
d in April 1999 following the restructuring of the ene one of the major Portuguese economic groups ted with major growing opportunities. Galp is an perations covering primarily three business seg
tion (E&P); Refining and Marketing (R&M); and h the E&P segment, Galp explores and produces e and onshore oil fields. It comprises more than 37 inly focused in Brazil and Angola. Developments in
Angola, boosted Galp’s resource base to 2.1 bil 11. Tupi’s discovery by the end of 2007 early sible of this enlargement. Development started in
ended well test (Tupi’s EWT) performance has b creasing to 20 kbbl/d12 from 14 kbbl/d at the very
ments in Brazil, currently Galp’s entire oil produc ngola: working interest production of 15.1 kbbl/d in atosinhos refineries, Galp processes all product
l. Sines’ refinery has current distillation capacity of hos is smaller with 90,000 bbl/d. Both refineri ion project aiming to convert heavier fractions of distillates13. Actual production is not refined in roduces heavier oil than what it refines, howeve
it can start refining heavier crude. Marketing activ ail sale of refined petroleum products. Spanish activ ed by Galp’s acquisition of Exxon’s and Agip’s Iber
an 450 service stations to Galp’s network - 80% o After 2005 Natural Gas business reorganization, Ga rcing of natural gas through long term contracts; e supply to large industrial customers and to a ed market; and regulated distribution through its s the existing portfolio consists of four cogenerati d electrical capacity of over 180 MW. Portcogeraç o by the end of 2009 and other projects are being c rovides the highest contribution to the operating pro cus of the group receiving almost 50% of estimat P, namely regulated activities, continues a source allenges are related with the financing of the ambit
ns but not currently considered to be commercially viable
ine (22%); Aromatics (3%); Diesel (37%); Jet (6%); Fuel oil (17%); and o ha, Gasoline and Aromatics are light; Diesel and Jet are medium; and Fu
NY REPORT
UARY 2010
PAGE 7/36
energy sector in Portugal, ups and one of the few n integrated oil company egments: Exploration & d Gas & Power (G&P). es oil and natural gas in 37 worldwide oil projects, in Brazil, and to a lower llion boe10 of contingent rly 2008 was the main in March of 2009. So far been positive, with flow ry start. In spite of these uction comes from Block in 2008. Through Sines ucts that are refined in of 220,000 bbl/d whereas eries are now under a of crude oil into light and in Galp’s refineries since ver after the conversion tivities include wholesale ctivities were substantially erian subsidiaries adding of which was located in Galp’s activities comprise ts; the storage of natural anyone entitled to the s subsidiaries. Regarding ation plants with a total ração will join the current g considered. Historically, rofit, however E&P is the ated CAPEX from 2009-ce of cash flow’s stability.
bitious investment plan.
GALP ENERGIA
EQUITY RESEARCH
0 2 000 4 000 6 000 8 000 10 000 12 000
1980 1990 2000 2010E 2020E 2030E
M
b
o
e
/d
China and India Rest of non-OECD
OECD
S
Amorim E company’ through P freely in E From thos state-own equity. Am which reg may be s 2011 onw the agree sold in c agreemen debt/EBIT sharehold capital inc look-up, it After that, however t stake of E
E
Oil compa manage a market re and gas m
explain
M
Countries economic IEA14, prim However, recover a primary en and 2030, 40%. Fos they will
14 International Energy Agency, “World Energy Outlo 15 Million barrels of oil equivalent per day
33,34%
33,34% 1,00%
7,00% 25,32%
Amorim energia Eni Caixa Geral de Depósitos Parpública Free Float
Graph 3: Shareholder structure as of 31 December 2008
Source: Galp Energia
Will the oil market recover quickly?
Graph 4: World primary energy demand
Source: IEA World Energy outlook 2009 Sonangol and Petrobras could be interested in a capital increase
COMPANY
05JANUA
Shareholder structure
Energia and Eni are the two main shareholder ny’s equity. Portuguese state controls 8% of the c
Parpública or indirectly through CGD. The rema n Euronext. 80% of the free float is controlled by hose, 91% are international. We highlight the releva
wned oil company (Sonangol) has through its 4 Amorim Energia, CGD and Eni are parties of a s egulates a number of aspects covering the terms o
sold during a lock-up period up to 31 December nwards any party may sell its holding in full. Even a eement entails CGD with preferential rights to acqu case other shareholders want to sell their st ent establishes payout of at least 50% of ne ITDA ratio does not exceed 3.5. In order, to fund i olders agreed to a fixed dividend €0.2 per share increase was required to strengthen Galp’s financ
it would be extremely difficult for all parties to a at, we believe that the only part interested could b
r there has been news that Petrobras could be in f ENI. We expect further developments on this.
Exploration & Production (E&P)
panies’ success does not depend solely on their e attractive projects, rather it is much more depend
responds to the current uncertainties. We start wit s market. Then, major exploration areas are analy in our valuation approach and finally, we provide ou
Market environment
ies’ energy consumption current slowdown was mo ic slowdown and the raising uncertainty about th rimary energy consumption in 2009 is projected to er, under current economic policies, demand will and will return to its long-term upward trend. Ac energy demand is expected to increase by 1.5% p 30, from around 12,000 Mboe/d15 to 16,800 Mboe/d
ossil fuels will continue to supply most of the boos account for 77% of the increase in world primar
tlook 2009”, 10 November
NY REPORT
UARY 2010
PAGE 8/36
ders with 33.34% of the company either directly, maining capital is traded by institutional investors. evant stake that Angola’s 45% stake in Amorin’s a shareholder agreement on which shares in Galp er 2010. From 1 January n after the lock-up period, quire all or part of shares stake. The shareholder net profit, provided Net d its investment program, re between 2009-13. If a ancial position during the arrive at an agreement. d be Sonangol. Recently, interested in buying the
eir mastery to identify and endent on how well the oil with an overview of the oil alysed. Subsequently, we our summary valuation.
GALP ENERGIA
EQUITY RESEARCH
0 100 200 300 400 500 600
2
0
0
0
2
0
0
1
2
0
0
2
2
0
0
3
2
0
0
5
2
0
0
5
2
0
0
6
2
0
0
7
2
0
0
8
2
0
0
9
E
B
il
li
o
n
d
o
ll
a
rs
0 50 100 150 200 250 300
B
il
li
o
n
b
a
rr
e
ls
Saudi Arabia Iran
Iraq Kuwait
Venezuela United Arab Emirates Russian Federation Kazakhstan
demand i
and 105 M responsib for 93% o evolution 15 years to be main lower path In 2010 e 2030. Acc additional Saudi Ara revise dow 2008: a re the increa million an million an fields17. G and socia the majori 1998 Iran, to produce to social c Given this of “clean” portfolio w areas: Bra
B
In May 2 reservoir tests indic appraisal consortium Caramba Carioca-S announce that aroun
16 Million barrels of oil per day
17 Source: Foreign Policy; “Petróleo – O longo adeus 18 Source: Foreign Policy; “Petróleo – O longo adeus
Table 7: Brazil gross reserves and expected year of production
Gross reserves (Mboe)
Expected year of production
Tupi (BM-S-11) 6,500 2010 Júpiter (BM-S-24) 3,400 2014 Iara (BM-S-11) 3,500 2013 Bem-Te-Vi (BM-S-8) 1,400 2014 Caramba (BM-S-21) 1,000 2014
Graph 5: Worldwide upstream oil & gas capital expenditures
Source: IEA World Energy outlook 2009
Graph 6: Word Proved Oil reserves
Source: BP world oil outlook
Political risk will be a major driver of the industry’s growth
Galp has stakes in five important fields in the pre-salt area
Source: Analyst estimates
COMPANY
05JANUA
d is expected to increase from 85 Mbbl/d16 in 200 5 Mbbl/d in 2030. Estimations are that the transp sible for 97% of the increase in oil use. Non-OECD of the increase while in OECD demand will be fla n is astonishing. In 1995 the Chinese market used rs ahead, China consumed 8 Mbbl/d and a similar g aintained. So, demand is expected to grow in the f ath than previously as a consequence of the actual existing oil fields will mature and they will fall b ccording to IEA, in order to balance the decline al capacity of 45 Mbbl/d - equivalent to four times rabia – is needed. Yet, the lower oil prices of 200 downwards global upstream oil and gas budgets fo
reduction of over $90 billion. The decrease in inve rease in costs. In the 90s a “mega project” cou and $1,000 million. Today, the same project would and $10,000 million since recoverable reserves ar Given that 15 of the 20 major oil companies are sta cial conflicts will drive the evolution of energy ma jority of proved reserves are in potentially instable re an, Iraq, Nigeria and Venezuela produced 12.7 Mbb uce 18.4 Mbbl/d in 2008. Instead of that, they prod l conflicts, war and inadequate investments and pro his outlook and despite the rising environmental co
n” energies, oil and gas market will continue to pros will comprise significant value. Galp aims to focus Brazil, especially in pre-salt Santos Basin; Angola; a
Brazil
2008, partners in BM-S-8 announced that the 1 ir had proved oil reserves in the pre-salt on the San dicated an API gravity of 25-28 similar to others in al well was scheduled for 2009, however due tium is planning it for 2010. We assume gross rese ba discovery was announced in December 2007. I Sugarleaf with 1.0 billion boe of reserves. In Nove ced that Tupi had reserves between 5-8 billion bo ound 85% of these reserves are oil and around
us”; November/October 2009; Number 12 us”; November/October 2009; Number 12
NY REPORT
UARY 2010
PAGE 9/36
008 to 88 Mbbl/d in 2015 sportation sector will be CD countries will account flat. In China, oil demand sed 2.5 Mbbl/d, less than r growth rate is expected e future even though at a al economic slowdown. l by roughly two-thirds in
e from existing oil fields, es the actual capacity of 008 led oil companies to for 2009 as compared to vestments contrasts with ould cost between $500 uld cost between $5,000 are in much demanding state owned, political risk arkets. Especially since regions. For instance, in bbl/d. Expectations were roduced 10.2 Mbbl/d due production decisions18. concerns and the advent
rosper. Thus, Galp’s E&P us on three geographical
; and Venezuela.
GALP ENERGIA COMPANY REPORT
EQUITY RESEARCH 05JANUARY 2010
PAGE 10/36 0
500.000 1.000.000 1.500.000 2.000.000 2.500.000
1 5 9 13 17 21 25 29 33 37 41 45 49 53
P
ro
d
u
ct
io
n
K
b
b
l/
d
Year after the discovery
Petrobras Historic Bacia de Campos Historic Campos Deepwater Historic Pre-Salt forecast
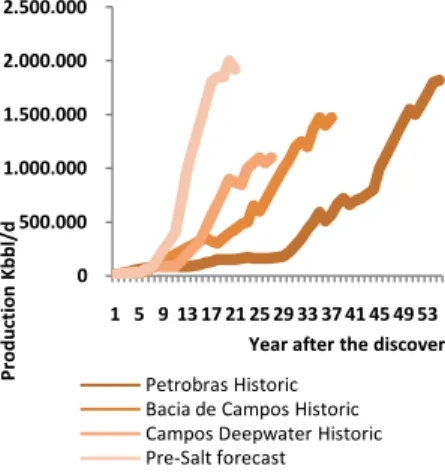
assume recoverable reserves of 6.5 billion boe. Petrobras started a long term production test (EWT) on Tupi in March 2009 that will last for 15 months. After this, a pilot project is scheduled to begin in year end 2010 with an annual average production of 100 kbbl/d and 4 million cubic meters of gas. Although the strong results of EWT, recoverable reserves were not updated upwards since the recovery factor (assumed to be between 25-30%) was not possible to increase given the nature of the sand, the permeability of soil and the crude19. The BM-S-11 partners announced the Iara discovery in August 2008 with an average API gravity of 30º. Further drills are currently being made to evaluate deeper horizons for it. Development is thought to be similar to Tupi. Jupiter discovery, in January 2008, is believed to contain large natural gas and condensate reserves. Wells drilled provided positive information regarding its feasibility. The consortium approved an initial evaluation plan and expects to drill an appraisal well in 2010. We assume reserves of 3.4 billion boe. Jupiter field is of the same nature as Tupi, however, it is likely to have a lower unit value since: the gas price will trade at a discount to oil; the development is likely to take place later than Tupi; and production will be at a lower extraction rate and over a longer period than Tupi. We estimate Capex according to operator’s projections and field’s complexity. Galp’s onshore Brazil operations are smaller. Most of Galp’s onshore Brazilian fields are owned 50% by Galp and 50% by Petrobras, being Galp the operator on much of them. Galp sees this onshore activity as a way of strengthen its partnerships with Petrobras and as a field training experience. No substantial developments are expected in this area for the next four years.
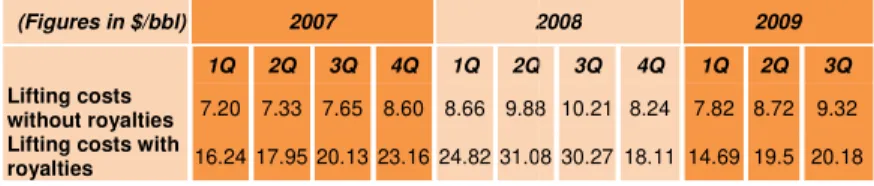
Petrobras is one of the most efficient companies exploring oil in deepwater and the one with the highest share in deepwater production. Thus, Galp benefits from Petrobras’ know-how and cost efficiency. In fact, Petrobras has been improving its production process and achieving maximum production faster than before while controlling lifting costs. Compared to major oil companies20, Petrobras’ F&D costs are very competitive and it has kept costs low despite the recent oil discoveries in unconventional areas. According to IEA, pre-salt is forecasted to be the area with the highest production efficiency compared to actual producing oil fields. Based on this forecasts and on the features of each block, we estimate F&D costs, lifting costs and royalties, updated at the expected inflation rate over the life of the reserves. The life of the reserves was estimated according Petrobras’ projections for the pre-salt area. For instance, in Tupi the EWT test started on March 2009. The pilot test is expected to be in line by December 2010. Maximum production (4,000 kbbl/d) is expected to be achieved by 2017.
19
In the North sea, when some fields were at the stage of the Santos basin, the recovery factor was assumed to be 20% - 25% similar to the one of Tupi, and there are fields that have already recovery factors of about 50%.
20
Total; ENI; BP; Chevron; Shell; ConocoPhillips; Pioneer; Marathon; Occidental; Murphy; Apache; BG; Hess; Devon; ExxonMobil; Lukoil; PetroCanada; Woodside; Murphy; StatoilHydro; and Anadarko
Blocks
Galp Capex(200 9-13)
Galp Capex (2009-20)
Brasil
Tupi (BM-S-11) 689.14 1,028.57 Iara (BM-S-11) 325.71 814.29 Bem-te-vi (BM-S-8) 70.80 1,045.21 Caramba (BM-S-21) 47.20 1,600.00 Júpiter (BM-S-24) 107.14 2,142.86
Total 1,240.00 6,630.93
Table 8: Estimated Capex (Million €)
2009 2010 2012 2017
1º-Oil-EWT (Mar/09)
1º Oil –
Pilot-test (Dez/10) production Maximum Source: Petrobras Business Plan, 2009-13
Source: Petrobrás; Galp Energia; Analyst estimates
Figure 4: Tupi’s production chain Graph 7: Production time frame per area Source: Petrobrás; Galp and Analyst Estimates
Jupiter is one of the largest discoveries in the pre-salt Santos Basin...
GALP ENERGIA
EQUITY RESEARCH
0 5 10 15 20 25 30 35 40 45 50 55
2000 2001 2002 2003 2004 2005 2006 2007 2008
$
/b
b
l
Comparables Petrobras
0 5 10 15 20
k
b
b
l/
d
Kuito BBLT Tômbua-Lândana
A
Five deve been dec (BBLT); T currently t although TL field w derived fr field is o production reach 350 developm Chevron i and recov stake of 5 Total is th and produ Brazil, by that, oil fro a constan reflecting that Ango quota of 1
V
Galp is co of Carabo decision i Initial esti estimates a transpo platform (billion m
21 Galp considers Venezuela as having “low risk”. So
Graph 8: Petrobras and comparables F&D costs per barre
Gross reserves (Mboe)
Expected year of production
Tômbua-Lândana 350 End 2009 Other:
Block 14 600 2013 Block 14K 100 2014 Block 32 1,500 End 2014
Table 9: Angola offsore projects
Blocks Galp
Capex (2009-13)
Galp Capex (2009-2020)
Block 14 500.81 695.57 Block32 110.99 554.94 Block 14K-A-IMI 48.20 104.50
Total 660.00 1,355.01
Table 10: Projected CAPEX (Million €)
Agreement with PDVSA would guarantee a 3% of
Graph 9: Galp’s total working interest production by oil field
Source: Galp Energia
From all other international major possessions,
Venezuela is the most attractive and active
Source: Petrobras Business Plan, 2009-13
Source: Analyst estimates
Source: Analyst estimates
Galp enjoys good relations with PDVSA
COMPANY
05JANUA
Angola
velopment areas on Block 14, in which Galp has declared commercial: Kuito, Benguela, Belize,
; Tombua Landana (TL), Negage and Gabela. Ku ly the only producing oil fields. Production in BBLT
h beneficiation works aiming to increase the recov was under development through a compliant piled from this project started earlier than expected – operated by Chevron and the project is expe tion of100 kbbl/d in 2011 and recoverable resou 50 Mboe. Galp has also a 4.5% stake in block 14K pment area established by the governments of n is the operator of the block. Production is estim overable reserves are estimated to be 100 Mboe. I f 5%. Until now, there have been around thirteen di the operator of the field and reserves are estimate oduction to start before 2015. We proceed in the by looking at the operator’s main costs and produ l from Angola has a lower API gravity than dated Br tant discount of 1 $/bbl lower than the historical ng the higher quality from TL and Block 32 fields. W
gola has recently joined OPEC. Since 2008, Angola f 1.9 Mbbl/d, that affected all companies operated t
Venezuela
21considering joining Statoil and Petrobras with a 10 boco. The total investment is projected to reach n is scheduled for 2010. In Boyava-6, reserves in p
stimations indicate 70-80 billion barrels, with 12-16 tes total costs to be in the vicinity of $10 billion. Galp portation and liquefaction of gas project from the Deltana and Mariscal. Total processing capacity m3). The investment decision is scheduled for 2
Source: Galp 1Q08 results conference call
rrel. Figure 5: Petrobras lifting costs and royalties per barrel
(Figures in $/bbl) 2007 2
1Q 2Q 3Q 4Q 1Q 2Q
Lifting costs
without royalties 7.20 7.33 7.65 8.60 8.66 9.88 Lifting costs with
royalties 16.24 17.95 20.13 23.16 24.82 31.08
Source: Petrobras Business Plan, 2009-13
NY REPORT
UARY 2010
PAGE 11/36
has a stake of 9%, have , Lobito and Tomboco Kuito, BBLT and TL are LT and Kuito is declining overy rate are underway. led tower. The production – September 2009. The pected to achieve peak ources are estimated to 4K-A-IMI, which is a joint of Angola and Congo. timated to begin by 2014 e. In block 32, Galp has a discoveries on the block. ated to reach 1,500 Mboe the same way we did in duction estimates. Given Brent, we have assumed al average of 2.14 $/bbl, Worth mention is the fact ola has operated under a d there as well as Galp.
10% stake in the auction ch €9 billion. Investment n place must be certified. 16 bn recoverable. Galp alp has a stake of 15% in the exploration fields on ity would be 12 bcm/year 2010. This would allow
2008 2009
Q 3Q 4Q 1Q 2Q 3Q
GALP ENERGIA
EQUITY RESEARCH
1,9 1,9
2,2 2
1,1
0,4
0 2 4 6
Previous Business Plan (March 2009)
New Business Plan (May 2009)
€
B
ln
E&P R&M G&P
1,10 1,40
0,40
0,50
1,24 0,66
0,0 0,4 0,8 1,2 1,6 2,0
Previous business plan (March 2009)
New business plan (May
2009)
New business plan (May
2009)
€
B
ln
Development Exploration Brazil Angola
Galp to p sources. G optimism. projects aggravatio Conoco’s uncertain, establishe coming fro
O
Galp has This repre are in ear The only resources
C
E&P capi This repre €950 mill Angola. In portrays th allocated Angola it license au where Ga
V
We value typical DC value. Bes • • • •
To compu For each the public costs, size
22
The methodology is based on Copeland & Antikaro
23
Four steps used to value offshore oil fields
LNG project could provide supply flexibility for Iberian natural gas marketing
Source: Galp Energia
Graph 11: CAPEX E&P 2009-13
Source: Galp Energia Graph 10: CAPEX E&P 2009-13
Any cash flow considered from Venezuela assets
The time is for focus not for dispersion...
...yet “windows of
opportunity” are still open
Flexibility is an important source of value
COMPANY
05JANUA
purchase up to 2 bcm/year of natural gas prov s. Galp is optimistic about Venezuela. However, we m. Only oil and LNG projects could add value, s have been finally established. Moreover, ation of fiscal policy in Venezuela and the nationa
’s assets, we see operations in Venezuela as in, which reduces the value of any agreements t hed with PDVSA. Thus, we have not considered from Venezuela at least until agreements and com
Other international stakes
as also other stakes in oil fields in Mozambique, Po presented Galp’s effort of diversifying E&P operatio early pre-exploration phases with any relevant oil d ly development expected in these areas is the eff es through campaigns for acquisition of 3D and 2D
Capital expenditures
pital expenditures are estimated to amount to €1.9 presents an extraordinary boost in investments as
illion in Brazil from 1997 until today; and €708 . In only four years Galp plans to spend almost the s the vast opportunities and the commitment to E&P d to Brazil and to the development of oil fields, as it will be mostly directed to exploration and mainte auctions are projected, notably in Venezuela and Galp wants to be present, without having an aggres
Valuation
lue exploration assets in Brazil and Angola using DCF does not take into account existing manageria
esides the general assumptions of the model, four • Valuation of the project without flexibility using • Capture the most relevant uncertainties and s • Identify the most relevant and feasible project • Value the project according to Black & Schole
ute the value of the project without flexibility we u ch of the oil fields considered, unlevered cash flow lic information about recoverable reserves, lifting c ize of investments projected and expected year of r
arov (2001), Brandão et al. (2005a), and Godinho (2006)
NY REPORT
UARY 2010
PAGE 12/36
oviding additional supply we do not share the same ue, but neither of these , following the recent nalisation of Exxon’s and s very risky and highly s that may eventually be ed any future cash flow mmitments are tangible.
Portugal and East Timor. ations. All these ventures il discovery released yet. effort to find recoverable 2D seismic data.
1.9 million from 2009-13. s compared to historical: 08 million from 1987 in the same amount, which &P. Capex will be mostly as mentioned, whereas in ntenance. Moreover, new nd São Tomé e Príncipe essive behaviour.
real options22 since the
rial flexibilities and their ur steps were used: ing DCF
d so volatility of projects ct flexibilities
GALP ENERGIA COMPANY REPORT
EQUITY RESEARCH 05JANUARY 2010
PAGE 13/36
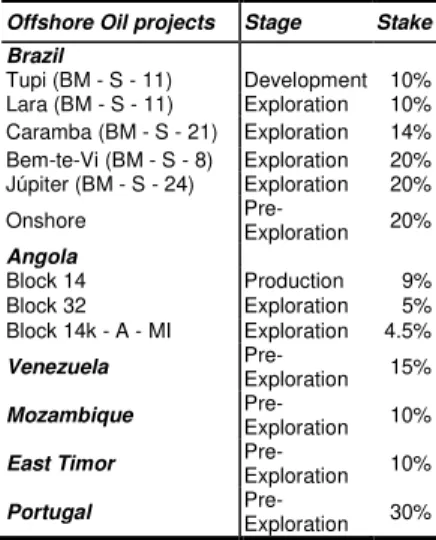
As Galp is not the operator in any of the fields, it is subject to the operator’s decisions and so its power regarding managerial decisions is substantially limited. Thus, we value these oil fields in the perspective of the operator allocating the total economic value of the field according to Galp’s share on it. Pre-exploration reserves will not be valued since there is no data available regarding projections of reserves in place, lifting and development costs and even total investment needed. On top of that, many of those oil fields are in recent discovered areas and because of that no comparables could be identified. Project’s uncertainties depend greatly on their stage. Concerning development and exploration stages, main uncertainties are related with the recovery rate and with future extraction and operation costs: how much recoverable reserves are there and how costly will it be to extract them. The most relevant uncertainty is the oil and gas prices volatility. There are several ways of estimating volatility: volatility implied in past returns – historical volatility; the forward-looking implied volatility on forward prices; and complex dynamic models (e.g. GARCH). Out-of-sample tests, revealed that implied volatility outperform other methods over short term (i.e., up to two-weeks). However, for longer terms, historical volatility outperforms other methods24. Thus, as we are dealing with long period investments, we rely on historical volatility. We model the uncertainty in oil prices, using as proxy the historical volatility in Brent prices25 and a Geometric Brownian Movement process. We simulate oil prices over the duration of the oil field production arriving at an annualized volatility of 39.7%. Although oil&gas volatility is the most important source of uncertainty, operating cash flows are expected to be more volatile due to uncertain fixed costs and production conditions.
As such, we use Monte Carlo simulation26 to calculate the overall volatility of oil fields’ cash flows by modelling the main sources of risk. A Lognormal distribution was chosen to model the changes in oil and gas prices, lifting costs, royalties and F&D costs. The distribution chosen was lognormal since such inputs cannot be negative. The mean and the standard deviation used in simulations consider the standard deviation of the mentioned historical costs, using the historical data on operator’s existing fields. The higher the uncertainty of costs, the higher the project’s cash flows volatility. Moreover, projects that present a higher amount of fixed costs relative to recoverable reserves will have also greater volatility. Therefore, beginning development projects are riskier than Tupi, in which a WTE test has been performed successfully and both reserves and costs are known with more certainty. For instance, by modelling Tupi’s cash flows as explained,
24 Source: Sharma; N. “Forecasting oil price volatility”; Virginia State University; May 1998. Other studies have also shown that more complicated methods
provide little improvement in forecasting stock market volatility as compared to historical volatility specially for longer periods: “Hansen; P. and Lunde; A. “A comparison of Volatility Models: Does Anything Beat a Garch (1,1)”; 2001.
25 Brent is the international benchmark for crude oil and Galp’s realized sales price is established according to a discount to Brent
26 Monte Carlo simulations allow to simulate a specific output, in this case oil field’s value, assuming that certain inputs, i.e., costs and oil prices, can vary in
the future according to a specific distribution. The software used here is @ Risk TM, which is produced by Palisade Corporation of Newfield, New York
Offshore Oil projects Stage Stake Brazil
Tupi (BM - S - 11) Development 10% Lara (BM - S - 11) Exploration 10% Caramba (BM - S - 21) Exploration 14% Bem-te-Vi (BM - S - 8) Exploration 20% Júpiter (BM - S - 24) Exploration 20% Onshore Pre-Exploration 20%
Angola
Block 14 Production 9% Block 32 Exploration 5% Block 14k - A - MI Exploration 4.5%
Venezuela
Pre-Exploration 15%
Mozambique
Pre-Exploration 10%
East Timor
Pre-Exploration 10%
Portugal
Pre-Exploration 30%
Table 11: Galp’s oil fields portfolio stages
Table 12: Costs’ volatility considered in Monte Carlo simulation
Annualized volatility
Lifting costs 16.9 %
Royalties 46.2 %
F&D costs 57.1 %
Present value (€mn)
Minimum -7,969.72
Maximum 60,246.18
Mean 29,347.02
Std Deviation 13,854.89
Simulations 100.00
Source: Galp Energia, Analyst estimates
Source: Analyst estimates Oil prices volatility is the most important source of uncertainty in development field
Oil prices volatility estimated to be 39.7%
Table 13: Monte Carlo simulation for Tupi
GALP ENERGIA COMPANY REPORT
EQUITY RESEARCH 05JANUARY 2010
PAGE 14/36
we arrive at a distribution of its economic value with a mean of $29,347 million. The estimated standard deviation of Tupi’s economic value is $13,855 million, or about 47% proving the amplification effect of fixed operating costs.
After arriving to the project’s volatility, the main flexibilities can be identified. The only relevant source of flexibility is the possibility to delay development costs looking for more attractive exploration conditions, i.e., higher oil prices or lower production costs. In fact, the consortium may delay the major expenditures required for further study, engineering, and /or development looking for more attractive oil/gas prices. Such expenditures may be deferred for up to 4-5 years without losing the opportunity to make them, which is the license period. Thus, the operator can decide to start production now, or wait for higher expected payoffs27. In Brazil, the operator, is the state owned Petrobras, there is a possibility to delay production costs more than 4 years suggesting that option value may be underestimated. Other options include the option to stop production, to adjust the rate of production or to switch technologies. The “shutting in” option is clearly an out of the money option. Marginal revenue for a producing well is substantially higher than marginal costs (disregarding stopping and re-starting costs). Hence, producing oil fields can be treated as assets-in-place whose value is given by the raw APV. Finally, Galp could consider the possibility of selling its share in the consortium for the market price of reserves in place. Even though this possibility exists the actual focus on E&P does not call for it and it could harm Galp’s relationships with actual strategic partners.
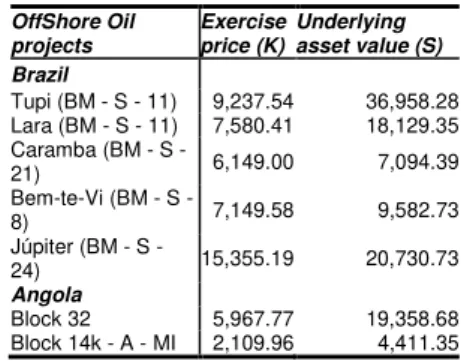
Finally, B&S model28 was used to value this option. As seen, oil field’s operator, will own an American call option on net cash flows that follow the development capital expenditures. This means that the operator must pay an exercise price to be entitled to receive future cash flows. Analogue to the exercise price is the capital expenditure required to develop the reserves. Thus we define the development period allocating 60% of the total projected investment in the oil field to those years. This 60% will be the “extraordinary” capital expenditures that are large compared to the “ordinary” expenditures. So the overall exercise price will be the present value of the capital expenditures during the development phase29. The underlying asset value is identified as discounting the projected net cash flows, including the “ordinary” and excluding the “extraordinary” capital expenditures. Both, will be discounted at the cost of equity used in APV calculations30. The time to maturity is the development period and the discount rate is the risk free rate. Finally volatility is just the project’s volatility identified
27
The payoff in any point in time is the difference between oil field’s economic value if production starts immediately and expected development Capex. The operator will compare the present with future payoffs. Whenever, he believes the future payoff is higher, he will wait and start production only in the future.
28
B&S considers 5 variables: exercise price (K); underlying asset (S); time to maturity (T); risk free (Aj(; and volatility (k(. Even though, this is an American call option that can be exercised earlier, since it does not pay dividends, the value of an American is equal to a European (only exercised at maturity).
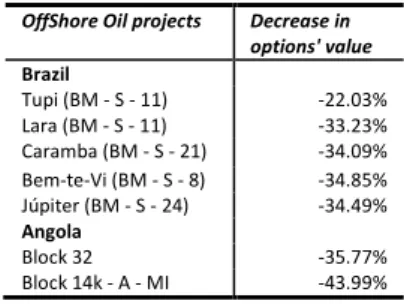
29 Exercise price embodies several assumptions, the most important is that development costs will be the same no matter when Galp exercises the option. 30 We are assuming that the risk contained in capital expenditures is systematic. Moreover, S and K are assumed to be independent. However, note that, in
general, if S and K are positively correlated, option value will be reduced.
OffShore Oil projects
Exercise price (K)
Underlying asset value (S) Brazil
Tupi (BM - S - 11) 9,237.54 36,958.28 Lara (BM - S - 11) 7,580.41 18,129.35 Caramba (BM - S -
21) 6,149.00 7,094.39 Bem-te-Vi (BM - S -
8) 7,149.58 9,582.73 Júpiter (BM - S -
24) 15,355.19 20,730.73
Angola
Block 32 5,967.77 19,358.68 Block 14k - A - MI 2,109.96 4,411.35
Offshore Oil projects Projects’ volatility Brazil
Tupi (BM - S - 11) 47.2% Lara (BM - S - 11) 52.2% Caramba (BM - S - 21) 140.4% Bem-te-Vi (BM - S - 8) 69.3% Júpiter (BM - S - 24) 89.9%
Angola
Block 14 32.4% Block 32 48.2% Block 14k - A - MI 49.8%
Table 15: Exercise price and underlying asset for selected oil fields ($, million) Table 14: Monte Carlo Simulation volatility
Selling share in oil fields without value
Source: Analyst estimates
Stop production, adjust rate of production and switch technologies existing options yet out-of-the-money
Source: Analyst estimates
“Extraordinary” capital expenditures are required to develop the oil field,