ISSN 0104-6632 Printed in Brazil
www.abeq.org.br/bjche
Vol. 32, No. 02, pp. 455 - 464, April - June, 2015 dx.doi.org/10.1590/0104-6632.20150322s00003323
Brazilian Journal
of Chemical
Engineering
EFFECT OF WATER CONTENT, TEMPERATURE
AND AVERAGE DROPLET SIZE ON THE
SETTLING VELOCITY OF WATER-IN-OIL
EMULSIONS
W. J. Souza
1, K. M. C. Santos
1, A. A. Cruz
1, E. Franceschi
1,
C. Dariva
1, A. F. Santos
2and C. C. Santana
1*1
Center for Studies on Colloidal Systems, ITP, PEP, Universidade Tiradentes (UNIT), NUESC/ITP/UNIT, Avenida Murilo Dantas 300, Aracaju, 49032-490, Sergipe - SE, Brazil.
Phone: + (55) 79 3218 2152 E-mail: [email protected]
2Department of Chemical Engineering, Federal University of Paraná, Curitiba - PR, 81.531-990, Brazil.
(Submitted: February 27, 2014 ; Revised: August 8, 2014 ; Accepted: August 27, 2014)
Abstract - Water-in-oil (W/O) emulsions are complex mixtures generally found in crude oil production in
reservoirs and processing equipment. Sedimentation studies of water-oil emulsions enable the analysis of the fluid dynamic behavior concerning separation of this system composed of two immiscible liquids. Gravitational settling was evaluated in this article for a model emulsion system consisting of water and a Brazilian crude oil diluted in a clear mineral oil as organic phase. The effects of water content and temperature were considered in the study of sedimentation velocity of water-oil emulsions. Water contents between 10% and 50 % and temperatures of 25, 40 and 60 °C were evaluated, and a Richardson-Zaki type correlation was obtained to calculate settling velocities as a function of the process variables investigated. Water contents and average droplet sizes were monitored at different levels in the settling equipment, thus enabling identification of the effect of these variables on the phenomena of sedimentation and coalescence of the emulsions studied. The results showed that the emulsion stability during sedimentation was governed by the emulsion water content, which yielded high settling velocities at low water contents, even when very small droplets were present. A quantitative analysis of the combined effects of drop size and droplet concentration supports the conclusion that a stronger effect is produced by the higher concentration of particles, compared with the relatively smaller effect of increasing the size of the droplets.
Keywords: Water-in-oil emulsions; Stability; Settling velocity; Water-oil separators.
INTRODUCTION
Crude oil is a mixture of hydrocarbons with a wide range of sizes and functionalities. These species contribute to the formation and stability of emul-sions. Asphaltenes and resins are two solubility classes of crude oil identified as other important factors for the enhanced stability of water-in-crude
456 W. J. Souza, K. M. C. Santos, A. A. Cruz, E. Franceschi, C. Dariva, A. F. Santos and C. C. Santana
et al., 2001). Santos et al. (2014) provided an exten-sive revision of the methods involved on recovery and transportation methods of heavy oil.
Separation of two-phase systems, including dis-persed and continuous liquids, is a challenge in ad-vanced separation technology. Liquid-liquid separa-tions require the use of special equipment when the drop sizes are small, typically in the range of 1-50 µm in size(Orciuch et al., 2012). In the extraction proc-esses, the “crude oil” is a complex mixture consisting of oil, gas, water and solid particulates. As the first step, this mixture is transferred to primary gravity separators, which typically are cylindrical vessels designed to slow down the flow of the mixture, al-lowing a sufficient residence time for gravity driven settling/separation to produce well defined layers of gas, oil and water.
Clearly, the accurate detection of interface posi-tions (when they have formed) and the phase content measurement (when heterogeneous mixtures persist) are critical from the operation efficiency point of view. This procedure enhances the separation equip-ment design and helps prevent environequip-mental haz-ards such as the accidental discharge of oily process water into the sea (Jaworski and Meng, 2009). This ill-defined thick material is known as a rag layer and is comprised of emulsified water and/or oil, asphalte-nes, clays, and solids. Rag layers are undesirable be-cause they reduce separation efficiency and can up-set the process. The growth of a rag layer depends on the settling/creaming and coalescence rates of the emulsified droplets, which are a function of droplet size, phase densities, viscosity and interfacial proper-ties (Khatri et al., 2011).
Emulsions are thermodynamically unstable systems and will, as a function of time, separate to minimize the interfacial area between the oil and water phases. If a density gradient between the dispersed and con-tinuous phases is present, dispersed droplets experi-ence a vertical force in a gravitational field. The gravitational force is opposed by the fractional drag force, and by the buoyancy force. The resulting set-tling rate VSTOKES of a single droplet is given by Eq. (1), named Stokes’ law (Stokes, 1851):
(
)
218
−
= d c
STOKES
c
ρ ρ gd
V
µ (1)
where VSTOKES is the sedimentation velocity (m/s);
d
ρ and ρc are the densities of the dispersed and continuous phases, respectively (kg/m³); g is the gravitational constant (m/s²); dis the particle diame-ter (m); and μc is the dynamic viscosity of the
con-tinuous phase (Pa.s). Stokes law has several limita-tions and is strictly applicable only for noninteracting spherical droplets at low concentration with a mono-disperse droplet size distribution. Predictions or cal-culation of settling/creaming rates in concentrated emulsions, where other than hydrodynamic factors come to account, are therefore complicated (Gundersen and Sjöblom, 2001; Frising et al., 2006).
Stokes’ law is an analytical solution of the Navier-Stokes equation for the simplified flow case of solid particles and creeping flow. In the case of fluid parti-cles and in the absence of surface-active components, internal circulation inside the particle will reduce the drag force. The viscosity correction term for this case is given by Eq. (2) {called the Hadamard-Rybczynski equation, Hadamard (1911), Rybczynski (1911)]). This equation was obtained through the analytical solution of the momentum transfer equations for the velocity fields inside and outside during the settling of an isolated drop (Levich, 1962). The viscosity correction term for this case is given in Eq. (2).
(
)
22 3
18
d c c d
HR
c c d
ρ ρ gd µ µ
V
µ µ µ
− +
=
+ (2)
From this equation it can be seen that, for large viscosity differences between the dispersed and con-tinuous phases, the settling will approach the Stokes velocity or 3/2 of the value predict by Stokes’ law velocity. Viscous liquid drops in a gas approach Stokes’ law (negligible circulation), while gas bubbles in viscous liquids approach 3/2 of the value predict by Stokes’ law due to formation of a velocity field for gas bubbles in viscous liquids with a high degree of circulation (Arntzen and Andresen, 2001).
Aiming to include the effect of phase concentra-tion on the settling velocities of complex mixtures, Richardson and Zaki (1954) proposed an empirical correlation (Eqs (3) and (4)):
(
1)
nRZ STOKES
V =V −φ (3)
or
(
1 0.01)
= − n
RZ STOKES
V V WC (4)
asphaltene/resin interactions involved in real emul-sions systems. In the technical literature of the oil industry it is usual to replace φ by the water content (WC), expressed in percentage by volume of water in the mixture, so that φ= 0.01 WC.
Research on emulsion layers in liquid-liquid dis-persions without solids has progressed further and various models based on the sedimentation and coa-lescence of emulsified droplets have been proposed for these systems (Jeelani and Hartland, 1986a, 1986b, 1988, 1990, 1993, 2005a, 2005b; Cunha et al., 2008; Noïk et al., 2013). In this work we studied the mechanism of phase separation due to gravity effects. The sedimentation velocity of droplets in a complex system composed of water-in-crude oil emulsion were investigated in a laboratory scale unit, monitoring the water droplet size distribution as a function of time and interface position.
MATERIALS AND METHODS
A model emulsion was used in the study. The or-ganic phase was a Brazilian crude oil diluted in a mineral oil. The dynamic viscosity and density at 25 °C of the organic phase were 2.64 mPa.s and 0.83 g/cm³, respectively. The aqueous phase was distilled water. The crude oil is classified as a light crude oil with the following SARA characterization composition: saturates (47.2% wt), aromatics (26.9% wt), resins (23.1% wt), and asphaltenes (2.77% wt).
The emulsions were homogenized for 5 minutes at 17500 rpm in an Ultra-Turrax T-25 homogenizer fitted with a S24-25G dispersing tool (IKA). The total volume of each prepared emulsion sample was 1.6 liters. The sample was then rapidly transferred to a cylindrical settling vessel with internal dimensions of 110 x 30 x 380 mm. As shown in Figure 1, this vessel is jacketed and connected to a thermostatic bath for temperature control. Also, the vessel is equipped with 6 holes for emulsion sampling. For the sedimentation tests carried out in this work, emulsion samples were collected regularly from three sampling points (the second, fourth and sixth points), and analyzed for water content and droplet size distribution.
Visual measurements of the oil/emulsion and emulsion/water interface positions were taken each 5 minutes at the beginning of the experiments (up to 30 minutes), and then spacing the interval of the samplings once the evolution of the system slowed down. For the sedimentation experiments, initial
water contents (i.e., the volumetric water fraction in the system expressed in percent) of 10, 20, 30, 40, and 50% and temperatures of 25, 40, and 60 °C was investigated. For the sedimentation experiments, samples were taken each 20 minutes during 2 hours for the water content and drop size distribution deter-minations.
Digital pictures were taken of each sample using an Axiovert 40 MAT inverted optical microscope with a Charge Coupled Device camera. Axio Vison 4.7.2 software was used to determine the droplet size distribution. Several images were collected for each sample. In this work, around 800 droplets were ana-lyzed for batch and decay experiments. The set of droplets diameters of each image was used for the d4,3 diameter calculation using an algorithm
imple-mented in Fortran language. The d4.3 is the mean
volumetric diameter that corresponds to the diameter of the sphere that has the same average volume of the particle system.
The organic phase viscosity at different tempera-tures was determined in a rheometer (Physical Rheolab MCR 301, from Anton Paar). The density of the organic phase as a function of temperature was assessed in an automatic DMA 4500M density meter (Anton Paar). The water content (WC) was determined by titration via the Karl Fischer (KF) method, using a mixture of dry methanol and chlo-roform (20% v/v). A Metrohm KF titrator (model 836 Titrando) equipped with a double platinum electrode was employed during the water content determinations.
RESULTS AND DISCUSSION
Effect of Temperature and Water Content on the Settling Velocity
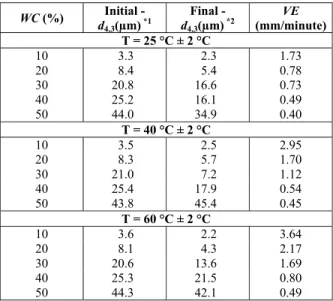
The separation of model emulsions was followed for different water-cuts and temperatures. The water content and average droplet size profiles as a function of temperature are presented in Table 1. The results indicate that the increase in the average droplet size and the decrease of settling velocity are influenced by the WC, which is associated with the effect of droplet population. In this table, for each WC analyzed, the initial (0 min) and final (120 min) values of d4,3 are significantly different, indicating a
458 W. J. Souza, K. M. C. Santos, A. A. Cruz, E. Franceschi, C. Dariva, A. F. Santos and C. C. Santana
Figure 1: Experimental set-up used during sedimentation tests, including a separator vessel connected to the thermostatic bath. The emulsion samples were collected regularly at three sampling points (the second- depth of 4 cm, fourth-depth of 13 cm and sixth-fourth-depth of 22 cm) and analyzed for water content and droplet size distribution
Table 1: Experimental conditions obtained from the sedimentation experiments at depth of 4 cm.
WC (%) Initial - d4,3(µm) *1
Final - d4,3(µm) *2
VE (mm/minute) T = 25 °C ± 2 °C
10 3.3 2.3 1.73
20 8.4 5.4 0.78
30 20.8 16.6 0.73
40 25.2 16.1 0.49
50 44.0 34.9 0.40
T = 40 °C ± 2 °C
10 3.5 2.5 2.95
20 8.3 5.7 1.70
30 21.0 7.2 1.12
40 25.4 17.9 0.54
50 43.8 45.4 0.45
T = 60 °C ± 2 °C
10 3.6 2.2 3.64
20 8.1 4.3 2.17
30 20.6 13.6 1.69
40 25.3 21.5 0.80
50 44.3 42.1 0.49
*1
t=0 min. *2
after 120 min.
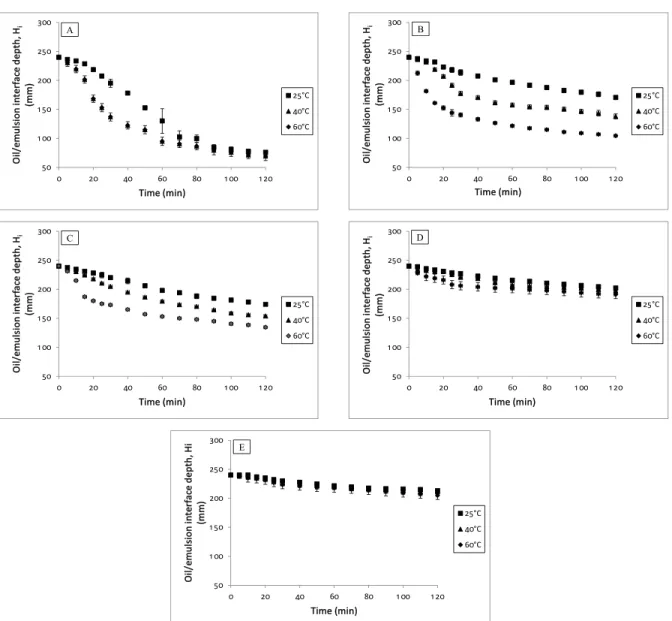
According to Grimes (2012), the interface posi-tions of the W/O emulsion can be depicted using an axial spatial coordinate, z, which is taken to be zero at the top of the separator and extends in a positive direction to the bottom of the separator. In this case, the direction of the gravitational force is along the positive z-direction. Figure 2 shows a typical curve for the displacement of the oil/emulsion interface with time. The zone settling velocity is defined as the gradient of the linear (or linearized) part of this curve. After placing the sludge batch in the vessel, the following behavior was observed: afterwards placing the emulsion in the vessel, an interface is formed,
separating the clear oil not containing suspended solids in the upper part and settling emulsion in the lower part. In the region below the interface, all emulsion particles settle at the same rate, so that the interface is also displaced at the same rate. Simul-taneously at the bottom of the vessel, emulsion with a higher concentration accumulates. With time, an ever-larger fraction of the emulsion particles become part of the concentrated emulsion. Finally, the emul-sion-oil interface approaches to the region of concen-trated emulsion and its rate of displacement starts to decrease gradually. The use of different concentra-tion allows the experimental determinaconcentra-tion of the relationship between the emulsion concentration and the zone settling velocity. Figure 3 depicts the oil/emulsion interface evolution in function of tem-perature and water content of the emulsion. Taking into account the error bars, one may conclude that these experiments exhibit a good reproducibility.
50 1 00 1 50 200 250 300
0 20 40 60 80 1 00 1 20
Oil/e m u ls ion in te rf a ce d e pt h, Hi (mm)
Time (min)
25°C 40°C 60°C A 50 1 00 1 50 200 250 300
0 20 40 60 80 1 00 1 20
Oil/e m u ls ion in te rf a ce d e pt h, Hi (mm)
Time (min)
25°C 40°C 60°C B 50 1 00 1 50 200 250 300
0 20 40 60 80 1 00 1 20
Oil/e m u ls io n in te rf a ce d e pt h, Hi (m m)
Time (min)
25°C 40°C 60°C C 50 1 00 1 50 200 250 300
0 20 40 60 80 1 00 1 20
O il/ e m uls io n in te rf a ce d e pt h, Hi (mm)
Time (min)
25°C 40°C 60°C D 50 1 00 1 50 200 250 300
0 20 40 60 80 1 00 1 20
O il/ e m uls io n in te rf a ce d e pt h, Hi (m m)
Time (min)
25°C 40°C 60°C E
Figure 3: Depths of the oil/emulsion interfaces of emulsions with different WC at different experimental temperature. A) WC=10%, B) WC=20%, C) WC=30, D) WC=40% and E) 50%.
The heat treatment may accelerate the separation of water-oil emulsions due to the decrease of con-tinuous phase viscosity in according with Eqs. (1) and (2). In this way temperature has an important role in the mechanisms of sedimentation and coales-cence between droplets. From Figure 3, it can be observed that as the temperature was increased, there was a significant variation in the behavior of the system, especially for water contents below 30%. In contrast for WC of 40% and 50% very low rates of sedimentation and coalescence between the droplets was observed. Figure 3 also shows that for water contents above 30 % the emulsion presents a high stability, even at higher temperatures.
Correlation for the Effect of Water Content on the Settling Velocity
460 W. J. Souza, K. M. C. Santos, A. A. Cruz, E. Franceschi, C. Dariva, A. F. Santos and C. C. Santana
Figure 4: Experimental settling velocities as a function of water content and temperature.
Following the format of Equation (4), the results presented in Figure 4 can be fitted according to the Equation (5).
(
1 0.01)
= − n
E
V k WC (5)
In Equation (5) VE is the experimental sedimen-tation velocity (calculated from the gradient of the linear (or linearized) part of this curve) and the water content (WC) is expressed in percentage by volume of water in the mixture or the emulsion. The adjusted values of k and n for VE are presented in Table 2 as a function of temperature. Due to the effects of sur-factant adsorption, asphaltene/resin interaction, the system droplets can flocculate and form agglomer-ates. In this sense, the values of k adjusted from the experimental values are not expected to be those predicted by the original Richardson-Zaki correla-tion, which was obtained from results of sedimenta-tion and fluidizasedimenta-tion of solid particles (Frising et al., 2008). The values of n in Table 2 are always greater than 2, which suggests that a stronger hinderance
effect is produced by the highly concentrated popula-tion of water droplets as compared with the relatively smaller effect of increasing sizes (exponent 2 in Equa-tions (1) and (2), for example).
Table 2: Values of k and n obtained by the
ad-justed from the experimental values by Richardson-Zaki correlation for temperatures of 25, 40 and 60 °C.
Temperature (°C) k n
25 2.28 3.22
40 4.37 3.92
60 5.15 3.48
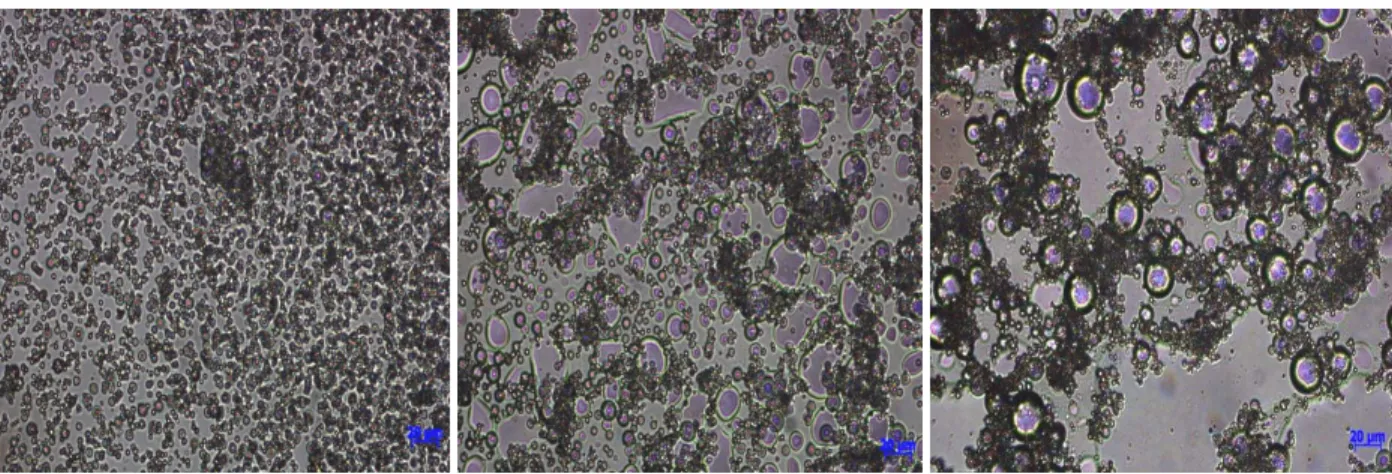
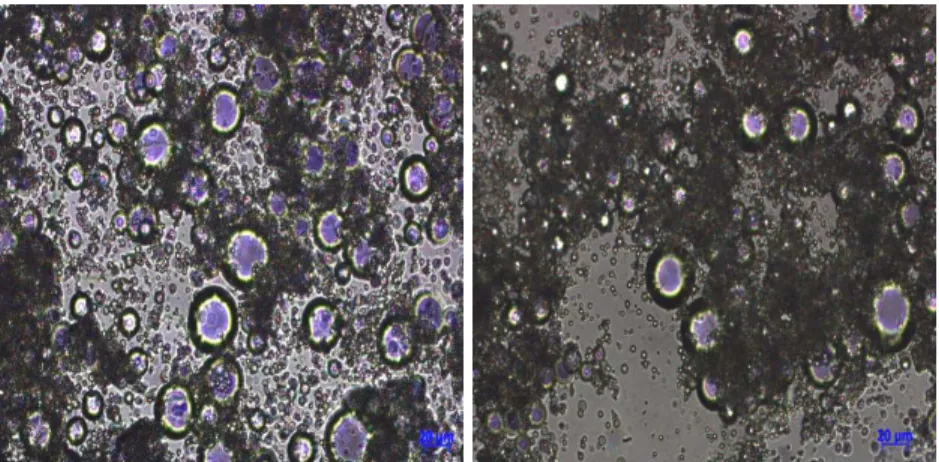
Figure 5 shows examples of microscopic images of emulsions used for the droplet size distribution (DSD) measurements. It was also noted that several droplets have a remarked deformation, resulting from effects of surfactant adsorption, interaction between asphaltenes/resins, flocculation or agglomeration of the droplets and the influence of stabilization mecha-nisms in emulsions.
The results confirm that the DSD is highly de-pendent on the WC in the emulsion, and the average water droplet size decreased from 44 µm at the WC of 50% to 3.3 µm at the WC of 10%. The average water droplet size decreased significantly when the WC of emulsion was less than 30%. Figure 6 shows the average droplet size as a function of water con-tent at temperatures of 25, 40 and 60 °C. In this tem-perature range, only a slight influence on the average droplet sizes was observed, while WC exhibited an almost linear dependence. A good linear correlation (R²=0.945) between droplet mean size and WC was achieved using Equation (6).
4,3 0.986 9.104
Figure 5: Optical microscopic pictures in the initial phase of the sedimentation tests for all the WC (10%, 20%, 30%, 40% and 50% respectively) for emulsion at a temperature of 25 °C (±2 °C) with a magnification of 200-fold (x200).
Figure 6: Mean water droplet size (diameter d4,3(µm))
versus water content (v/v) of THE emulsion at tem-peratures of 25, 40 and 60 °C.
Emulsion Settling Profiles
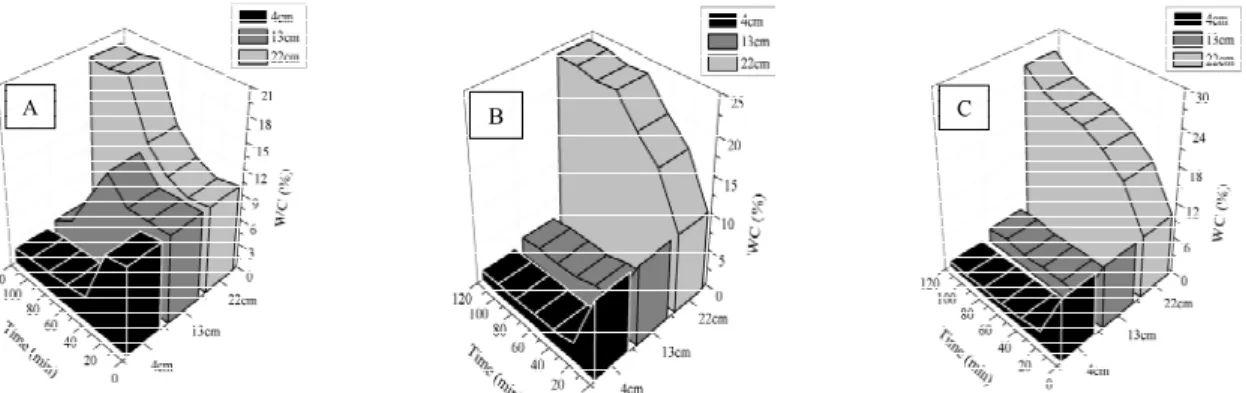
For each overall water content and fixed tempera-ture, experimental average values of water content within three different regions of the gravity settler produces approximate profiles of WC as a function of time (Figures 7 and 9). According to the results presented above, the water content plays an impor-tant role in the sedimentation results. As predicted by the Richardson-Zaki correlation, higher settling ve-locities are expected at low WC values. In order to verify how the WC evolves along the sedimentation time and space, emulsion settling profiles were plot-ted as 3D graphs, considering time and position in the vessel. The analyses were performed for two cases where the settling rates are especially signifi-cant: emulsions with an initial water content of 10 and 20%. Figure 7 shows the settling profiles of W/O emulsions with an initial WC of 10% at different
temperatures. According to these profiles, water drop-lets accumulate at the bottom of the vessel. At low temperature (Figure 7A), the sedimentation process is clearly slow, and the water droplets have time to accumulate in the middle of the vessel. At this posi-tion, the coalescence of the droplets is likely to occur (this is clear in Figure 8A). Conversely, at higher temperatures (Figures 7B and 7C), the accumulation of water at the bottom occurs quickly; in such a way that there is no significant water accumulation in the middle of the vessel and no coalescence (see Figures 8B and 8C). It seems that at higher temperatures, the droplets may settle faster from the top to the bottom with negligible coalescence effects in the middle of the vessel. As a consequence, emulsion WC profiles at the top and middle of the vessel should be similar.
Figure 8 shows the average droplet size profiles along the sedimentation runs for each temperature. As discussed before, sedimentation results at 25 °C are clearly different in the higher temperature cases. At low temperature (Figure 8A) the water droplets may settle and coalesce, yielding larger droplet sizes in the middle of the vessel. In opposition, the aver-age droplet size in the middle of the vessel remains relatively constant. Note that, even though the drop-let sizes involved in these tests are quite small, the sedimentation occurs with time, and water can be accumulated quickly at the bottom of the vessel, as shown previously in Figure 7.
462 W. J. Souza, K. M. C. Santos, A. A. Cruz, E. Franceschi, C. Dariva, A. F. Santos and C. C. Santana
A
A BB CC
Figure 7: Emulsion sedimentation profiles of water content with time and depth in the separator vessel, for a water content of 10% at the temperatures of 25 °C (A), 40 °C (B) and 60 °C (C).
A
A BB CC
Figure 8: Emulsion sedimentation profiles of water droplet mean size with time and depth in the separator vessel, for a water content of 10% at the temperatures of 25 °C (A), 40 °C (B) and 60 °C (C).
A A
B
B CC
Figure 9: Emulsion sedimentation profiles of water content with time and depth in the separator vessel, for a water content of 20% at the temperatures of 25 °C (A), 40 °C (B) and 60 °C (C).
A
A BB CC
Conversely, raising the temperature to 40 or 60 °C, the water droplets settle quickly and then the top of the vessel becomes dehydrated (Figures 9B and 9C). Also, from these figures at higher temperatures, one may note that the water accumulates in the middle of the vessel, indicating that coalescence of droplets plays a role, and the droplets may then settle and accumu-late at the bottom.
Note from Figure 10A that the average droplet sizes in the top and middle of the vessel remain con-stant during the first 80 min for the run at 25 °C. Additionally, a significant increase of the droplet sizes occurs when the water droplets come from the middle to the bottom of the vessel, revealing that the water droplets settle and coalesce in the bottom at controlled rate, in such a way that the droplet sizes at the bottom of the vessel remain high with time. On the other hand, for those experiments carried out at 40 and 60 °C, distinct droplet populations can be observed from the top to the bottom of the vessel, indicating that the coalescence of the droplets is likely to occur in the middle and in the bottom of the vessel.
According to the previous discussion and com-paring the emulsion settling profiles of emulsions with WC= 10% and WC=20% (Figures 7 and 9), one may note that the low water content case yielded faster emulsion resolution, allowing for the fast accu-mulation of water droplets in the bottom. These re-sults agree with the Richardson-Zaki correlation, which takes into account the strong effect of the wa-ter content on the settling velocity.
As a final remark it should be emphasized that the approach adopted in this work was based on a simple experimental apparatus and relied on standard emul-sion characterization techniques such as Karl Fischer titration analysis and optical microscopy. Additional investigation focused on non-dilute systems should be encouraged. In this case, the use of more special-ized equipment able to deal with opaque mixtures is mandatory such as those based on the infrared trans-mission and backscattering spectroscopy (Xu et al., 2013).
CONCLUSIONS
The settling velocity of water-oil emulsions was experimentally analyzed as a function of water con-tent and droplet sizes. Water concon-tent from 10% to 50% and temperatures from 25 °C to 60 °C were evaluated. A Richardson-Zaki type correlation was used to calculate the settling velocities as a function of the water volume fraction. Droplet size
distribu-tions at different posidistribu-tions and times were used to study the phenomena of sedimentation and coales-cence. The results showed that a stronger hinderance effect is produced by a higher concentration of parti-cles, as compared with the relatively smaller effect of increasing droplet sizes. Additionally, the higher stability of the concentrated emulsions was in good agreement with the low settling velocities predicted by the Richardson-Zaki correlation, which was able to describe the experimental results obtained.
ACKNOWLEDGMENTS
The authors thank FAPITEC/SE, CAPES and CNPq for supporting the work and scholarships.
NOMENCLATURE
STOKES
V sedimentation velocity (m/s)
d
ρ density of the dispersed phase (kg/m³) c
ρ density of the continuous phase (kg/m³)
g gravitational constant (m/s²)
d particle diameter (m)
d
μ dynamic viscosity of the dispersed
phase (Pa.s) c
μ dynamic viscosity of the continuous
phase (Pa.s)
φ volume fraction of the dispersed phase (-)
WC water content (%)
n experimentally determined constant (-)
d4,3 average droplet size by volume (µm)
DSD drop size distribution (-) E
V experimental sedimentation velocity
(mm/minute)
W/O water-in-oil emulsion (-)
REFERENCES
Arntzen, R. and Andresen, P. A. K., Three-Phase Wellstream Gravity Separation. In: Encyclopedic Handbook of Emulsion Technology. Sjöblom, J. (Ed.), Marcel Dekker, New York, 679-694 (2001). Cunha, R. E. P., Fortuny, M., Dariva, C., Santos, A. F., Mathematical modeling of the destabilization of crude oil emulsions using population balance equation. Ind. Eng. Chem. Res., 47, 7094-7103 (2008).
464 W. J. Souza, K. M. C. Santos, A. A. Cruz, E. Franceschi, C. Dariva, A. F. Santos and C. C. Santana
Dispersion Science and Techonology, 27, 1035-1057 (2006).
Frising, T., Noïk, C., Dalmazzone, C., Peysson, Y., Palermo, T., Contribution of the sedimentation and coalescence mechanisms to the separation of concentrated water-in-oil emulsions. Journal of Dispersion Science and Technology, 29, 827-834 (2008).
Grimes, B. A., Population balance model for batch gravity separation of crude oil ans water emul-sions. Part I: Model formulation. Journal of Dis-persion Science and Technology, 33, 578-590 (2012).
Gundersen, S. A., Saether, O., Sjöblom, J., Lignosul-fonates and Kraft Lignins as O/W Emulsion Sta-bilizers Studied by Means of Electrical Con-ductivity. In: Encyclopedic Handbook of Emul-sion Technology. Sjöblom, J. (Ed.), Marcel Dekker, New York, 679-694 (2001).
Hadammard, J. S. C., Mouvement permanent lent d’une sphère liquide et visqueuse dans un liquide visqueux. Hebd. Séanc. Acad. Sci., 152, 1735-1738 (1911). (In French).
Jaworski, A. and Meng G., On-line measurement of separation dynamics in primary gas/oil/water separator: Challenges and technical solutions - A review. Journal of Petroleum Science and Engi-neering, 68, 47-59 (2009).
Jeelani, S. A. K. and Hartland, S., Dynamic response of gravity settlers to changes in dispersion through-put. AIChE J., 34(2), 335-340 (1988).
Jeelani, S. A. K. and Hartland, S., Prediction of di-spersion height in liquid/liquid gravity settlers from batch settling data. Chem. Eng. Res. Des, 64, 450-460 (1986a).
Jeelani, S. A. K. and Hartland, S., Scale-up of indus-trial gravity settlers from batch settling data. In: Proceedings of the International Solved Extraction Conference ISEC’86, Munich; 3, 453-460 (1986b). Jeelani, S. A. K. and Hartland, S., The continuous
separation of liquid/liquid dispersions. Chem. Eng. Sci., 48(2), 239-254 (1993).
Jeelani, S. A. K., Pandit, A. and Hartland, S., Factors affecting the decay of batch liquid-liquid disper-sions. Can. J. Chem. Eng., 68, 924-931 (1990). Jeelani, S. A. K., Benoist, G., Joshi, K. S., Gunde, R.,
Kellenberger, D., Windhab, E. J., Creaming and aggregation of particles in suspensions. Colloids Surf. A, 263, 379-389 (2005a).
Jeelani, S. A. K., Hosig, R., Windhab, E. J., Kinetics of low Reynolds number creaming and coales-cence in droplets dispersions. AIChE J., 51(1), 149-161 (2005b).
Khatri, N. L., Andrade, J., Baydak, E. N. and Yarranton, H. W., Emulsion layer growth in continuous oil-water separation. Colloids and Surfaces A: Phys-icochemical and Engineering Aspects, 384, 630-642 (2011).
Levich, V. G., Physicochemical Thermodynamics. Chapter VIII, Prentice Hall, Inc., Englewood Clifts, NJ (1962).
Noïk, C., Palermo, T. and Dalmazzone, C., Modeling of liquid/liquid phase separation: Application to petroleum emulsions. Journal of Dispersion Sci-ence and Technology, 34, 1029-1042 (2013). Opedal, N., Kralova I., Lesaint, C. and Sjöblom, J.,
Enhanced sedimentation and coalescence by chemicals on real crude oil systems. Energy & Fuels, 25(12), 5718-5728 (2011).
Orciuch, W., Makowski, L., Moskal, A., Gradon, L., Evolution of the droplets size during a two-phase flow through a porous media: Population balance studies. Chemical Engineering Science, 68, 227-235 (2012).
Richardson, J. F. and Zaki, W. N., Sedimentation and fluidisation. Part 1. Trans. Inst. Chem. Eng., 32, 35-53 (1954).
Rybczynski, W., Ueber die fortschreitende bewegung einer fluessigen kugel in einem zachen medium. Bulletin Acad. Sci. Cracovie, 40-46 (1911). (In German).
Santos, R. G., Loh, W., Bannwart, A. C., & Trevisan, O. V., An overview of heavy oil properties and its recovery and transportation methods. Brazilian Journal of Chemical Engineering, 31(3), 571-590 (2014).
Stokes, G. G., On the effect of the internal friction of fluids on the motion of pendulums. Philos. Mag., 1, 337-339 (1851).
Urdahl, O., Wayth, N. I., Førdedal, H., Williams, T. J. and Bailey, A. G., Compact Electrostatic Coa-lescer Technology. In: Encyclopedic Handbook of Emulsion Technology; Sjöblom, J., (Ed.), Marcel Dekker, New York, 679-694 (2001).