Abstract
The Laser-Ultrasonic technique uses laser energy to generate ul-trasound waves in various solids. This technique allows inspecting large structures. The generated ultrasound wave form is affected by features of laser pulse (wavelength, pulse duration, power density). The goal of this paper is to study the effects of laser parameters (rise time and beam radius of laser) on the laser generated surface acoustic waves in an aluminum plate. The results obtained from the finite element model of laser generated ultrasound are presented in terms of temperature and displacement. At first, the transient temperature field can be precisely calculated by using the finite element method. Then, laser generated surface acoustic wave forms are calculated in aluminum plate. Results from numerical simula-tion are compared with other references; the accuracy of the met-hod is proved accordingly. In this simulation the sequential field coupling is used. Simulation results show that the laser parameters have a significant influence on the ultrasound waves and will be able to be utilized to choose best experimental parameters of laser.
Keywords
Laser Ultrasonic, Ultrasonic Waves, Simulation by Finite Element Method
Finite Element Simulation of Laser Generated
Ultrasound Waves in Aluminum Plates
1 INTRODUCTION
Recently laser-generated ultrasound has been excessively exploited for characterizing materials. The application of laser ultrasonic has received considerable attention in a wide variety of nondestruc-tive evaluation (NDE) of structures (Davis et al., 1997). The use of ultrasonic waves for
non-destructive materials testing (NDT) is a well established technology. Once coupled with a conven-ient detection device, ultrasound can be used to inspect the interiors of solids for cracks or voids detection, to measure bulk material properties and detect disbonds in laminated materials, coated materials or in adhesively bonded assemblies (Bossi, 2005).
Peym an Soltani a N egar Akbareian b
aDepartment of Mechanical Engineering,
Isfahan University of Technology, Zip Code: 8415-683111, Iran, Email: ep-eyman_hf@yahoo.com
bDepartment of Mechanical Engineering,
Latin American Journal of Solids and Structures 11 (2014) 1761-1776
Traditionally, ultrasonic generation and reception has been accomplished using piezoelectric transducer (PZT) which must be acoustically coupled and mechanically clamped to test specimen. Ultrasonic inspection using PZTs is not practical for rapid inspection on high speed assembly lines or in harsh environment (i.e. high temperature, corrosive, radioactive). To extend the range of ap-plicability of ultrasonic inspection systems, lasers have been proposed as an ultrasound source (Monchalin, 2004). A totally non-contact ultrasonic sensing system can be realized if laser genera-tion is coupled with an interferometric or EMAT (Electromagnetic Acoustic Transducer) receiver. Non-contact ultrasound generation and reception can result in a high speed sensing system that can operate in harsh environments (Murray, 1997).
Ultrasonic waves can be generated by two mechanisms depending upon the power density of the
incident laser beam. These mechanisms are categorized as thermoelastic regime (less than 107w.cm
-2) and ablation regime (more than 107w.cm-2) (Rezaizadeh, 1998). Scrubby et al. (1980) studied early the problem of laser-generated ultrasound using a point source approximation. Rose (1984) treated the point source as a surface center of expansion (SCOE) and obtained a formal solution, neglecting the thermal diffusion. McDonald (1990) and Sanderson (1998) improved this model, tak-ing into account both thermal diffusion and the finite spatial and temporal shape of the laser pulse, and obtained good results agreement with experiment for metals. Much work has been reported for laser-generated ultrasound in metallic specimen (Xu et al., 2006; Shen et al., 2004; Etang and
Huand, 2006; Xu et al., 2006).
Numerical methods will be much more suitable in dealing with complicated processes, involving various parameters (maximum pressure, duration time, thermal scattering), especially for paramet-ric studies, as far as physical phenomena are well reproduced. This work is base on a finite element model that has many advantages. First of all, it is versatile due to its flexibility in modeling non trivial geometry and its availability in obtaining full field numerical solutions. In addition, this method can also be applied to calculating the excitation process, where thermal diffusion, optical penetration and other physical parameters are dependent on temperature. In this article, based on thermoelastic theory, considering the temperature dependence of the thermal physical parameters of the material, the transient temperature field is precisely calculated with the FEM. Then, laser-generated surface acoustic wave forms in aluminum plate are presented. In addition, this method can be applied for other materials. So, we selected aluminum material since it is an available and applicable in most industries. Since the temperature field induces the stress and displacement fields and the effect of the displacement fields on the temperature field is assumed negligibly small, the sequential field coupling is used. First, the thermal element is used to simulate the temperature field. Then, the displacement fields are simulated by replacing the thermal element with an equiva-lent structural element.
Latin American Journal of Solids and Structures 11 (2014) 1761-1776
2 Finite Element Model
2.1 Theory of transient temperature field generation
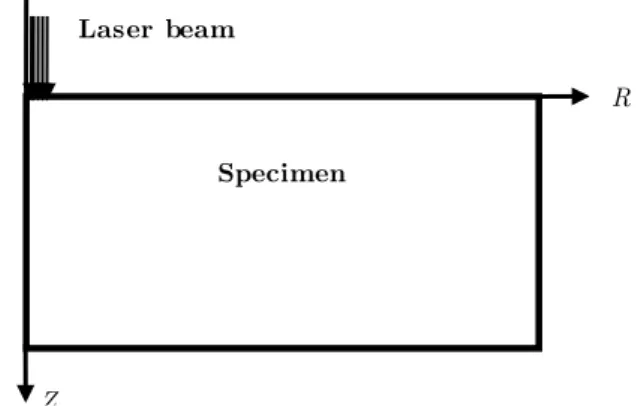
The geometry of laser irradiation on a specimen is schematically shown in Figure 1.
The spatial mode of the laser beam is assumed as Gaussian distribution so that a cylindrical coor-dinates system is adopted.
The thermal conductive equation can be described as (Shen et al., 2004)
ρc(T)
∂T r,z,t
∂t =
1
r
∂ ∂r rk T
∂T r,z,t
∂r +
∂ ∂z(k(T)
∂T r,z,t
∂z ) (1)
where T(r,z,t) represents the temperature distribution at time t. ρ, K, and c, are the density, ther-mal conductivity and therther-mal capacity at constant pressure coefficient, respectively.
The laser irradiation is considered to
serve as a surface heat source and temperature of the back surface of the system is supposed to be thermally insulated, so that the boundary conditions at these two surfaces can be written as
−k(T)
∂T(r,z,t)
∂z !!! =I!A T f r g(t) (2)
and
∂T(r,z,t) ∂z
!!!=
0 (3)
and the initial condition is
T(r,z,0)=0 (4)
Z
Specimen
R Laser beam
Latin American Journal of Solids and Structures 11 (2014) 1761-1776
Where I0 is the incident laser energy density, A(T) is the optical absorptivity of the specimen
sur-face, h is the thickness of the specimen and f(r) and g(t) are the spatial and temporal distributions of the laser pulse, respectively. These two functions can be written as
f r =e(!
!! !!!
) (5)
g t = t
t
!
!e
(!!!!) (6)
Where r0 is the radius of the pulsed laser spot and t0 is the rise time of the laser pulse.
2.2 Theory of laser ultrasound generation by the Thermoelastic mechanism
When the specimen surface is illuminated with a laser pulse with the energy less than the melting threshold of the specimen, a transient displacement field will be excited due to thermoelastic expan-sion. In a homogeneous and an isotropic body, the displacement satisfies
λ+2μ ∇ ∇.U −μ∇×∇×U−α! 3λ+2μ ∇T r,z,t =ρ ∂!U
∂t! (7)
where λ and μ are the Lame constants, ρ is the density, and αt is the thermoelastic expansion
coeffi-cient of the isotropic plate material and U(r,z,t) is the time-dependent displacement. The boundary conditions at the two parallel surfaces z =0 and z=h are
n. σ− 3λ+2μ αT r,z,t I =0 (8)
Where n is the unit vector normal to the surface, I is the unit tensor, and σ is the stress tensor. In addition to the boundary condition, there is also an initial condition
U r,z,t =
∂U(r,z,t)
∂t =0, t=0 (9)
3 NUMERICAL METHOD
The classical thermal conduction equation for finite elements with the heat capacity matrix [C], conductivity matrix [K], heat flux vector {p1}, and heat source vector {p2} can be expressed as
K T + C T = p! + p! (10)
The heat flux vector and the heat source vector
p
1
{ }
=
qN
!
i
2
!
r dr dz
S!!
(11){ }
2 i2
S
Latin American Journal of Solids and Structures 11 (2014) 1761-1776
where {T} is the temperature vector, and T is the temperature rise rate vector. For wave
propa-gation, ignoring damping, the governing equation is
M U + K U = F!"# (13)
where [M] is mass matrix, [K] is the stiffness matrix, {U} is the displacement vector (Unknown Variable), U is the acceleration vector and {Fext} is the action of the laser pulse (known Variable).
For thermoelasticity, the external force vector for an element is B ! D ε! dV, where {ε0}is the
thermal strain vector, [B]T is the transpose of the derivative of the shape functions, and [D] is the
material matrix. Eq. (13) is solved using the Newmark time integration method (Xu et al., 2006) as explicit scheme.
Temporal and spatial resolution of the finite element model is critical for the convergence of these numerical results. Choosing an adequate integration time step is very important for the accu-racy of the solution. In general, the accuaccu-racy of the model can be increased with increasingly small-er integration time steps. With too long time steps, the high frequency components are not resolved accurately enough. On the other hand, too small time steps are a waste of computing time, there-fore, a compromise must be found (Wang et al., 2009).
∆t= 1
20f!"# (14)
where fmax is the highest frequency of interest. But when the rise time of the laser pulse is in the
order of nanosecond, a time step in Eq. (14) might not provide sufficient temporal resolution. The time step has to decrease to (15):
∆t= 1
180f!"# (15)
Thus, the time step can be determined by estimating the highest frequency of the laser-generated ultrasound waves. Also, the needed time step can alternatively be related to the time the fastest possible wave needs to propagate between successive nodes in the mesh.
The elements in mechanical analysis are defined by four nodes with two degrees of freedom at each node in cylindrical coordinate system. In general, the rule of element size is that there are more than 10 nodes in a wavelength. To ensure the propagation of energy between two successive nodes in the mesh, the element length should be fine enough, so the propagating waves are spatially resolved. The recommendation can be expressed as
l!=
λ !"#
20 (16)
Latin American Journal of Solids and Structures 11 (2014) 1761-1776
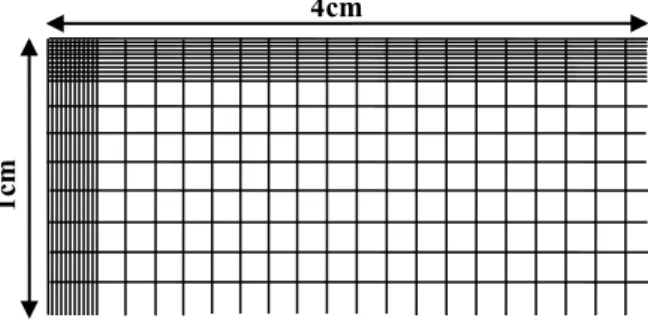
The finite element mesh arrangement is shown in Figure 2. The finite element meshes are much finer near the heat-affected zone (5μm), in order to obtain the transient temperature field in a very accurate way and in the far field the element length is 100μm. Also, in order to avoid reflected waves in the specimen, at the right side of the specimen and bottom of it have been used infinite elements.
Figure 2: Finite element meshes of the specimen.
4 NUMERICAL SIMULATIONS AND RESULTS
4.1 Laser and material parameters
Based on the above-described theories, the thermoelastically generated waves are calculated in cir-cular aluminum plate with 4 cm radius and 1 cm thickness. The laser energy (Peak Energy) is 13.5 mJ and the rise time t0 and the radius of the pulsed laser spot r0 on the sample surface are taken to be 10ns, 15ns and 300μm, 500μm respectively. The minimum element size near the affected zone is 5μm, whereas the element size outside the heat- affected zone is 100μm. In addition, the time step was assumed to be 4ns in calculation. The influence of the rise time and the pulsed laser spot on the ultrasound waves has been investigated.
The mechanical property of pure aluminum at room temperature (300K) used in the simulation is listed in Table 1.
Parameters Value
Thermal expansion coefficient( K-1) 23.1×10⁻⁶
Poisson’s ratio 0.34
Young Modulus (GPa) 70
Table 1: Mechanical Properties of Aluminum used in the simulation.
The temperature dependence of the thermal conductivities of aluminum can be expressed as (Shen et al. 2004)
( )
292.6 200
249.45 0.085 200 730
198.47 0.014 730 m K T
T
T T
T T
=
→ <
− → < <
− → <
(17)
1c
m
Latin American Journal of Solids and Structures 11 (2014) 1761-1776 where k(T) is measured in
W m
.
−1.
K
−1and T is the temperature measured in Kelvin.The temperature dependence of the specific heat of aluminum is
( )
3.971 200
780.27 0.488 200
p
m C T
T T
T T T
=
→ <
+ → ≤ ≤
(18)where Cp(T) is measured in J.Kg-1.K-1.
The temperature dependence of the density of aluminum can be expressed as
0.22 2769 300
m
T T T
ρ=− + → ≤ ≤ (19)
where ρ is measured in Kg.m-3, and Tm is the melting point.
The temperature dependence of the optical absorptivity of the aluminum can be expressed as
2 5
5 2 10 3 10 300
A ( T ) . − −( T )
= × + × − (20)
4.2 Results
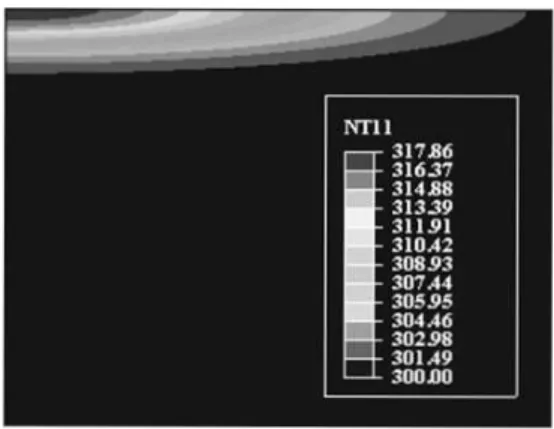
As we discussed, at first the transient temperature field is simulated and then use the thermal ele-ment as a load in mechanical simulation. In Figure (3), It can be seen the temperature filed at a certain time of simulation.
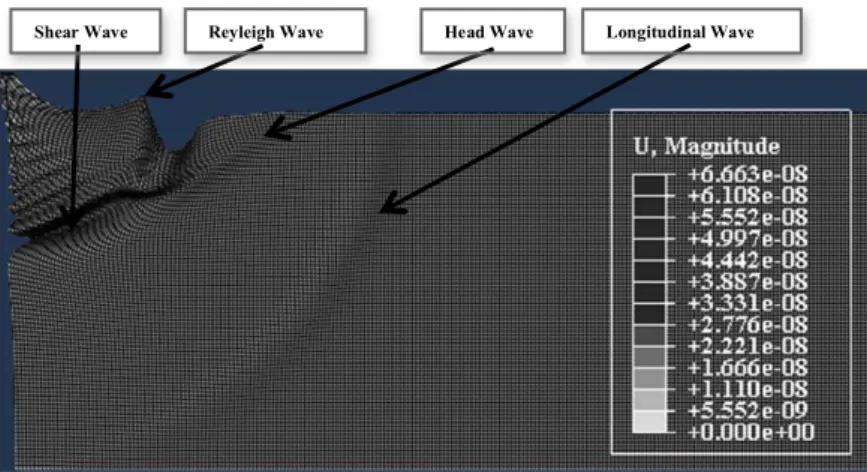
In Figure 4(a), the wavefronts of the longitudinal waves (L), shear waves (S), Rayleigh waves (R) and head waves (H) can be seen clearly. As it can be seen, the longitudinal wave travels fastest and the head wave propagates between the longitudinal and shear waves which the Rayleigh wave trav-els on the surface at slowest speed. The displacement vectors of these waves (L, S, R and H waves) are shown in the Figure 4(b). The direction of the displacement vector of the Rayleigh wave rotates elliptically and direction of head wave makes an angle with the surface. The direction of the longi-tudinal wave and shear wave are also shown in Figure 4(b).
Latin American Journal of Solids and Structures 11 (2014) 1761-1776
Figure 4(a): Deformation of full field at a certain time of simulation.
Figure 4(b): Displacement vector of waves
The temperature distribution on the surface of the sample as the radius of laser beam and rise time of laser pulse is 300 μm and 10 ns, respectively is shown in Figure 5.
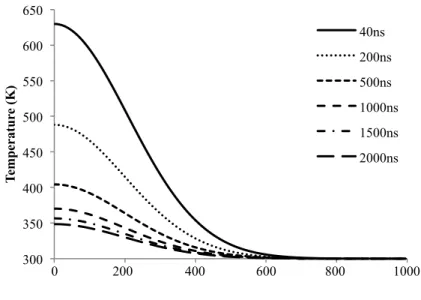
Figure 6 (a) and (b) shows the temperature distributions in the axial direction (Z-axial direction) and radial direction (R-axial direction), respectively, at different times. It can be seen that the tem-perature at the laser- heated zone arises rapidly during the laser irradiation and the area of thermal diffusion is very much localized. The thermal diffusion is less than 50 μm in the axial direction and about 600 μm in the radial direction.
Longitudinal Wave Shear Wave Reyleigh Wave Head Wave
Latin American Journal of Solids and Structures 11 (2014) 1761-1776
Figure 5: Temperature distribution on the surface of the sample (r0=300μm, t0=10ns).
Figure 6(a): Temperature distributions in the Z-axial direction (r0=300μm, t0=10ns).
300 350 400 450 500 550 600 650
T
emp
er
atu
re
(K
)
Time (µS)
r=0,z=0
r=0,z=5µm
r=0,z=10µm
r=0,z=15µm
r=0,z=20µm
r=0,z=25µm
0 0.4 0.8 1.2 1.6 2
300 350 400 450 500 550 600 650
T
emp
er
atu
re
(K
)
Distance in the z direction (µm)
40ns
200ns
500ns
1000ns
1500ns
2000ns
Latin American Journal of Solids and Structures 11 (2014) 1761-1776
Figure 6(b): Temperature distributions in the R-axial direction (r0=300μm, t0=10ns).
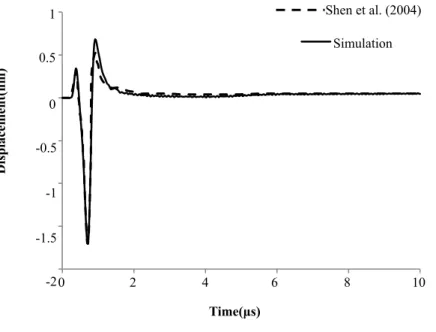
The temperature distribution at epicenter in the aluminum plate is shown in Figure 7 and Figure 8 shows the normal displacement wave forms detected at the surface of aluminum plate at detector distance of 2 mm on the irradiated face. As it can be seen, they are in good agreement with the
theoretical results reported (Shen et al., 2004). The temperature distribution at various depths in
the aluminum plate is shown in Figure 9. According to Figure 9, the maximum temperature de-creases as the depth inde-creases. The surface temperature rises rapidly during the laser irradiation while the cooling process is relatively slow due to the thermal conductivity. With the increment of the depth, the velocity of the rising temperature decreases.
Figure 7: Comparison of temperature distribution at epicenter with Ref. Shen et al., 2004).
300 350 400 450 500 550 600 650
T
emp
er
atu
re
(K
)
Distance in the r direction (µm)
40ns
200ns
500ns
1000ns
1500ns
2000ns
0 200 400 600 800 1000
300 350 400 450 500 550 600 650
T
emp
er
atu
re
(K
)
Time (S)
Simulation
Latin American Journal of Solids and Structures 11 (2014) 1761-1776
Figure 8: Comparison of normal displacement detected at the distance of 2 mm with Ref. Shen et al., 2004).
To investigate the effect of different laser irradiation parameters, we have repeated the simulations with the different beam radius and different rise time. The temperature distribution at surface is shown in Figure 9.
Figure 9: Temperature distribution on the surface of the sample (r0=500μm, t0=15ns).
As it can be seen in Figure 9, at the epicenter, the maximum temperature decreases, as the rise time of laser is increased and also the maximum temperature decreases, as the beam radius of laser
300 350 400 450 500 550 600 650
T
emp
er
atu
re
(K
)
Time (µS)
t0=10ns,r0=300µm
t0=15ns,r0=300µm
t0=10ns,r0=500µm
t0=15ns,r0=500µm
0 0.4 0.8 1.2 1.6 2
D
is
p
lac
eme
n
t(n
m)
Time(µs)
Simulation
1
0.5
0
-0.5
-1
-1.5
-2
Shen et al. (2004)
Latin American Journal of Solids and Structures 11 (2014) 1761-1776
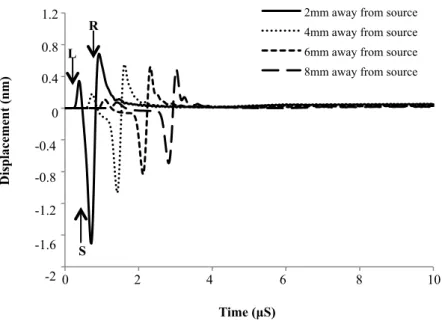
is increased. So the beam radius is most influent in temperature distribution. A series of wave forms of the top surface normal displacements at different source to receiver distances in aluminum plate are shown in Figures 10 and 11.
Figure 10: Surface normal displacements at source–receiver distances (r0=300μm, t0=10ns).
There are three main features in the surface waves. One is the surface skimming longitudinal wave denoted by L, which is an outward displacing unipolar wave. The other two are the surface shear wave front denoted by S and the main initially negative-going dipolar Rayleigh wave denoted by R. The surface normal displacement is shown in Figure 10. The velocities of the L wave, S wave and the R wave obtained from Figure 10 are 5390m/s, 3190m/s and 2940m/s, respectively. According to the Figure 10 for the displacement waveform at 2mm away from the laser source, the first arrival time at 0.37 μs corresponds to the direct longitudinal wave (L) and the second arrival time at 0.63 μs corresponds to the direct shear wave (S).
The L and S waves mark the intersection with the surface of that longitudinal wave and shear wave fronts, respectively, which originate from the center of the extended acoustic source. The three kinds of waves overlap in the near field in Figure 10, and the L wave is separated from the Rayleigh wave gradually with the increased source–receiver distances while the S wave still couples with the Rayleigh wave in the source–receiver distances of interest. Such a phenomenon results from the fact that the propagation velocity of the Rayleigh wave is much smaller than that of the L wave and nearly equals that of the S wave. Due to the small propagation distance and finite pulse width of the two wave forms, such a velocity difference between the L and Rayleigh waves cannot split the two wave forms in the near field. In addition, it is also clearly seen from Figure 10 that the amplitude ratio of the L to Rayleigh waves decreases with the increase of the propagation distance.
D
is
p
lac
eme
n
t (n
m)
Time (µS)
2mm away from source
4mm away from source
6mm away from source
8mm away from source 1.2
0.8
0.4
0
-0.4
-0.8
-1.2
-1.6
-2
R
L
S
Latin American Journal of Solids and Structures 11 (2014) 1761-1776
Figure 11: Surface normal displacements at source–receiver distances (r0=500μm, t0=15ns).
This is because the laser energy mainly deposits in a localized zone. The amplitude of the
thermoe-lastic wave depends on r-1 in the case of spherical wave propagation, where r is the distance from
the source to the receiver location, so that the body source with an axisymmetric and continuous distribution contributes more to the surface wave amplitude in the near field than that in the far field, where the source can be approximately viewed as a point source.
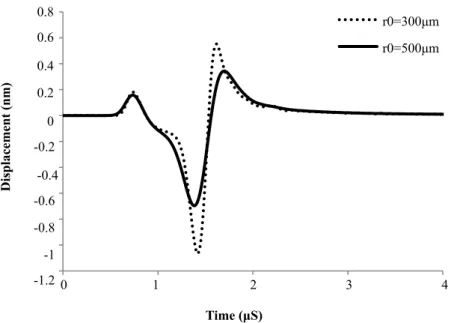
The magnitude and width of the laser- generated waveform are affected by the radius of the irradiated surface and the duration of the pulse. These effects are illustrated in Figures 12 and 13. Several waveforms for the normal displacement at the epicenter have been calculated by varying the beam radius and the duration of the laser pulse independently and assuming a fixed value for
the energy of the laser. Figure 12 shows the case of various radius, 300 and 500 μm for fixed pulse
duration (t0=10 ns), as the radius is increased, the displacement waveform becomes broader and its
magnitude decreases. This might be explained by the fact that in the case of r0=300 µm, the power
density is more important than that of r0=500 µm. Thus, the initial pressure generated at the
epi-center is more important than in the case of an irradiated surface of r0=500 µm. Figure 13 shows
the case of increasing pulse duration for a fixed radius (r0=300 μm), as the pulse duration is in-creased, the displacement waveform becomes broader and its magnitude decreases. Also, a delay in the arrival of the displacement waveform can be noted as the energy deposition is spread in time. This effect may be explained by the shift in the position of the peak of the pulse as its pulse dura-tion increases. Indeed, for larger or longer laser irradiadura-tion, the displacement waveform appears smaller and broader. Its arrival is also delayed for longer pulse durations.
D
is
p
lac
eme
n
t (n
m)
Time (µS)
2mm away from source
4mm away from source
6mm away from source
8mm away from source 0.6
0.4
0.2
0
-0.2
-0.4
-0.6
-0.8
-1
Latin American Journal of Solids and Structures 11 (2014) 1761-1776
Figure 12: The surface normal displacement detected at the distance of 4 mm with various radius of laser beam.
Figure 13: The surface normal displacement detected at the distance of 4 mm with various pulse duration of laser.
5 CONCLUSION
The effects of laser parameters on the laser generated ultrasonic waves in an aluminum plate by finite element method have been studied. The results obtained from the finite element model of laser generated ultrasound are presented in terms of temperature and displacement. Numerical re-sults show that the laser irradiation parameters, i.e. surface and pulse duration have a significant influence on the ultrasound waves and will be able to choose best experimental parameters of laser.
D
is
p
lac
eme
n
t (n
m)
Time (µS)
r0=300µm
r0=500µm
0 1 2 3 4 0.8
0.6
0.4
0.2
0
-0.2
-0.4
-0.6
-0.8
-1
-1.2
D
is
p
lac
eme
n
t (n
m)
Time (µS)
t0=10ns
t0=15ns
0 1 2 3 4 0.8
0.6
0.4
0.2
0
-0.2
-0.4
-0.6
-0.8
-1
Latin American Journal of Solids and Structures 11 (2014) 1761-1776 Since the observed area of thermal diffusion is highly localized, the results tend to show that the thermal effects do not have an important influence around the irradiation. Results shows the case of various line-source widths for fixed pulse duration as the line-source width is increased, the dis-placement waveform becomes broader and its magnitude decreases. In the case of increasing pulse duration for a fixed width as the pulse duration is increased, the displacement waveform becomes broader and its magnitude decreases also, a delay in the arrival of the displacement waveform can be noted as the energy deposition is spread in time. Indeed, for larger or longer laser irradiation, the displacement waveform appears smaller and broader. Its arrival is also delayed for longer pulse durations. However, this should be reconsidered by keeping the density of power constant. Proposed methods and results provide a quantitative basis for the thermoelastic mechanism for non-destructive evaluation.
Acknowledgements
This work is supported by Isfahan University of Technology. We would like to acknowledge people who believe in sharing science and knowledge.
References
Davis, S.J., Edwards, C., Taylor, G.S., Palmer, S.B., “Laser-generated ultrasound: its properties, mechanism and multifarious application”, No. 26, pp. 329-348, 1993.
Bossi, 2005, http:// www.ammtiac. alionscience. com/ pdf/ NTN_V30N2. pdf
Monchalin J.P., “Laser ultrasonics: from the laboratory to industry”, Keynote presentation at the Review of progress in Quantitative Non-destructive Evaluation, AIP Conference proceedings, eds Thompson and Chimenti, Vol. 23A, p. 3-31, 2004.
Murray, T.W., “Laser interaction with materials: Optimizing the laser source for the generation of acoustic waves in laser ultrasonics applications”, Ph.D. Thesis, The Johns Hopkins University, 1997.
Rezaizadeh, M.A., “Pulsed laser ultrasound generation in fiber reinforced composite material”, Ph.D. Thesis, 1998. Scruby, C.B., Dewhurst, R.J., Hutchins, D.A., Palmer, S.B., “Quantitative studies of thermally generated elastic waves in laser-irradiated metals”, J. Appl. Phys. ,Vol. 51, pp. 6210–6216, 1980.
Rose, L.R.F., “Point source representation for laser generated ultrasound”, J. Acoust. Soc. Am., Vol. 75, pp. 723–732, 1984.
McDonald, F.A., “On the precursor in laser generated ultrasound waveforms in metals”, Appl. Phys. Lett., Vol. 56, pp. 230–232, 1990.
Sanderson, T., Ume, C., Jarzynski, J., “Longitudinal wave generation in laser ultrasonics”, Ultrasonic, Vol. 35, pp. 553–561, 1998.
Xu, B.Q., Shen, Z.H., Wang, J., Ni, X., Guan, J., “Thermoelastic finite element modeling of laser generation ultra-sound”, Journal of Applied Physics, No. 99-033508, pp. 1-7, 2006.
Shen, Z.H., Xu, B.Q., Ni, X., Lu, J., “Numerical simulation of laser- generated ultrasound by the finite element method”, Journal of Applied Physics, Vol. 95, No. 4, pp. 2116-2122, 2004.
Latin American Journal of Solids and Structures 11 (2014) 1761-1776