A
r
ti
c
le
0103 - 5053 $6.00+0.00
*e-mail: [email protected]
A Validated Method to Quantify Folic Acid in Wheat Flour Samples using Liquid
Chromatography - Tandem Mass Spectrometry
Helio A. Martins-Júnior,
aAlexandre Y. Wang,
aJanete Alabourda,
bMaria A. F. Pires,
cOscar B. Vega
cand Daniel T. Lebre*
,da Applied Biosystems do Brazil Ltda., Av. do Café, 277, 1º andar Torre B, 04311-000 São Paulo-SP, Brazil
b Instituto Adolfo Lutz, Departamento de Bromatologia e Química, Av. Dr. Arnaldo, 355, 01246-902 São Paulo-SP, Brazil
c Instituto de Pesquisas Energéticas e Nucleares, Centro de Química e Meio Ambiente (CQMA), Av. Lineu Prestes, 2258,
Cidade Universitária, 05508-000 São Paulo-SP, Brazil
d Applied Biosystems/MDS Sciex, 71 Four Valley Drive, L4K 4V8, Concord-ON, Canada
Com o intuito de monitorar a concentração de ácido fólico (vitamina B9) em amostras de farinha de trigo, um método analítico simples e rápido foi desenvolvido e validado, utilizando a técnica de Cromatografia Líquida de Alta Eficiência com detecção por Espectrometria de Massas do tipo triplo quadrupolo (CLAE-EM/EM). O analito foi ionizado com fonte de ionização por
electrospray no modo positivo e o espectrômetro de massas foi operado em modo de aquisição por Monitoramento Múltiplo de Reação (Multiple Reaction Monitoring -MRM), com o propósito de detectar duas trannsições de m/z, uma para quantificação e outra para confirmação. Um total de 83 amostras foram processadas para a validação do método de acordo como guia de procedimentos da Comissão Européia, referência 2002/657/EC, para análise de resíduos em alimentos. A performance do método foi avaliada através da linearidade, exatidão, precisão, sensibilidade e incerteza. O resultado das curvas analíticas na faixa de concentração de 1,0 a 50 µg L-1 apresentaram coeficientes
de correlação (r2) de 1,000. A reprodutibilidade do método foi obtida através do cálculo da somatória
dos desvios padrão dos resultados de análises “intra-dias” e “inter-dias” e apresentou o valor de 5,6%, para o nível de fortificação de 1,50 µg g-1. Além disso, dez amostras no nível de fortificação
de 1,50 µg g-1 foram extraídas e analisadas com exatidão de 85% e precisão de 3% (coeficiente
de variação). A sensibilidade do método foi expressa em limite de decisão (CCA) de 0,06 µg g-1 e
capacidade de detecção (CCB) de 0,11 µg g-1. A incerteza total calculada do método foi de + 0,11
µg g-1. Diferentes marcas de farinha de trigo brasileiras foram avaliadas e reportadas.
In order to monitor the fortification level of folic acid (vitamin B9) in wheat flour samples, we developed and validated a simple and fast analytical method using the liquid chromatography with tandem triple quadrupole mass spectrometry (LC-MS/MS) technique. The compound was ionized by an electrospray source in positive mode. The tandem MS/MS instrument was set in MRM (Multiple Reaction Monitoring) mode to detect two m/ztransitions used for quantitation and confirmation purposes. A total of 83 samples were prepared to validate the method according to the regulatory guidelines from the Commission Decision 2002/657/EC for food residues analysis. The method performance was evaluated in regards to linearity, accuracy, precision, sensitivity, and uncertainty. The statistical analysis of the results showed a correlation coefficient (r2) of 1.000
within the concentration range of 1.0 to 50 µg L-1. The method reproducibility of 5.6% was obtained
by calculating the standard deviation sum of the intra-day and inter-day analysis at a fortification level limit of 1.50 µg g-1 of folic acid. In addition, ten blank spiked samples at the fortification
level limit were extracted and analyzed with an accuracy of 85% and a precision of 3% (coefficient of variation). The method sensitivity was expressed in decision limit (CCA) of 0.06 µg g-1 and
detection capability (CCB) of 0.11 µg g-1. The total measurement uncertainty method calculated
was + 0.11 µg g-1. Different brands of Brazilian wheat flour were evaluated and reported.
Introduction
Vitamin B9, chemically known as either folic acid or
pteroylglutamic acid, is one of the metabolically active compounds and is commonly referred to as folates. This water soluble vitamin helps the body to convert carbohydrates into glucose to produce energy. The
liver converts the folates in N5–methyltetrahydrofolate,
a major circulating form in blood, that is responsible for the one-carbon transfer enzymatic reactions (homocysteine to yield methionine), including the DNA synthesis. The absence of folates in the human body can cause megaloblastic anemia, and affect mental and emotional health, along with other biological effects. As well, the deficiency of this compound during pregnancy can increase the risk for neural tube birth
defects including cleft palate, spina bifida, and brain
damage. In general, vitamin B9 can be ingested through
a diet that is rich in green and leafy vegetables, fruits, and organ meats, though many countries add folic acid in cereal and grain foods, including flours, to enrich their diet.1-3
In 1996, the U.S. Department of Health and Human Service through the Food and Drug Administration (FDA) specified that grain products required to be fortified with folic levels ranging from 0.43 mg to 1.4 mg per pound
(from 0.95 to 3.10 µg g-1) of the product and all women
of child-bearing age should consume 0.4 mg of folic
acid daily.4 In Brazil, the Minister of Health, through
ANVISA resolution RDC n0 344 from December 13th,
2002 approved the addition of folic acid in wheat and
corn flours at minimum concentration level of 150 µg per
100 g (1.50 µg g-1).5
In 2004, the ANVISA released a report with the aim to identify laboratories that analyze nutrients, including folic acid, in food. From 26 laboratories located in Brazil, 61.5% (16) analyze folic acid. Among them, 10 laboratories use HPLC-UV technique, 4 use microbiological methods, 1 uses both approaches, and none of them use the LC-MS/
MS technique.6
Traditionally, laboratories follow the AOAC microbiological methods, 944.12, 960.46 and 992.05, to determine total folate levels in foods, dietary supplements,
and infant formulas.7 An alternative method is to use
spectrophotometer or HPLC-Ultraviolet (UV) detectors, after tedious and time-consuming sample preparation, as thermal extraction, enzymatic (conjugase and amylase)
incubation and purification.8,9 Other methods were developed
using trienzyme sample treatment (conjugase, alfa-amylase, and protease) followed by affinity chromatography and HPLC separation coupled with UV or fluorescence (FL)
detectors.10,11 The lack of specificity and sensitivity opened
new opportunities for LC-MS and LC-MS/MS techniques approach.
Stokes and Webb analyzed some folate compounds in multivitamin tablets and breakfast cereal containing
200 µg per100 g. The authors applied a simple extraction
procedure with solid-phase extraction clean-up, followed by LC-MS detection of the pseudo-molecular ions in
negative electrospray mode.12 In 2003, Freisleblen et al.
published an article comparing the quantification of folate in food using the two different detection techniques: LC-FL and stable isotopic dilution assays with LC-MS/MS. The LC-MS/MS revealed superior selective, precision and sensitivity.13 Later on, an inter laboratory comparative study
was presented by Puwastien et al. using different detection
strategies to measure folate levels in food, including
LC-UV and LC-MS techniques.14 Spanning from early
2000 to present day, some papers reported the usage of LC/ MS or LC-MS/MS (triple quadrupole) detectors to quantify folates in different matrices (food, plasma, and vitamins), although none of them are specific to analyze folic acid in
wheat flour samples. 15-20
This present work shows a novel and validated method to quantify folic acid in wheat flour with a high degree of specificity and confidence using the LC-MS/
MS technique.21 A simple and fast extraction procedure
was developed to save time and cost. To obtain confident results the method was validated according to the regulatory guidelines from the Commission Decision 2002/657/EC, concerning the performance of analytical methods and the interpretation of results.22
Experimental
Reagents
Folic acid was purchased from Sigma-Aldrich, (St. Louis, MO, USA) with 99% purity. Ultrapure water was produced by EASYpure RF System from Barnstead (Dubuque, IA, USA). methanol HPLC grade, ammonium acetate and ammonium hydroxide were purchased from J. T. Baker, (Deventer, NE, USA).
Folic acid standard solutions
A 100 µg mL-1 stock solution of folic acid was prepared
quantitatively transferred into a 10 mL amber volumetric
flask and stored at 4 0C away from light. An intermediary
solution of folic acid at 1.0 µg mL-1 in water was obtained
by dilution of the stock solution. All solutions for the analytical curve were prepared from this intermediary solution at the following concentrations: 1.0, 5.0, 10, 25
and 50 ng mL-1 in water solution containing 5.0 mmol L-1
of ammonium acetate.
Sample preparation
2.0 g of wheat flour sample was weighed and transferred into a 50 mL polypropylene centrifuge tube, 40 mL of
75 mmol L-1 ammonium acetate solution (pH=7) was
added, sonicated for 10 min and mixed in an orbital shaker for 60 min. After the extraction, the samples were centrifuged for 15 min at 4,000 rpm and 50 µL of the supernatant was taken and diluted with 700 µL of water solvent straight into a 2.0 mL amber vial. Volume of 20 µL of the sample solution was injected into the LC-MS/ MS system. It is important to keep the sample tubes away from UV light to avoid any degradation.
Method validation
A total of 83 samples were prepared to validate the proposed methodology. The study was divided into four experiments and executed in four consecutive days to evaluate the inter-day and intra-day variations. The first three experiments included a batch of 1 blank sample, 20 blank spiked samples (63 totals) and the respective analytical curve. The blank spiked samples were analyzed in 5 different concentration levels of folic acid: 6 replicates
samples at 0.75 µg g-1; 6 replicates samples at 1.50 µg g-1;
6 samples at 2.25 µg g-1; 1 sample at 3.00 µg g-1 and 1
sample at 7.5 µg g-1. In the forth experiment, 10 blank
samples, 10 blank spiked samples at the concentration
level of 1.5 µg g-1 and the analytical curve were analyzed.
All blank spiked samples were prepared by adding the necessary volume from a standard stock solution of folic
acid at a concentration level of 100 µg mL-1. After the
standard addition, these samples were homogenized under circular agitation for 1 h and extracted.
LC-ESI/MS/MS
LC analysis was performed with an autosampler (20 µL
injection volume), a column oven (set to 25 0C) and a
quaternary pump from the Agilent 1100 series (Agilent Technologies, Waldbronn, GE). For the separation a reverse
phase column, Zorbax Eclipse XDB-C8 (150 mm r 4.6 mm,
5 µm; Agilent, California, USA) was used. LC elution
conditions were as follows: mobile phase A = 5.0 mmol L-1
ammonium acetate and mobile phase B = methanol with
5.0 mmol L-1 ammonium acetate; isocratic mode: 25%
mobile phase A and 75% mobile phase B; flow rate
of 700 µL min-1; total run time of 3.0 min. The mass
spectrometric analyses were performed on an API 4000™ (Applied Biosystems/MDS Sciex, Concord, Canada) with
a TurboIonSpray® source operated in positive ion mode.
The electrospray source parameters were as follows: Curtain Gas™ = 10 psi, nebulizer gas = 50 psi, heater
gas = 40 psi, heater temperature = 600 0C, and electrospray
voltage = + 5500V. The MRM mode was used to detect the target compounds in the triple quadrupole stage and the optimum conditions are described in Table 1. The Collision Gas (nitrogen) was maintained at 6.0 arbitrary units.
Results and Discussion
Mass Spectrometry optimization
To optimize the MRM mode, a folic acid solution at
concentration of 1.0 µg mL-1 (50% methanol + 50% water
+ 5 mmol L-1 ammonium acetate) was infused into the
electrospray ion source (positive mode) at a flow rate of
10 µL min-1. With the advances on software interface it was
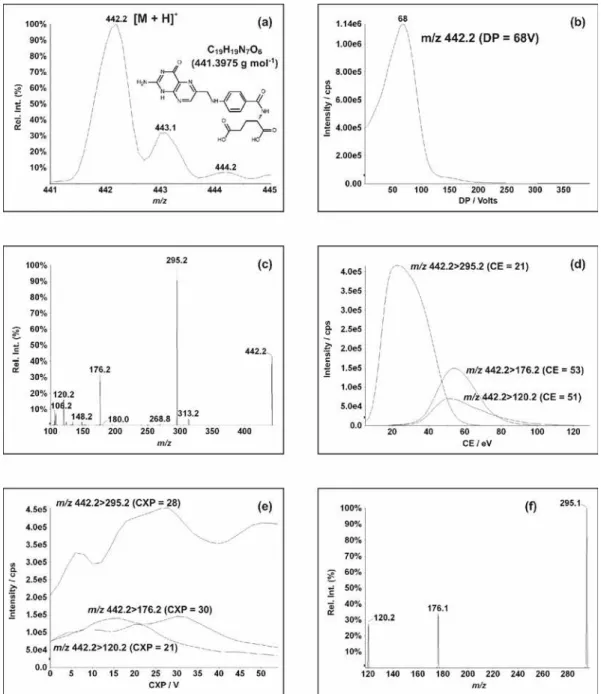
possible to tune the instrument automatically in a few min. Figure 1 summarizes the mass spectrometry automatic steps necessary for maximum MRM transitions sensitivity, and its optimum parameters.
The two most intense transitions were chosen to build the final MRM mode. The transitions 442.2>295.2 and 442>176.2 were defined as quantifier and qualifier (confirmation), respectively.
After the MRM optimization, the electrospray ion source parameters were set to operate with maximum
efficiency at mobile phase flow rate of 700 µL min-1. Folic
acid is an organic acid and its dissociation constants (pKa)
are 4.7, 6.8, and 8.7. At a pH level lower than 4.7 in aqueous solutions the protonated form (insoluble form below 7.0) is predominant and a pH level above 8.7 the deprotonated
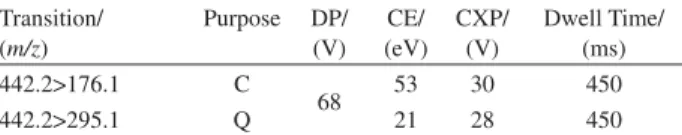
Table 1. MRM mode conditions optimized to detect folic acid
Transition/ (m/z)
Purpose DP/ (V)
CE/ (eV)
CXP/ (V)
Dwell Time/ (ms) 442.2>176.1 C
68 53 30 450
442.2>295.1 Q 21 28 450
form (soluble) is predominant. The physicochemical information helped to chose the electrospray ionization polarity. The literature shows that it is possible to ionize folic acid in both positive and negative modes, suggesting that the amino group present in the structure is protonated in
positive mode [M+H]+ and deprotonated in negative mode
[M–H]–.18,19 Herein the pH of the mobile phase solutions
was maintained at 7.0, adding 5.0 mmol L-1 of ammonium
acetate in the mobile phase. The positive ionization mode
was used to detect the [M+H]+ species.
Method optimization
For chromatographic methods, developing a separation involves demonstrating specificity, which is the ability of the method to accurately measure the analyte response in
the presence of all potential sample components.23 One
main advantage of the triple quadrupole mass spectrometry detector is the mechanism’s ability of high compound selectivity. Therefore, the liquid chromatography (LC)
separation was optimized very quickly using a C8
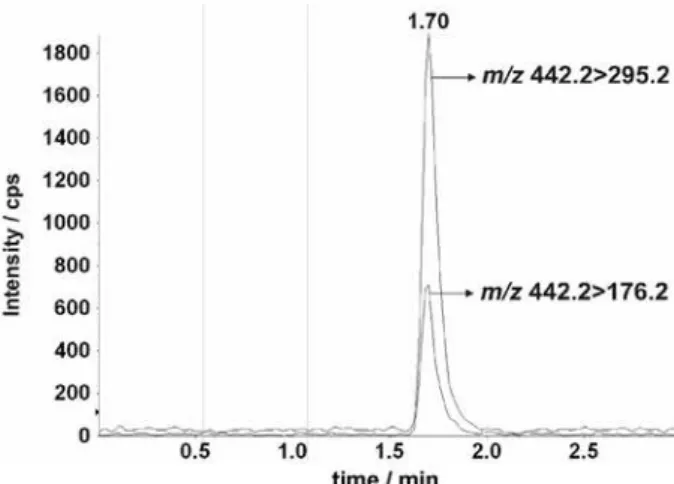
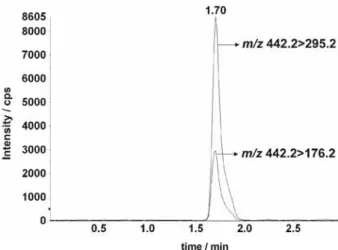
phase column, obtaining a sharp peak, low retention time (1.70 min), without matrix interferences. Figure 2 presents a LC-ESI/MS/MS at the optimum analyzed run conditions.
Method validation is the process of proving that an
analytical method is acceptable for its intended purpose.23
The developed methodology to quantify folic acid in wheat flour sample was validated according to the Commission Decision 2002/657/EC criteria, proceeding as described
in the experimental section.22 A total of 83 samples were
analyzed, besides the calibration curves, to evaluate the analytical performance characteristics of specificity, accuracy, precision, repeatability, reproducibility, recovery, detection limits and uncertainty using the proposed method.
This experiment produced relative amounts of data that we summarized herein, showing some important figures of merit. The following results presented below are based
on the most intense m/z transition (442.2>295.2) signal,
chosen as a quantifier.
Linearity
Overall, the acceptability of linearity data is often judged by examining the correlation coefficient and y-intercept of the linear regression line for the response versus concentration plot (calibration line y = ax + b). A correlation coefficient of > 0.999 is generally considered as evidence of acceptable fit of the data to the regression line. The y-intercept should be less than a few percent of
the response obtained for the analyte at the target level.23
Table 2 presents the results of four analytical curves built for each experiment or batch analysis (inter-day, see experimental section). The concentration of folic acid in
standard aqueous solution range from 1.0 to 50 ng mL-1,
which corresponds from 0.3 to 15 µg g-1 in wheat flour
samples (considering the extraction procedure volumes).
Sample extraction efficiency: correlation, recoveries and co-variations
In order to evaluate the correlation among the sample extraction efficiency, one curve was built for each day
or experiment (calculated concentration vs. area signal).
Table 3 shows the correlation of the extraction procedure
at folic acid concentrations ranging from 0.75 µg g-1 to
7.5 µg g-1. Figure 3 shows the LC-MS/MS chromatograms
of the samples extracted and analyzed at different validation level concentrations.
The accuracy was measured in terms of recovery, spiking the analyte in blank wheat flour matrices at different
concentration levels (from 0.75 to 7.5 µg g-1), before the
extraction process. The sample final concentration was calculated through the analytical curve built in solvent.
Figure 2. LC-MS/MS chromatogram of folic acid standard solution at 1.0 ng mL-1 (20 pg on column).
Table 2. Analytical curve results
Curve Slope (a) Y-intercept (b) Correlation (r²)
1 33065 -140 1.0000
2 33168 -1982 1.0000
3 33992 -1671 1.0000
4 34663 -2744 1.0000
Figure 3. (a) LC-MS/MS chromatogram of blank wheat flour sample; intensity < 70 cps. (b) LC-MS/MS overlaid chromatograms of wheat flour samples, fortified with folic acid at different concentration levels. Table 3. Correlation between sample extractions at concentration range from 0.75 to 7.5 µg g-1
Experiment n Slope (a) Y-intercept (b) Correlation (r²)
1 21 29708 -3417 0.9949
2 21 30038 -1802 0.9986
According to the 2002/657/EC guidelines for method validation, the data corrected with the mean recovery are only acceptable when they fall within the following ranges:
a 1.0 µg kg-1 from 50 to 120%; > 1.0 to 10.0 µg kg-1 from 70
to 110% and q 10.0 µg kg-1 from 80 to 110%. The last value
was used as the recovery criteria. The Table 4 presents the intra-day recoveries and the coefficient of variation that did not exceed the recommendation set value of 10%, considering the concentration range validated for this analysis.
The method stability or reproducibility was verified
thorough intra-day (sintra2) and inter-day (s
inter
2) variances
(Table 5). The same LC-ESI/MS/MS conditions were maintained during the three days of experiments, except the samples batch that was prepared fresh daily, as described in the experimental section.
The last experiment analyzed ten blank samples and ten blank spiked samples at the validation level limit of 1.5 µg g-1. Table 6 presents the statistical results. The recovery
value suggests that analyte loses just 15% of the signal, represented by matrix effect and/or extraction efficiency.
Sensitivity
Establishing the lowest analyte concentration that produces a response detectable above the noise level of the system, and corresponds to the limit of detection (LOD) and the limit of quantitation (LOQ) (which is the lowest level of analyte that can be accurately and precisely measured), were important parameters to be validated in quantitative methods. Originally, the 002/657/EC guidelines for method validation
recommend the usage of decision limit (CCA) and detection
capability (CCB) to measure sensitivity.22 The method
sensitivity was calculated using the following equations based on Table 3 data result and its inter-day variation:
CCA = [(y_interc. + 2.33 x stdev y_interc.) –
y interc.] / slope (1)
CCB = [(y_interc. + 2.33x stdev y_interc. +
1.64 stdev y_interc) – y_interc.] / slope (2)
The developed method to detect and quantify folic
acid in wheat flour samples showed a CCA of 0.06 µg g-1
and CCB of 0.11 µg g-1. These values were way below
the validation method limit and the established folic acid fortification level in wheat flours of 1.5 µg g-1, which makes
this methodology suitable for its purpose.
Quantitation in wheat flour samples
Before sample quantitation, the measurement uncertain
(U) was calculated as 0.11 µg g-1 (11 µg per100g) and all
results shown are expressed as ± U. A total of four samples from different brands were analyzed in order to determine the folic acid concentrations. Table 7 shows the results and the variances among different brands analyzed. Figure 4 shows a chromatogram analysis from sample FT14. It was observed that the FT07 sample was way out of the minimum
fortification level of 150 µg per 100g as recommended
by ANVISA resolution.5 Even though, the sample FT08
showed slight higher levels of folic acid, the same does not represent any risk to human health, since the oral daily doses of 5-10 mg of folic acid appear to be well-tolerated
and without toxicity in normal non-pregnant subjects.24
Overall, all samples analyzed herein are in agreement with the fortification range levels of folic acid in wheat flour
suggested by FDA guidelines.4
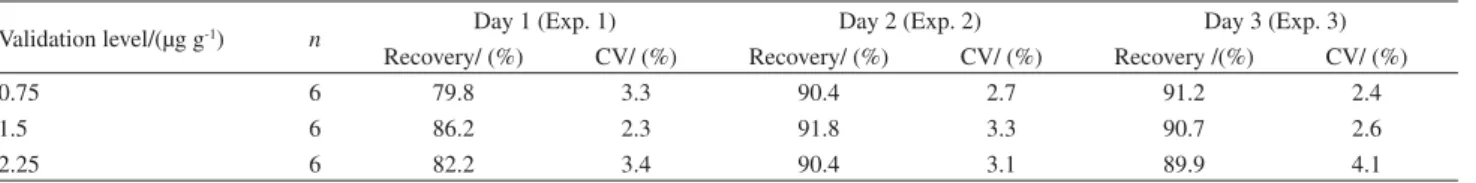
Table 4. Intra-day accuracy and coefficient of variation data
Validation level/(µg g-1) n Day 1 (Exp. 1) Day 2 (Exp. 2) Day 3 (Exp. 3)
Recovery/ (%) CV/ (%) Recovery/ (%) CV/ (%) Recovery /(%) CV/ (%)
0.75 6 79.8 3.3 90.4 2.7 91.2 2.4
1.5 6 86.2 2.3 91.8 3.3 90.7 2.6
2.25 6 82.2 3.4 90.4 3.1 89.9 4.1
Table 5. Method stability or reproducibility variance(s)
Validation level/(µg g-1)
Repeatability
(sintra2)
Between Exp.
(sinter2)
Reproducibility (sR2) SD / (%)
0.75 0.0002 0.0023 0.0025 5.0
1.5 0.0014 0.0017 0.0031 5.6
2.25 0.0049 0.0099 0.0148 12
Table 6. Reproducibility at the validation method limit
Validation level /(µg g-1) n Recovery/ (%) C.V./ (%)
1.5 10 85.1 3.0
Table 7. Sample analysis results
Wheat Flour Samples Folic acid (conc.)/(µg 100 g-1)
FT07 131
FT08 225
FT14 166
Figure 4. LC-MS/MS chromatogram of wheat flour sample FT14 at folic acid concentration of 1.66 µg g-1.
Conclusions
We presented an alternative and effective way to analyze folic acid, which is an important dietary nutrient, in wheat flour. The use of LC-ESI/MS/MS technique allowed the determination of this compound at the required set limits (sensitivity), without matrix interferences (selective), time consuming (rapid) and tedious sample preparation, comparing with previous published works. The method was validated and applied to analyze some samples collected from Brazilian markets. Finally, this work can support and help the laboratories enrolled in food analysis for future quality control programs.
Acknowledgments
The authors would like to thank all the staff from Applied Biosystems of Brazil and the Center of Chemistry and Environmental at IPEN. We are also grateful to the researchers from Instituto Adolfo Lutz (IAL-SP). A very special thanks to Dr. Takeo Sakuma, senior researcher from MDS Sciex, who reviewed this work and contributed with his well respect knowledge in mass spectrometry and chemistry science.
References
1. Kaplan, L. A; Pesce, A. J.; Kazmierczak, S. C.; Clinical Chemistry: Theory, Analysis, Correlation, 4th ed., 2003, Mosby,
Inc. Elsevier Health Science, PA, USA,747.
2. http://www.umm.edu/altmed/ConsSupplements/Print/ VitaminB9FolicAcids.html, accessed November 2006. 3. http://www.scpineuniverse.com/displayarticle.php/article1154.
html, accessed November 2006.
4.HHS News: Folic Acid to Fortify U.S. Food Products to Prevent Birth Effect, http://www.fda.gov/bbs/topics/NEWS/NEW00526. html, accessed November 2006.
5.Resolução – RDC No 344, de 13 Dezembro de 2002,
http://e-legis.bvs.br/leisref/public/showAct.php?id=1979, accessed November 2006.
6. Silva, E. M. C; Sousa, A. T.; Mandai, M. M, Avaliação Preliminar da Capacidade Laboratorial na determinação de Ácido Fólico, Ferro Total, Glúten e Ácidos Graxos Trans em Alimentos, Reblas, ANVISA, October 2004.
7. DeVries, J. W.; Rader, J. I.; Keagy, P. M.; Hudson, C. A.; Angyal, G.; Arcot, J.; Castelli, M.; Doreanu, N.; Hudson, C.; Lawrence, P.; Martin, J.; Peace, R.; Rosner, L.; Strandler, H.S.; Szpylka, J.; van den Berg, H.; Wo, C.; Wurz, C.; J. AOAC Int.2005,5, 88. 8. Osseyi, E. S.; Wehling, R. L.; Albrecht, J. A.; J. Chromatogr.
A.1998,235, 826.
9. Ruggeri, S.; Vahteristo, L. T.; Aguzzi, A.; Finglas. P.; Carnovale, E.;J. Chromatogr. A.1999,237, 855.
10. Konings, E. J.; J. AOAC Int.1999,119, 82.
11. Poo-Pietro, R.; Haytowitz, D. B.; Holden, J. M.; Rogers, G.; Choumenkovitch, S. F.; Jacques, P. F.; Selhub, J.; J. Nutr.2006,
3079, 136.
12. Strokes, P.; Webb, K.; J. Chromatogr. A.1999,59, 864. 13. Freisleben, A.; Schieberle, P.; Rychlik, M.; Anal. Biochem.
2003,247, 315.
14. Puwastien, P.; Pinprapai, N.; Judprasong, K.; Tamura, T.;
J. Food Comp. Anal.2005,387, 18.
15. Pawlosky, R. J.; Flanagan, V. P.; J. Agric. Food Chem.2001,
1282, 49.
16. Freisleben, A.; Schieberle, P.; Rychlik, M.; Anal. Bioanal. Chem.2003, 149, 376.
17. Nelson, B. C.; Dalluge, J. J.; Margolis, S. A.; J. Chromatogr. B.2001,141, 765.
18. Kok, R. M.; Smith, D. E. C.; Dainty, J. R.; van den Akker, J. T.; Figla, P. M.; Smulders, Y. M.; Jacobs, C.; de Meer, K.; Anal. Biochem.2004,129, 326.
19. Chen, Z.; Chen, B.; Yao, S.; Anal. Chim. Acta2006,169, 569. 20. Nelson, B. C.; Sharpless, K. E.; Sander, L.C.; J. Chromatogr.
A2006,203, 1135.
21. Wang, A. Y.; Lebre, D. T.; Martins-Junior, H. A.; Alaburda, J. K.;J. ASMS,2005,98S, 16 (5S).
22. Commission Decision 2002/657/EC of 12 August 2002; Off. J. Eur. Commun. 2002, L221, 8.
23. Green, M. J.; Anal. Chem.1996,68, 305A.
24. Butterworth Jr., C. E.; Tamura, T.; Am. J. Clin. Nutr.1989,50, 353.
Received: July 23, 2007 Web Release Date: May 29, 2008