Printed in Brazil - ©2007 Sociedade Brasileira de Química 0103 - 5053 $6.00+0.00
A
r
ti
c
le
*e-mail: [email protected]
Multivariate Classification Based on Chemical and Stable Isotopic Profiles in Sourcing the
Origin of Marijuana Samples Seized in Brazil
Elisa K. Shibuya,*,a,b Jorge E. S. Sarkis,a Osvaldo Negrini-Netoc and Jean P. H. B. Omettod
a
Laboratório de Caracterização Química e Isotópica, Centro de Química e Meio Ambiente, Instituto de Pesquisas Energéticas e Nucleares, IPEN/CNEN-SP, Av. Lineu Prestes 2242, Cidade Universitária, 05508-970
São Paulo-SP, Brazil
b
Laboratório de Referências Metrológicas, Instituto de Pesquisas Tecnológicas do Estado de São Paulo, IPT-SP, Av. Prof. Almeida Prado, 532, Cidade Universitária, 05508-901 São Paulo-SP, Brazil
c
Centro de Exames, Análises e Pesquisas, Instituto de Criminalística do Estado de São Paulo, Rua Moncorvo Filho 410, 05567-060 São Paulo-SP, Brazil
d
Laboratório de Ecologia Isotópica, Centro de Energia Nuclear na Agricultura, Av. Centenário 303, 13416-903 Piracicaba-SP, Brazil
Este trabalho teve como principal objetivo verificar as diferenças existentes na composição elementar de amostras de Cannabis, apreendidas em diferentes regiões produtoras do país, previamente separadas através da análise de isótopos estáveis de carbono e nitrogênio, e utilizar estas diferenças para classificar as amostras de acordo com sua origem geográfica. A técnica analítica empregada foi a de espectrometria de massas de dupla focalização com fonte de plasma acoplado indutivamente (HR-ICP-MS), e a avaliação dos dados foi realizada utilizando-se a análise de agrupamentos (hierarchical cluster analysis) e de discriminantes linear. Os resultados indicam que amostras provenientes de regiões diferentes apresentam perfis químicos diferentes e estes por sua vez parecem estar relacionadas com as características geológicas das regiões consideradas. Os parâmetros mais importantes nesta avaliação foram os isótopos estáveis de carbono e nitrogênio e os níveis de cobre, cobalto, bário, lantânio, zinco, ferro, ítrio e manganês. Este trabalho demonstrou a possibilidade de se utilizar amostras apreendidas nas ruas para a criação de um banco de dados para o monitoramento da maconha consumida no país.
The main task of this work was to verify the existing differences in the elemental composition of samples seized in the main Brazilian regions of marijuana production, previously separated by their carbon and nitrogen stable isotope results, and to use these differences to classify the samples according to their geographical origins. The sector field inductively coupled plasma mass spectrometry technique (HR-ICP-MS) was the analytical technique applied and the data analysis was performed using hierarchical cluster and linear discriminant analysis. Results indicate that samples from different regions present different chemical profiles that appear in accordance to the geological characteristics of each region. The most relevant parameters were carbon and nitrogen stable isotopes, copper, cobalt, barium, lanthanum, zinc, iron, yttrium and manganese. An interesting product of this work was to demonstrate the possibility of using seized samples to create a national databank for monitoring the geographical origin of marijuana consumed in the country.
Keywords: forensic science, drug sourcing, marijuana, chemical fingerprint, linear discriminant analysis
Introduction
Nowadays, the consumption and production of drugs involves almost all countries, moving about US$ 500
billions per year around the world. According to 2004
United Nations Office on Drugs and Crime (UNODC) report, 3% of the worldwide population (185 millions of people) or 4.7% in the 15 to 64 year-old population bracket
use illicit drugs.1 Marijuana or
a 32,000 tons a year. Amphetamine, cocaine and heroin users are about 30, 13 and 9 millions of people, respectively.1
South America is one of the major producer, dealer and consumer points of illicit drugs. Originally, Brazil was conceived as a classical transit country for cocaine produced in Colombia and Bolivia. However, in the last decades this picture has been changed and Brazil became a significant producer of narcotics moving about 10 billion dollars a
year.1 The efforts to combat drug trafficking allied to the
rise in production, place Brazil in fourth in quantities of marijuana apprehension, while Mexico, USA and Nigeria
lead this rank.1 As a consequence, the country has been
gathering all the features related to this problem: production,
traffic, consumption, violence and money laundering.2
Despite of this huge and increasing problem, detailed studies regarding to production, dealing and consumption of this drug in Brazil are still scarce. Official data provided by
the Brazilian Federal Police Department3 (DPF) suggest that
the main producing zones in the country are located in the Northeastern region, more specifically in the semi-arid zone between Pernambuco and Bahia States, known as the Marijuana Polygon, and in the Midwestern region, along the Brazil-Paraguayan border. However, the intensive and sustained field raids promoted by Brazilian Federal Police between 1999 and 2003 in the Northern Region eradicated
about 10 millions of Cannabis plants, reducing the local
productivity, forcing the producers to migrate to other States, mainly those located in country’s North region such as Pará and Maranhão which could cause changes in the traffic routes
throughout the country.3,4 Nowadays, the apprehensions
accomplished by the Brazilian Police in the main consumption centers as is the case of São Paulo city, suggest
that most of these drugs are coming from Paraguay, via Mato
Grosso do Sul route or from producing regions located along
this Brazil-Paraguayan border.5 Furthermore, recent
information also indicates the rising of traffic between Paraguay and Northern Region, mainly Ceará State.
Shibuya et al.6,7 used carbon and nitrogen stable
isotopes to investigate the climatic conditions of marijuana growth for samples seized in different Brazilian regions. Some samples from Ceará and Pernambuco appear to be cultivated in humid regions, inconsistently to the local climate, except by the existence of highly irrigated area
with soil managemental practices.7 According to the
authors, although these results point to the existence of
traffic routes between Northern and Midwestern region,7
additional investigations would be necessary for conclusive results.
The use of chemical fingerprint has escalated in order to set a classification pattern that can match drug samples
to their geographical origin. This fingerprint can be
established using samples organic,8-11 inorganic6,12-19 or
isotopic20-24 profiles which are related to the plant growth
conditions such as climatic conditions and elements availability in the soil. Although each one of these strategies provide very interesting and powerful results, the use of a set of variables independents from each other would be able to provides complementary information which could make it a distinct feature in the sourcing their origins.19,25
Generally, the plants inorganic profile reflects the elemental availability in the soil. This feature allows the using of plant samples as environmental pollution biomonitor, hence they can appear as element accumulator,
mainly for toxic metals.26,27 There are many articles in the
literature that show the feasibility of using these chemical profile to source the origin of agricultural materials such as wine,18 wheat,19 tea17,28 and barley25 however data related
to Cannabis samples are still scarce.3,11,13
Coffman and Gentner had shown that Cannabis plants
cultivated in acidic soils present higher absorption for Mn,
Fe and Zn.8 Lately, the same authors evaluated the
chemical composition (nutrients and cannabinoids levels)
of plants cultivated using mineral fertilizers.9 Although
some correlations were noted, the data gathered did not prove conclusive to track the geographical origin of these
samples due to the large quantity of related parameters.9
The nutrient profile determined by atomic absorption spectrometry technique associated to linear discriminant
analysis were used by Landi14 in classifying samples from
different regions of Italy, previously separated in inflorescences and leaves. Although 100% of inflorescences samples were successfully classified, according to the author the methodology did not prove itself potentially viable in the analysis of real samples
due to the complexity of the problem.14
The use of inductively coupled plasma mass spectrometry (ICP-MS), a more sensitive technique,
allowed Watling16 to analyze non-essential elements and
micronutrients that are present in lower concentrations in plants. About 45 elements were measured qualitatively in samples from Australia, and the most relevant ones to discriminate the different regions in the country were rare earth elements (REE), Au, Th, U e W. Some hydroponics
Cannabis were also analyzed and their results are
extremely concise with low dispersion rates.16
Unlike inorganic profile, the stable carbon and nitrogen isotopic compositions in plants are strongly related to the climate, mainly water availability, other than temperature,
light intensity and nutrients contents on the soil.29-32
been grown under very distinct climatic conditions,6,24 this
correlation makes them useful to delimit their potential producing areas, and works that use these parameters in
the sourcing the origin of illicit drugs such as heroin,20
cocaine21,22 and Cannabis24,33,34 have escalated in recent
years. Shibuya et al.6 proved the potentiality of isotope ratio
mass spectrometry (IRMS) in the establishment of the
potential regions of Cannabis productions in Brazil, clearly
separating samples from humid and dry regions. However this technique was not satisfactory in identifying the origin of some samples from areas far away from each other that present similar climatic conditions, and in this way, the model shows some overlapping between Midwestern and
Amazon groups.6,7 According to the authors, in this case,
additional information such as the inorganic profiles could
be used to access a better discrimination.6,7
The aim of this work was to verify the existing differences in the elemental composition of samples seized in the main Brazilian regions of marijuana production, previously separated by their stable isotope results, and use these differences to separate samples according to their origins. The sector field inductively coupled plasma mass spectrometry techniques (HR-ICP-MS) was the analytical technique applied and the data analysis was performed using hierarchical cluster and linear discriminant analysis. This work was based on samples seized in the street and has been performed in collaboration to São Paulo State Police Department.
Experimental
Samples
All samples analyzed in this work were seized by the State law enforcement officers in the three different Brazilian regions that present the highest levels of seizures and eradications (see Table 1) and forwarded to the Instituto de Pesquisas Energéticas e Nucleares (IPEN) by
the Institutes of Criminalistic (IC) of each State. With exception of 5 samples from Mato Grosso do Sul apprehended in 2004 all seizures were performed between
1999 and 2002. In previous works,6,7 these samples had
their carbon and nitrogen stable isotopic compositions measured and were previously clustered according to their climatic growth conditions (see Table 1).
Methodology
The measurements of inorganic constituents were carried out using a sector field inductively coupled plasma mass spectrometry HR-ICP-MS, Element 1, Finnigan MAT, with the following configuration: CETAC 500 AX autosampler, nickel skimmer cones, Scott nebulizer chamber and Meinhard nebulizer. The wet digestion was performed using a closed vessel microwave oven (MARS 5, CEM CO., model HP-500), a system with temperature and pressure controls.
Initially 39 elements were analyzed (Ag, Al, Au, Ba, Be, Bi, Cd, Ce, Co, Cr, Er, Eu, Fe, Ga, Hf, Ho, In, La, Li, Lu, Mn, Mo, Nd, Ni, Pb, Pr, Rb, Sb, Sc, Sn, Sm, Sr, Th, Tl, Tm, U, V, Yb, Zn) but some on them (such as heavy rare earth elements, Ag, Cd, Au, In and Sc) were below the quantification limits, and the methodology was reduced
to 19 elements. The measured isotopes were 27Al, 59Co,
85Rb, 87Sr, 89Y, 95Mo, 138Ba, 139La, 140Ce, 141Pr, 143Nd, 208Pb,
232Th, 238U in low (m/
Δm = 300) and 69Ga, 65Cu, 66Zn, 56Fe,
55Mn in medium resolution (m/Δm = 3000), with indium
and scandium as internal standard, respectively. The accuracy and precision of this methodology were evaluated using a standard reference material NIST SRM 1547 (peach leaves), which was analyzed in hexaplicate. For Sr, In and Ba the isobaric interferences were corrected using mathematical equations available in the Element software. It was not observed significant interferences for
59Co in low resolution. The HR-ICP-MS experimental
parameters were listed in Table 2.
Table 1. Main Brazilian producer regions, total of samples analyzed and groupings according to their IR-MS results
State Symbol Region Status Samples Groupings
(outliers) according to IR-MS results - calibration sets
Producer and
Mato Grosso do Sul MS Midwest transit State for 30 Region 1 (30)
Paraguayan Cannabis
Pernambuco PE Northeast Producer 46 (4) Region 2 (42)
Bahia BA Producer 20 Region 2 (20)
Maranhão MA Producer 12 Region 2 - dry (7)
Region 3 - wet (5)
Ceará CE Local producer 25 (9) Region 2 (16)
Pará PA North Producer 20 Region 3 (20)
Sample preparation
The samples were cleaned in sonicator for about 30 minutes in de-ionized water (twice), dried at 40 °C for about 24 hours, and ground in an electric mill with ceramic mortar and pestle. The wet digestion was based on the methodology
developed by Baffi et al.35 About 250 mg of material was
weighted in a teflon PFA tubes (HP-500, 100 mL), and then
was added 7 mL of HNO3 65% (40% m/v, suprapur, Merck),
1 mL H2O2 (30%, analytical grade, Merck) and 200 µL of
HF (40%, suprapur, Merck). The calibration solutions were
prepared from SPEX solutions (1 000 µg g-1) in 2% HNO
3.
Data analysis
The assessment of the results and the building of a model to classify unknown samples followed the hierarchical cluster (HCA) and linear discriminant analysis (LDA), using SPSS (Statistical Package for Social Science) program, version 10.0.5.
HCA aims to identify relatively homogeneous groups of
objects (cases or variables) based on selected characteristics,36
using an algorithm that starts with each sample or variable in a separate cluster and combines clusters until only one is left. Distance (dissimilarity) or similarity measures are generated comparing each pair of sample or variable and each one of these objects will be very similar to the other ones in the same cluster, regarding to predetermined selection criteria. The results are presented in dendrograms, a diagram that displays the distance or similarity between groups and provide a visual means of estimating relationships among multidimensional points. The Ward’s method, which was applied in this work, uses an analysis of variance approach to evaluate the distances between clusters and has been proved
to outperform the other hierarchical methods.37
LDA identifies a linear combination of quantitative predictor variables that best characterizes the difference
among known groups (called calibration set).36 Linear
discriminant analysis enhances the separation of the groups, allows a classification of unknown samples and lists the group in which each case is most likely a member,
and also the probability for belonging to this group.36 The
enter-independent-together method builds the model using simultaneously all disposable variables while stepwise method selects the most relevant ones, reducing the data set. These new variables are called canonical variables. The first canonical variable account for a large proportion of the variability within the original data and the plot is defined, so that the most significant differences among the groups are displayed along the horizontal axis. The second canonical variable represents the maximum dispersion in a perpendicular direction to the first one,
and so forth.36
Previous results
The isotopic profiles between samples from dry (Pernambuco, Bahia e Ceará) and humid regions (Maranhão, Pará e Mato Grosso do Sul) presented by
Shibuya et al.6,7 were clearly different, indicating that these
variables can be used to obtain information regarding the climate of the producing zones. The high dispersion rate
for δ13C for the Maranhão group could be explained by the
peculiar geographical situation of its Western expanse, whose climate and vegetation are similar to those of the Northern region (the Amazon region), whereas its Eastern
area presents a semi-arid climate.6
Despite the existing information about highly
irrigated Cannabis cultures in Pernambuco and Bahia,
no overlapping was observed between these groups and samples from more humid regions. On the other hand,
the high dispersion rate observed for δ 15N especially
for samples from Pernambuco indicates Cannabis
cultures throughout, from the semi-arid region to areas around the São Francisco River Basin and the
woodlands (Zona da Mata), as well as utilization of
fertilizers.6,7
This information obtained through the IR-MS technique was used to group the samples and defining the calibration set, as per Table 1. Four samples from
Pernambuco State presented δ15N values above 8‰, which
may be associated to the use of organic fertilizers (such as animal manure) and nine samples from Ceará seem to
be originated from Paraguay-Mato Grosso do Sul Route.6,7
Results and Discussion
The results for SRM NIST 1547 indicated good accuracy, with a recovery better than 90% for the certified
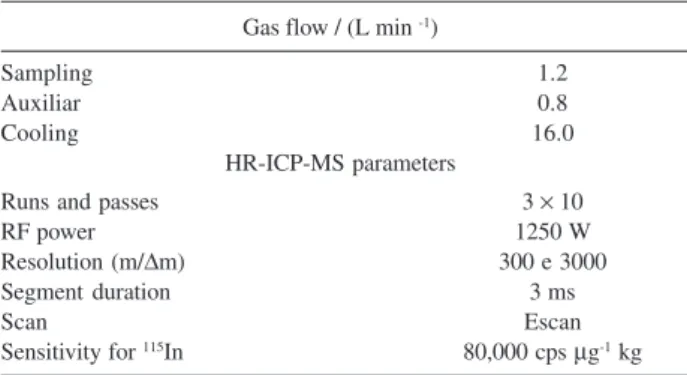
Table 2. HR-ICP-MS instrumental settings and data acquisition parameters
Gas flow / (L min -1)
Sampling 1.2
Auxiliar 0.8
Cooling 16.0
HR-ICP-MS parameters
Runs and passes 3 × 10
RF power 1250 W
Resolution (m/Δm) 300 e 3000
Segment duration 3 ms
Scan Escan
elements. Quantification limits, defined as 10σ (n=8)
ranges from 0.02 (for U) to 12 ng g-1 (for Zn).
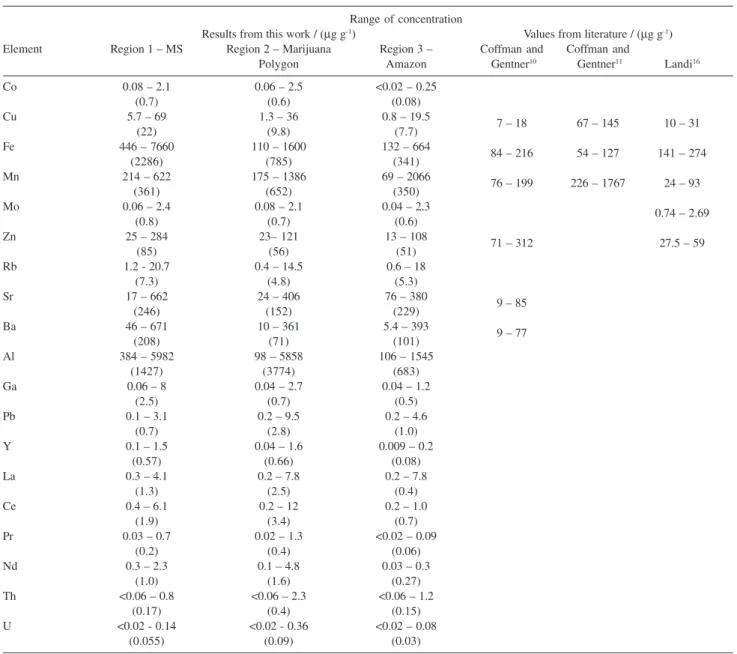
The results of all set of elements are listed in Table 3 together with the data obtained from literature where by comparison the Brazilian samples presented high Fe, Sr
and Ba levels and low concentrations of Mo and Cu.8,9
It can be observed that nutrient contents in samples from Region 1 (Mato Grosso do Sul) were high, mainly for Cu and Fe. Aluminium, Ga and Ba levels were also higher than those for the other groups (Table 3). Most soils of this region are of volcanic origin (magmatic rocks, most of them pholeiitic basalt), naturally acidic soils with excess Al. Iron and Mn, also are abundant element in basalt-derived soils, such as this case and Fe
can reach toxic levels according the soil’s pH (pH < 5.0).38
In comparison to the literature data, Cu and Zn concentrations for these samples were similar to those
obtained by Landi,14 although lower than those presented
by Coffman and Gentner.9 It is well known that Zn
deficiency is the most generalized and critical in those regions and is probably related to the composition of the
parent material.38 The Mo value in
Cannabis samples was also lower than those available in the literature, which
may point out to a deficiency of this element in the soil.38
Samples seized in Region 2 (Marijuana Polygon) presented high levels of U, Th, Pb, Mn and rare earth elements (REE), mainly lanthanum and cerium. The soils
Table 3. Range of concentration for Cannabis samples from three main Brazilian producing zones and data from the literature. Mean values are presented in parenthesis
Range of concentration
Results from this work / (µg g-1) Values from literature / (µg g-1) Element Region 1 – MS Region 2 – Marijuana Region 3 – Coffman and Coffman and
Polygon Amazon Gentner10 Gentner11 Landi16
Co 0.08 – 2.1 0.06 – 2.5 <0.02 – 0.25
(0.7) (0.6) (0.08)
Cu 5.7 – 69 1.3 – 36 0.8 – 19.5
(22) (9.8) (7.7) 7 – 18 67 – 145 10 – 31
Fe 446 – 7660 110 – 1600 132 – 664
(2286) (785) (341) 84 – 216 54 – 127 141 – 274
Mn 214 – 622 175 – 1386 69 – 2066
(361) (652) (350) 76 – 199 226 – 1767 24 – 93
Mo 0.06 – 2.4 0.08 – 2.1 0.04 – 2.3
(0.8) (0.7) (0.6) 0.74 – 2.69
Zn 25 – 284 23– 121 13 – 108
(85) (56) (51) 71 – 312 27.5 – 59
Rb 1.2 - 20.7 0.4 – 14.5 0.6 – 18
(7.3) (4.8) (5.3)
Sr 17 – 662 24 – 406 76 – 380
(246) (152) (229) 9 – 85
Ba 46 – 671 10 – 361 5.4 – 393
(208) (71) (101) 9 – 77
Al 384 – 5982 98 – 5858 106 – 1545
(1427) (3774) (683)
Ga 0.06 – 8 0.04 – 2.7 0.04 – 1.2
(2.5) (0.7) (0.5)
Pb 0.1 – 3.1 0.2 – 9.5 0.2 – 4.6
(0.7) (2.8) (1.0)
Y 0.1 – 1.5 0.04 – 1.6 0.009 – 0.2
(0.57) (0.66) (0.08)
La 0.3 – 4.1 0.2 – 7.8 0.2 – 7.8
(1.3) (2.5) (0.4)
Ce 0.4 – 6.1 0.2 – 12 0.2 – 1.0
(1.9) (3.4) (0.7)
Pr 0.03 – 0.7 0.02 – 1.3 <0.02 – 0.09
(0.2) (0.4) (0.06)
Nd 0.3 – 2.3 0.1 – 4.8 0.03 – 0.3
(1.0) (1.6) (0.27)
Th <0.06 – 0.8 <0.06 – 2.3 <0.06 – 1.2
(0.17) (0.4) (0.15)
U <0.02 - 0.14 <0.02 - 0.36 <0.02 – 0.08
of that region are in largely formed of granitic rocks and
granulites,39 which are naturally lanthanides-enriched (in
some cases extremely enriched).40,41 The levels of Zn and
Mo nutrients are similar to those observed for Regions 1 and 3, the Zn level below the values described by Coffman
and Gentner9 (Table 3), whereas the Mn average appeared
above those of the other groups. According to Horowitz and Dantas, Mn concentrations are high in the
Northeastern dry backcountry (Sertão) probably as a
consequence of low precipitation rates, low content of
organic matter and relatively low pH.40 Copper,
nevertheless, was considerably lower than those of Region 1. The deficiency of that element is well known, notably its absorption by plants inhibited by high Fe
concentrations, current in that region.42,46 Leon finds that
the soils in the dry backcountry of the Northeast (Sertão)
apparently do not present Mn deficiencies nor do those of
the semi-arid region (Agreste) appear to present Zn and
Mo deficiencies.43 Variability of those elements in the
Northeastern samples was large, and in accordance to the results obtained by stable isotopic profiles may indicate that they were produced not only in the Pernambuco dry
backcountry (Sertão), but also in others locations with
lower deficiency of nutrients, such as the semi-arid region (Agreste) and the woodlands (Zona da Mata).
The concentrations of Cu, Mo and Zn nutrients obtained for Region 3 (Amazon) samples were similar to the levels reported for Region 2. The samples seized in Region 3 also showed low concentrations of cobalt (below
100 ng g-1), whereas the average arrived at for this element
in samples coming from other regions was above 600 ng
g-1 (Table 3). The low levels of concentration referring to
practically all of the elements in samples from the Amazon Region may be explained by the intense leaching of those
soils.44 Despite the region’s great geological diversity,45
the climatic conditions strongly affect the soil’s physical
and chemical properties,46 hence the similarity in chemical
profile of this group’s samples.
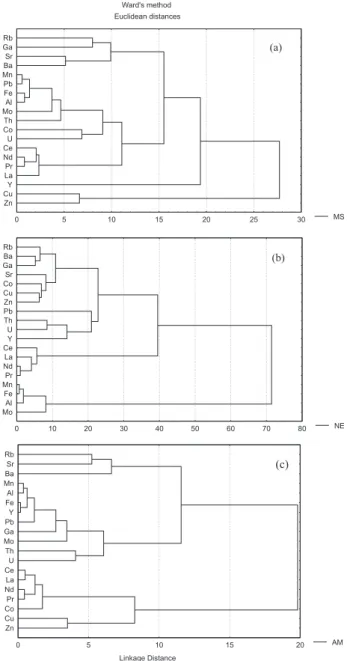
As expected, the correlation between the elements for each region, evaluated using hierarchical cluster analysis shows a strong correlation between the lanthanides and also between Al, Mn and Fe (Figure 1). In the Amazon Region, Co, Cu and Zn appear correlated to lanthanides, while in the Northern group this nutrients appear related to Rb, Sr, Ba and Ga. In Region 1 (MS), Zn and Cu appear as independent from the others elements while Co is related to U (Figure 1).
The hierarchical cluster analysis using Ward’s method, based on inorganic profile was tested to evaluate the discriminatory capability of these variables. This analysis provided three different clusters, as follow.
The first one was composed by samples from humid and dry regions. These groups is subdivided in two branches, the first one composed by samples from MS (6), PA (18), MA (10), and Marijuana Polygon (16) and the second one formed by samples from Marijuana Polygon (15), with 2 samples from MA and one from PA.
The second group was basically formed by samples from MS (23), including samples from PA (1), BA (1) and PE (1). It is very interesting to notice that the 9 samples from Ceará State, which were previously considered outliers based on stable isotopic profiles (Table 1), clearly belong to this group, presenting elemental profile similar to those seized in Mato Grosso do Sul.
The last group was formed basically by samples from Marijuana Polygon, except by one sample from MS, including the remaining ones from BA, PE and CE.
Evaluating the chemical profile of each cluster it can be noted that the first cluster gathers samples with low concentrations levels for almost all set of elements, while the last one presents high levels of lanthanides, U, Th, Mn, Al, Cu and Pb. The second cluster presented high levels of Ba, Sr, Fe and Mo. However, despite this separation, the classification regarding to their origin was not satisfactory.
The use of all set of parameters (inorganic and isotopic profiles) improves this separation eliminating the previously observed overlapping although samples from Marijuana Polygon were divided in two distinct groups, which was also observed for Mato Grosso do Sul group. As follow, this analysis provides four different
clusters: i) samples from Northern Region (9 from BA,
18 from PE and 4 from CE), including the 7 samples from MA with isotopic profile typical of dry regions (see
Table 1) and one sample from PA; ii) samples from humid
regions subdivided in Amazon (19 from PA and 5 from MA) and Mato Grosso do Sul (18), including the 9 samples from CE that probably were originated from
Paraguay, 3 from PE and 1 from BA; iii) the remaining
samples from MS; iv) the rest of samples from Marijuana
Polygon, including the remaining ones from CE. It is interesting to notice that 2 samples from Pernambuco that presented isotopic profiles different from the rest of the group (see Table 1) are clustered together with samples from Mato Grosso do Sul. The discrimination between clusters 1 and 4 (both formed by samples from Marijuana Polygon) is related mainly to the levels of lanthanides, Y, Th, U, Co, Rb and Al, as can be seen in Figure 2a. The groups from MS (cluster 2) that seems to be different from the other samples from this location (cluster 3) differs by the levels of Fe, Al, Co, Cu, Zn, Ga and also lanthanides (see Figure 2b).
Despite of the indicatives that Cannabis is cultivated
in different locations within the producing States, or under different cultivation conditions such as the use of mineral fertilizers that could alter the soil geochemistry properties, in general, these exploratory analyses seem to confirm the previous groupings achieved by using carbon and nitrogen isotopic profiles. Hence, samples from different Northern States cannot be separated from each other however the elemental compositions appear to be very useful to improve the separation between Amazon Region and Mato Grosso do Sul groups, that present similar climatic conditions and could not be clearly separated based only in isotopic profiles.
The pre-evaluation of data by using stable isotopes is important, since the temperature and water availability bear a significant influence upon the soil’s physical and chemical properties, which affect directly the chemical reactions occurring therein, defining besides its pH, also the availability of nutrient elements and the ion
predominant in the soil solution.46 Generally speaking,
soils formed in tropical climates present high weathering
rates as compared to those under temperate climates.46
The more humid and warmer the climate, the stronger the mineral leaching, once heavy rainfall leaches basic ions such as calcium and magnesium and replaces them with acidic ions such as hydrogen and aluminum, such as
for example that of the Amazon Region.47 On the contrary,
soils from arid regions tend to become alkaline, once
rainfall is not heavy enough to leach basic ions.46
Once the exploratory analysis and the establishment of the calibration set were completed, a classification model was proposed based on the linear discriminant analysis (LDA). This evaluation aims to determine the most relevant parameters and the establishment of a methodology that provides the probability of the samples for belonging to
each group. Once this technique should be based on samples of known origin and the inclusion of some of them with unclear source could mislead the development of the model, the previously identified isotopic outliers (see Table 1) were not taken into consideration in the calibration set.
Using all the set of variables (enter independent together method) 100% of the calibration set are assigned to their correct group. The stepwise selection of variables also allowed a 100% successful classification with using 10 out of the 21 available variables. The cross validation, the procedure in which each case is classified into a group according to the classification functions computed from
all the data except the case being classified,36 offered
similar results (97.8% overall rate of successfully classified cases), with two samples seized in the Region 2 (Marijuana Polygon) classified as originating from Region 1, and one sample from Region 3 (Amazon) as originating from Region 2 (the same one classified in cluster 1 in the cluster analysis using all the set of variables).
The most relevant parameters in this discrimination
were: δ13C, δ 15N, Ba and Mn in function 1 (F1) and
δ13C, Cu, Co, La, Zn, Y, and Fe in function 2 (F2) - Table
4. According to these results, the climatic conditions are the most relevant features in defining the differences between samples from the studied regions, followed by the micro and macronutrients as well as the rare earth elements availability in the soil.
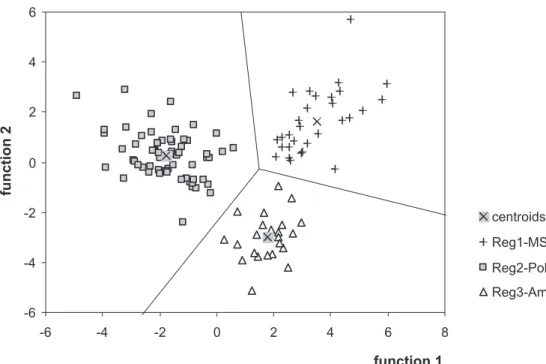
The territorial map and samples from Regions 1, 2 and 3 in the canonical variable plot can be seen in Figure 3. This figure shows the discrimination between Regions 1 and 2 is basically related to F1, a parameter associated with climatic conditions; on the other hand, Region 3 samples can be distinguished from the rest of them by the fact that they present a lower F2 (mostly associated with
δ13C in addition to the levels of nutrient elements).
Conclusions
This work demonstrated that the use of high performance analytical techniques associated to chemometric methods represent a powerful tool in tracking the geographic origin of marijuana samples. Despite the inaccuracy of the elemental profile alone in the sourcing
Table 4. Pooled within-groups correlations between discriminating vari-ables and standardized canonical discriminant functions. The varivari-ables are ordered by absolute size of correlation within function
Structure Matrix
Function
1 2
δ 13C -0.633* 0.499
δ 15N 0.551* 0.007
Ba 0.228* 0.213
Mn -0.037* 0.017
Cu 0.249 0.377*
Co -0.009 0.329*
La -0.208 0.250*
Zn 0.149 0.238*
Y 0.009 0.067*
Fe -0.016 0.035*
*Largest absolute correlation between each variable and any discrimi-nant function.
the origin of marijuana samples, the results clearly show the existence of three, or even four different sites of
Cannabis production regarding to the soil geochemical properties. The IR-MS technique has proved itself particularly useful in a preliminary evaluation of the samples, by clearly separating materials from humid and dry regions. Furthermore, these parameters were indispensable for the correct classification of the groups by cluster and linear discriminant analysis that could be achieved successfully using HR-ICP-MS and IR-MS data jointly.
While hierarchical cluster analysis represents a very useful toll in exploratory analysis, linear discriminant analysis was extremely helpful to summarize many variables by a few factors, determining the most important parameters in these groups separation and proving itself to be fundamental to the evaluation of results. Despite of that, the obtaining of reliable results depends on a full understanding of the problem under consideration and of all variables involved.
The sampling strategy adopted yielded highly significant results, mainly from the point of view of forensic science. The results will be helpfull in the establishment of chemical fingerprints for marijuana traded in Brazil and this model would be useful in the future in classifying unknown samples. A great agreement between the results obtained and the geological characteristics of the region under study was observed such as low rare earth elements levels for regions 1 and 3, in contrast with those seized in the Polygon region. This work demonstrated that samples daily seized by the Law Enforcement Officers could be used for the purpose of creating a national databank of production sites, which will be very helpful in tracking the routes of distribution of the drug throughout the country.
Acknowledgments
Fapesp, FINEP/PADCT, Institutes of Criminalistic from Bahia, Ceará, Maranhão, Mato Grosso do Sul, Pará and Pernambuco States.
References
1. United Nation Office on Drugs and Crime (UNODC), World Drug Report 2004, United Nations Publications: New York, 2004, vol. 1.
2. Schiray, M.; Globalisation, Drugs and Criminalisation - Drug
Trafficking, Criminal Organizations, Money Laundering and
Public Policy on Drug Control, United Nations Publications (UNESCO): Marseille, 2002.
3. http://www.dpf.gov.br, acessed in May 2005.
4. Francisco, L.; Produção de Maconha “Migra” para o MA, Jornal Folha de São Paulo, São Paulo, Caderno Brasil, 05 de dezembro de 1999.
5. Office on Drugs and Crime (UNODC), Global Illicit Drugs Trends 2003, United Nations Publications: New York, 2004. 6. Shibuya, E. K.; Sarkis, J. E. S.; Negrini-Neto, O.; Moreira, M.
Z.; Victória, R. L.; Forensic Sci. Int. 2006, 160, 35.
7. Shibuya, E. K.; Sarkis, J. E. S.; Negrini-Neto, O; Martinelli, L. A.; Forensic Sci. Int., in press. (DOI 10.1016/j.forsciint.2006.06.002) 8. Coffman, C. B.; Gentner, W. A.; Agron. J. 1975, 67, 491. 9. Coffman, C. B.; Gentner, W. A.; Agron. J. 1977, 69, 832. 10. Desage, M.; Guilluy, R.; Brazier, J. L.; Anal. Chim. Acta1991,
247, 249.
11. Stefanidou, M.; Dona, A.; Athanaselis, A.; Papoutsis, I.; Koutselinis, A.; Forensic Sci. Int. 1998, 95, 153.
12. Schwartz, R. S.; Hecking, L. T.; J. Anal. At. Spectrom. 1996, 6, 637.
13. Besacier, F.; Chaudron-Thozet, H.; Rousseau-Tsangaris, M.; Girard, J.; Lamotte, A.; Forensic Sci. Int. 1997, 85, 113. 14. Landi, S.; J. Plant. Nutr.1997, 20, 311.
15. Martín, M. J.; Pablos, F.; González, A. G.; Anal. Chim. Acta 1998, 358, 177.
16. Watling, R. J.; J. Anal. At. Spectrom. 1998, 13, 917. 17. Moreda-Piñero, A.; Fischer, A.; Hill, A. J.; J. Food Comp. Anal.
2003, 16, 195.
18. Taylor, V. F.; Longerich. H. P.; Greenough, J. D.; J. Agric. Food Chem. 2003, 51, 856.
19. Branch, S.; Burke, S.; Evans, P.; Fairman. B.; Briche, C. S. J. W.; J. Anal. At. Spectrom. 2003, 18, 17.
20. Besacier, F.; Guilluy, R.; Brazier, J. L.; Chaudron-Thozet, H.; Girard, J.; Lamotte, A.; J. Forensic Sci. 1997, 42, 429. 21. Ehleringer, J. R.; Casale, J. F.; Lott, M. J.; Ford, V. L.; Nature
2000, 408, 311.
22. Ehleringer, J. R.; Cooper, D. A.; Lott, M. J.; Cook, C. S.; Forensic Sci. Int. 1999, 106, 27.
23. Ehleringer, J. R.; Bowling, D. R.; Flanagan, L. B.; Fessenden, J.; Helliker, B.; Martinelli, L. A.; Ometto, J. P.; Plant Biology 2002, 4, 181.
24. Denton, T. M.; Schmidt, S.; Critchley, C.; Sterwart, G. R.; Aust.
J. Plant Physiol.2001, 28, 1005.
25. Husted, S.; Mikkelsen, B. F.; Jensen, J.; Nielsen, N. E.; Anal.
Bioanal. Chem. 2004, 378, 171.
26. Miner, G. S.; Gutierrez. R.; King, L. D.; Environ. Qual. 1997,
26, 989.
27. Bargardi, R.; Sci. Total Environ. 1995, 176, 121.
28. Marcos, A.; Fisher, A.; Gerry. R.; Hill, S. J.; J. Anal. At. Spectrom. 1998, 13, 521.
29. Handley, L. L.; Austin, A. T.; Robinson, D.; Scrimgeour, C. M.; Rave, J. A.; Heaton, T. H. E.; Schmidt. S.; Stewart, G. R.;
30. Martinelli, L. A.; Piccolo, M. C.; Townsend, A. R.; Vitousek, P. M.; Cuevas, E.; McDowell, W.; Robertson, G. P.; Santos, O. C.; Treseder, K.; Biogeochemistry 1999, 46, 45.
31. Farquhar, G. D.; Leary, M. H. O.; Berry, J. A.; Aust. J. Plant
Physiol. 1982, 9, 121.
32. Leary, M. H. O.; Bioscience 1988, 38, 328.
33. Galimov, E. M.; Sevastyanov, V. S.; Kulbachevskaya, E. V.; Golyavin, A. A.; Rapid Commun. Mass Spectrom. 2005, 19, 1213. 34. Liu, J. H.; Wen-Fa Lin, L. L.; Fitzgerald, M. P.; Sazena ,S. C.;
Shieh, Y. N.; J. Forensic Sci.1979, 24, 814.
35. Baffi, C.; Bettinelli, M.; Beone, G. M.; Spezia, S.; Chemosphere 2002, 48, 299.
36. SPSS Base 10.0 Applications Guide, 1999, p. 243. 37. Harrigan, K. R.; Strat. Mgmt. J. 1985, 6, 55.
38. Lopes, A. S.; Solos Sob Cerrado, Yamada, T., ed., Piracicaba: Brazil, 1983.
39. Sial, A.N.; Mariano, G.; Ferreira, V. P.; Geoquímica dos Elementos Terras Raras no Brasil, CPRM/DNPM, 1989, p. 83. 40. Horowitz, A.; Dantas, H. S.; Pesqui. Agropecu. Bras. 1966, 1,
383.
41. Figueiredo, M. C. H.; Hartmann, L. A.; Geoquímica dos Elementos Terras Raras no Brasil, CPRM/DNPM, 1989, p. 99. 42. http://www.cprm.gov.br/geo/belem.html, acessed in May 2004. 43. León, L. A.; Lopez, A. S.; Vlek, P. L. G.; Fertilizer Research
1985, 7, 95.
44. http://www.amazonialegal.com.br/textos/Solos.htm, acessed in January 2005
45. Malavolta, E.; Amazônia, Seus Solos e Outros Recursos
Naturais, Vieira, L. S.; Santos, P. C. T. C., eds., Agronômica Ceres: São Paulo, 1987.
46. Kabata-Pendias, A.; Pendias, H.; Trace Elements in Soils and Plants, 2nd ed., CRC Press: Florida, 1985.
47. Rodrigues, M. R. L.; Ph.D. Thesis, Universidade de São Paulo, Brazil, 1998.
Received: March 13, 2006
Web Release Date: January 24, 2007