Retirement Behavior of the Elderly in Europe: The
Importance of Being Healthy
Yan Yang 529
03 June 2013
The Project carried out on the Health Economics course, under the supervision of:
1 Abstract
This work project addresses elderly individuals’ retirement behavior in 16 European countries. I use the longitudinal Survey of Health, Aging and Retirement in Europe (SHARE), Wave 4,
to analyze the dynamic relationship between health and men and women’s retirement decision in later life. The evidence suggests that each health indicator (severe and mild condition,
obesity, having restrictions in activities of daily living and grip strength) has its own
significant effect on individual’s retirement decisions. Such effect varies across countries, and differs from men to women. Moreover, the empirical analysis shows that some socio
demographic indicators are also very important for aging people’s retirement decision, especially, the education level.
Keywords: health, retirement, SHARE, Europe
I-Introduction
Nowadays, retirement is associated with pension benefits in most countries. People can
choose to retire early when there are pension benefits eligible for them, or can be forced to be
retire due to physical problems like illness or disability. Reports show that the retirement age
varies from country to country,1 and the gap is even bigger between gender in some societies. Due to the business depression, governments often opt to adjust legal retirement ages and
pension plans as a measure to early retirement. But on the other hand, some studies concluded
that health related motives are an important determinants of early retirement. Thus,
adjustment in retirement age will have small impact on some individuals and will likely force
some people to work when they are sick.
Changes in retirement age and the value of pensions may restore the Social Security System’s balance (followed by government budget’s). In 2012, Portuguese Government increased the public sector legal retirement age to 65, announced that early retirements would be suspended,
and that the pensions of those who retired in 2011 were expected to be reduced by 3.14%,
according to the increase in pension sustainability index.2 The legal retirement age for other
1
For exemple: “Average Effective Age of Retirement versus The Official Age in 2011 in OECD countries”.
2
2
European countries varies between 60 and 67, and it may also differ from men to women. The
majority of these countries are also planning to increase it over the next years.
It is well known that the life expectancy has been increasing while the fertility rates and death
rates have been decreasing. According to the Organization for Economic Co-operation and
Development (OECD) report, “Life Expectancy” (2013), Portugal and some European countries have a life expectancy between 74 and 83 (in 2010 or latest available year, see Table
1). This represents a growth of about 13 years since 1970. Hungary registered the lowest life
expectancy, Switzerland the highest, and Portugal is above the average. Increasing life
expectancy should not constitute as an incentive for early retirement, however such happens
in practice. In Graph 1 and 2 we can see that, for both men and women, the majority of
European countries have an average effective retirement age higher than the legal retirement
age. This is the case of countries like Estonia, Portugal and Switzerland. Sauré and Zoabi
(2011) defended in their study that the reasons for such a large average effective retirement
age in a country, could be driven from social security rules, as well as the composition of
occupations within an economy. The population is aging and people try to retire earlier and
earlier. Thus, the participation of aging populations in labour market or the elderly retirement
probability becomes a key issue that affects the economy. Since the large expected value of
older population influences the future labour supply market, the study of the factors which
affect the retirement behavior later in life becomes an important research question.
As already mentioned, health status is one of the main factors that influence elderly people’s retirement decision. Using the database from SHARE - Wave 1, Kalwij and Vermeulen (2005)
indicate that health is an important determinant of the age at which people retire. According to Kalwij and Vermeulen (2005), health indicators have their own impact on one’s participation decisions, and the effects differ markedly between countries. From the 11 countries analyzed
by Kalwij and Vermeulen, only two (Greece and Switzerland) showed that health indicators
were insignificant in the regression for men, and only one country (Austria) showed that
health indicators were insignificant for women.
The choice of an adequate data source is very important for this work project, since it needs
wide demographic range and health status information. As such, the Survey of Health, Ageing
and Retirement in Europe (SHARE) - Wave 4, investigates the reasons that affect the
3 information of individuals’ personal, family and social factors, demographic factors, health status (both physical and mental), employment status, and others.3
Next, in Section II, there is a brief literature review describing some earlier studies about
health and other variables that influence and retirement decision. Section III describes the data
and the methodology used. Section IV specifies in detail the results found. Finally, the most
important conclusions are presented in section V.
II- Literature Review
There are many studies related to the literature on elderly labour force participation (or
retirement probability). As reviewed by Kalwij and Vermeulen (2005), different health
indicators represent a significantly different impact on an individual’s participation later in life, and the participation rates of the majority of the analysed countries would increase if
every elderly were in perfect health condition. Kalwij and Vermeulen studied the elderly
labour force participation for 11 countries in Europe, using health indicators, yearly age
dummies (from 50 to 64) and some social demographic measures. According to this study,
health is multi-dimensional, which means that different health indicators have different
impact on an individuals’ retirement decision. The results show that, for both genders, most
countries have significant age dummies close to 65, as well as significant health and
demographic indicators. Last year, Bosworth and Burke (2012) reinforced this result by
demonstrating that more educated and healthy aged individuals retire later.
Although adjustment in retirement age has proven to be a successful tool to fight against the
public debt and budget deficits across European countries, we cannot ignore that such
adjustments or increase in retirement age would trouble people who have jobs that require
much physical ability. Since the two studies mentioned above proved that health related
indicators are important determinants of retirement decisions, the health status becomes an
indispensable factor of retirement behaviour analysis.
3
Detailed information from SHARE: demographics and networks, social networks, children, physical and mental health, grip strength, puff test, health care, behaviour risk, cognitive function, employment and pensions, social support, financial transfers, household income, housing, assets, consumption, activities, expectations and
4
The women’s participation rates in labour market are lower than men’s in most countries. According to the European Commission’s analysis (Female Labour Market Participation), the gender employment gap is, in 2011, 12.9% for individuals aged between 30 and 54, and
15% for 55 and 64. In addition, this analysis also demonstrates that the female employment
rate for higher age (55 to 64) is very low in European countries like Malta, Slovenia, Greece,
Poland, and Italy. There must be reasons behind the large gap between the women’s and men’s labour participation rates. So, for this project work to be more accurate, the analysis will be done separately for women and men. Kalwij and Vermeulen (2005) already took into
account this aspect, and it was found that if some indicators were significant, for instance, for
men, the same indicators could be insignificant for women, ceteris paribus. In the case of
Greece and Switzerland, some health and demographic variables were significant for women
but not for men.
SHARE contains information about the self-reported health status, but, as suggested by
Bound et al (1991), the self-reported health is likely to be endogenous. Bound et al showed
that by using these endogenous measures the results can be biased. Moreover, these measures
increase the impact of health in the regression than exogenous indicators, then, economic
variables become less important. In fact, as early as 1982, Myers argued that self-reported
health was not useful and raised doubts about the validity of self-reported measures. Later,
more authors tried to construct exogenous instruments for health to substitute endogenous
indicators, like Kerkhofs et al(1999) and Disney et al (2004). The result in Kerkhofs’ study showed that the effect of health was very different from the effect found when using an
endogenous measure for health. Fortunately, apart from the self-reported health status,
SHARE also collected a wide range of other health indicators that allows one to construct
exogenous health indicators. Such indicators are grip strength, restrictions in activities of
daily living, and some illnesses with different levels of severity. The mental health indicator is
also likely to be endogenous.
Reports depicted that in certain periods, a rise of people’s income has been accompanied by a increase in retirement probability. In early 1955, Stecker presented that, generally, elderly
preferred to remain in the labour force market if the retirement pension was much lower than
the earned income. Recently, Bosworth and Burke (2012) measured how the income affect
5
In summary, it is important to study, through econometric model, whether the health
condition is still a key determinant that influence early retirement. If so, the rise in legal
retirement age will not contribute a lot to the solution of debt problems. Moreover, since the
health indicators have different impacts across genders’ retirement decisions, the regressions must be done separately for men and women. The endogeneity problems will also be taken
into account when choosing regressors. Finally, as already demonstrated, income change has
a significant impact on retirement decision, therefore I would like to measure how this affects
European countries.
III- Data and Methodology
3.1 Data and regressors description
The Survey of Health, Ageing and Retirement in Europe (Wave 4) is a multidisciplinary and
cross-national panel database. It collected information about health, socio-economic status
and social and family networks of individuals from 16 European countries (Austria, Belgium,
Czech, Denmark, Estonia, France, Germany, Hungary, Italy, Netherlands, Poland, Portugal,
Slovenia, Spain, Sweden and Switzerland).
This wave of the SHARE survey (2011) contains 58,489 observations, aged between 24 and
111 (in 2010). SHARE’s target population is the age group equal or above 50 years old, on the other hand, the interviewees who have less than 50 are spouses of the target population.
As the legal retirement age of almost all of the countries relies around 65 years old, in this
work project, I focused on the labour force participation of individuals aged under 64 and
above 50, both included, elderly aged below the legal retirement age. After excluding the
individuals below 50 and above 64, the sample is reduced to 27,537 observations, in which
43.75% are men and 56.25% are women. The sample size varies across countries, for example,
Austria, Belgium, Czech, Estonia and France have more than 2,500 observations, while
countries like Germany, Poland and Sweden have less than 800 observations. Table 2 contains
a detailed sample size of each country where samples are divided into three age groups.
Besides Germany and Sweden, which have very few observations between 50 and 54 years
old (3.66% and 3.32% respectively), the majority of the countries have more or less the same
distribution among the age groups. The division of the SHARE sample into 3 age categories
6
that, for both men and women, some countries have no retired individuals in the category of
50-54 years old. In the next age group, the retirement probability increases substantially, and
in the oldest group, the average increases to about 50%.
The health module of SHARE survey collected a lot of micro health data on self-reported
health status, physical health, mental health, health care, grip strength, puff test, disability and
functional status (e.g., ADLs), and symptoms of disease. As referred before, self-reported
health is likely to be endogenous, so it is excluded from the group of the health regressors.
The symptoms of disease were classified in two groups: 1- Severe Health Condition, which
includes stroke and cancer; 2- Mild Health Condition, which includes high blood pressure,
high blood cholesterol, diabetes, chronic lung disease, arthritis, peptic ulcer, hip fracture and
other fractures, the 8 less severe symptoms of disease. In Kalwij and Vermeulen (2005),heart
attack is considered as a severe condition disease, but it was excluded from the present work
project due to incomplete data. The individuals’ height and weight can be used to calculate the Body Mass Index (BMI). According to the World Health Organization, individuals with
BMI above 30 are classified as obese. Since obesity is a well-known risk factor for one’s health, it is considered as a health indicator in this work project. Restrictions in activities of
daily living (ADL) are also included in this group of indicators, and are composed by
limitation in activities, such as walking 100 meters, getting up from a chair, climbing one
flight of stairs, pulling or pushing large objects and other daily living difficulties established in the SHARE survey. The grip strength test is an important tool in assessing an individual’s overall health since it gives a general idea of individual’s vitality. In this work project, this indicator is determined by each individual’s maximum grip strength. The above health indicators are expressed in detail for each country in Table 5 and will be used in later
estimations. The severe health condition level in Sweden is only present in 3.49% of the
observations while in Hungary it is 9.77%. The average of people who experienced severe
condition is only 6.08% in all countries. It is low when comparing with mild condition’s which has an average equal of 57.94%. In practice this means that large proportion of
individuals experienced mild condition in some countries. Once more, Hungary comes in first
with 71.43%, and Belgium, Czech Republic, Estonia, Germany, Poland and Portugal also
with values above 60%. Whilst Germany presents the lowest level (8.33%) of obesity, Estonia
is the first in the list with 29.40%. In average, the population with restrictions in activities of
daily living is relatively low, only about 7%. The mean of maximum of grip strength is
7
The variables on education and the percentage of house owned will be used as socio
demographic indicators in later regressions. Education is divided into high and low levels,
which are classified based on the number of years of study: from 0 to 9 years are considered
low level of education and ≥15 years is considered high level of education. Under normal circumstances, the low education represents degrees lower than high school and high
education represents degrees equal and above graduation. About 33.03% of the individuals in
the selected sample had low education level and only 19.81% had high levels of education
(see Table 6). The lower the percentage of house owned by an individual, the higher the debt
on housing. This variable is interesting to be integrated since having debt on housing means
that the house is an illiquid assets and implies more difficulties in reacting to negative shocks
on income. In other words, an elderly individual would not retire earlier if the percentage of
house owned is too small, because he/she has the necessity of earning more. In the selected
sample, 81.87% of individuals owned the whole of their houses and 13.64% owned their
houses by 50%. The social network size of an individual would also have impact on his/her
retirement decision, as well as the variable of living in a couple. The last column of Table 6
shows that all countries have more than 70% of individuals who are living in a couple.
3.2 Methodology
The most adequate econometric model to accomplish the goal of this work project is the
ordered probit model,4 the same model that was applied by Kalwij and Vermeulen (2005). Using this model, it is possible to measure which are the statistically and econometrically
significant components that affect an aging individual retirement decision for men and women
separately, then obtain the respective effect that each significant regressors have in the
retirement probability. The regressors are classified in three groups: 1) age dummies or
continuous age variable, 2) health related indicators and 3) social demographic indicators. It
was found many collinearity problems in the regressions, hence, some age dummies had to be
eliminated (because these were the main cause). Moreover, for some countries the continuous
age variable is included in the regression instead of age dummies due to statistical problems.
Obesity and the variable of having restrictions in daily living were also excluded in some
estimations, due to incomplete data and collinearity problems as well.
4
8
The variable income change is computed with the purpose of running estimations of the
income effect (section 4.5). This regressor can be divided in two groups: retirees and actives. For retirees, income change is determined by the difference between an individual’s retirement pension and the salary if he/she remains in labour force market. For the second
group, income change is computed by the difference between an individual’s retirement pension if he/she retires, and his/her current salary.5 Hence, the counterfactual salary for retirees and the counterfactual pension for active population have to be computed. First of all, the average salary (or pension) is calculated based on each active individual’s (or retiree’s) own age, gender and education. Then, it is generated retiree’s salary and active population’s pension based on the common factor k, i.e. each retiree’s expected salary is equal to the average salary of active individuals, who have the same age, gender and education level as the
target retiree. And each active individual’s expected pension equals to the average pension of
retirees, who have the same age, gender and education level as the target active individual.
IV- Results
4.1 Estimation Results for Men
Age. For countries which were applied age dummies as regressors (see Table 7a), the
estimated results show that, the smallest age dummy between all countries analyzed is age51
in Czech Republic. In Austria, the age dummies only start to be significant in the group age55.
Except Czech Republic, the results indicate that all significant age dummies present positive
marginal effect which means that, larger age implies higher retirement probability. For
instance, the probability that a 55 years old Austrian man retires is 31.71 percentage point
higher than an Austrian man who is only 50, ceteris paribus. Table 7a gives an expected point,
which is the marginal effect of age dummies of each country is increasing in almost countries.
It varies from 19.10% (age54, Belgium) to 83.69% (age63, France), the range is considerably
large.
The regressions for countries like Denmark, Estonia, Germany, Italy, Netherlands Poland,
Spain, Sweden and Switzerland are made in a different way by using the continuous age
variable (see Table 7b). The results show that, the variable age is statistically significant in
each one of these countries, and it implies higher men’s retirement probability.
5
9
Health Indicators. The probit results report that the severe condition is significant in only
three (Czech Republic, Hungary and Spain) out of the sixteen countries. The marginal effects
of severe condition in these societies are all positive, this means that if a Czech, Hungarian or
Spanish man has a disease like stroke and/or cancer, the probability that he retires is larger
than the retirement probability of a man in the same country who does not have stroke nor
cancer, ceteris paribus. In Czech Republic and Spain, the variable mild condition is also
strongly significant. The marginal effect is 10.8% and 5.4% respectively, which means that if
a Czech Republic or Spanish man has an illness classified as a mild disease, the probability
that he retires is 10.8 or 5.4 percentage point larger than one who does not have a mild
condition, when all else equal. The marginal effect of severe condition in Czech Republic is
14.5%, i.e. the impact of severe condition in retirement probability is larger than mild
condition. Besides Czech Republic and Spain, Germany and Italy also report statistically
significant and positive marginal effect. Moreover, severe and mild condition are not
important to the retirement decision in other countries, including Portugal.
As already referred, due to the lack of information, the variable obesity is used in the
regressions of only 9 countries. In these countries, only two show that obesity is significant: Belgium and France. In Belgium, the obesity’s marginal effect is negative, which means that obesity implies a lower retirement probability. While in France, the marginal effect is positive,
which means that obesity increases the retirement probability in France. This difference may
be caused by the subsample composition of each country (notice that the percentage of
Belgian obese retirees is 10 percentage point lower than French) and the correlation between
regressors.
Restrictions in activities of daily living are statistically significant in Austria, Portugal and
Slovenia. All the impacts derived from this variable in retirement probability are positive.
Austria and Slovenia show marginal effects slightly lower, while Portugal reports 53.5
percentage point, which is strongly significant. Grip strength is significant in Czech, Hungary,
Estonia, Netherlands and Spain. In Hungary, if a man has higher grip strength (about one
standard deviation) than other, his probability of choosing retirement is 0.5 percentage point
lower, ceteris paribus. Since the impacts on other four countries are also negative, the
interpretation is similar.
Although for countries like Denmark, Poland, Switzerland and Sweden, the ordered probit
10
countries are enough to tell us that health is multidimensional, since different health indicators demonstrate different impact, and health is important in one’s retirement decision because there are significant health indicators in the estimations.
Socio-Demographic Variables. The last set of regressors reflects each individual’s socio demographic characteristics. As already referred, the education level is classified in two
categories: high and low level of education. Both levels play important roles in Austria,
France and Slovenia. The results show that in each of these societies, the high education has a
negative impact in the retirement probability, i.e., if a man had many years of education, his
probability of being retired is lower than a man who did not get many years of education,
when other conditions are the same. On the other hand, the low education shows positive
marginal effect, which implies higher probability in retirement decision. Apart from the three
referred countries, high education is significant in Estonia and Netherlands.
The estimated results indicate that the variable living in a couple is only significant in Austria.
Here, if a man lives in a couple, his probability of choosing retirement will increase 14.6
percentage points. The percentage of house owned also plays an important role in Estonia and
Austria. It is a proxy of wealth, and it would decrease the men retirement probability of these
two countries. The last indicator that refers to socio-demographic characteristics is the size of
social network. The results indicate that this variable is statistically and economically
significant in France, Hungary, Spain and Poland. The first three countries show that the large
number of people within network implies a higher probability of retirement, while Poland
results indicate that when the number of people within network is greater, the probability of a
man being retired is lower. To sum up, the socio-demographic indicators are only significant
in about half of the analyzed countries.
4.2 Estimation Results for Women
Age Dummies. The results for age dummy variables were very similar to the regressions
obtained for men. Beside some age dummies for Czech Republic, all the others present
positive marginal effect (see Table 8a), which means age increases the women retirement
probability. As in the estimations for men, all countries which used the continuous age
variable (see Table 8b) in estimation show that the age is significant and implies higher
11
Health Indicators. It is estimated that the dummy variable of severe condition is significant
in Hungary, Poland, Slovenia and Germany. Only Poland shows that if a woman experienced
severe diseases, the probability that she would be retired is lower than women who did not
experience. The other three countries’ results demonstrate that severe condition implies a higher probability of being retired. The mild condition is statistically and economically
significant in Czech Republic, Estonia, Slovenia and Germany. Except Germany, the mild
condition has a positive impact in women retirement probability, i.e., if a Czech (Estonia or
Slovenian) woman experienced mild diseases, the probability that she would retire is higher
than a Czech (Estonia or Slovenian) women who did not experience. In Slovenia, there is
considerable difference between the impact of severe condition and mild condition in
retirement probability. While the former increases 35.3 percentage point of women retirement
probability, the latter only increases it by 17.5 percentage point, about half impact of severe
condition. It is estimated that obesity is significant in Belgium, Hungary and Slovenia women
regression. The greatest impact is in Slovenia, which is about 18.5 point percentage. For
women regressions, having restrictions in daily living is only important in Spain. It would
increase the retirement probability by 13.99 percentage point. Grip strength, on its turn, plays
important role in the Czech Republic, Estonia, Hungary, Slovenia, Germany and Switzerland.
For Hungary and Slovenia, larger grip strength implies larger probability of being retired for
women, while for others it is expected to decrease the probability. In the case of the Czech
Republic, when comparing the results for men, the grip strength presents larger impact on women’s retirement probability. For countries like Austria, France, Portugal, Denmark, Italy, Netherlands and Sweden, none of the health indicators is statistically significant. In other
words, women retirement decision in these countries is largely independent of health
conditions.
Socio-Demographic Variables. The estimated results show that the level of education is
quite important. The variable high education is statistically and economically significant in
half of the analyzed countries. Among them, only Netherlands presents a positive marginal
effect in women retirement probability. In the Czech Republic, Hungary and Portugal, both
education indicators are significant and affect the retirement probability by the similar
amplitude. For both Hungary and Portugal, education indicators decrease the retirement
probability (high education’s impact is bigger). The variables living in a couple and
percentage of house owned are significant in few countries. The former plays an important
12
probability positively. The last socio-demographic variable, size of one’s social network, is only significant in Estonia and Sweden. The probit results show that if an Estonian or
Swedish woman A has larger size in her social network than an Estonian or Swedish woman
B, A is expected to have lower probability of retirement.
4.3 Estimation Results for 50-70
There is about 16% of individuals aged between 65-70 (both included) that remains in the
labour force market. So, it seems interesting to analyze how health measures and other factors
affect this sample of even older individuals. However, there is a portion of people who are
still active in the selected sample, it is too small to run regressions only for individuals aged
between 65-70. Therefore, to use the same health related and socio-demographic variables as
potential determinants of retirement decision, age dummies or continuous age variables will
be increased to 70 years old. This new group of aging people increased substantially the
sample size. For Italy men and women regressions, the increase of observations are 2.5 and 3
times more respectively, and more than 100% for Netherlands and Switzerland. The average
is 54.21% for men and 49.96% for women.
Let us see whether this increased sample with older individuals lead to very different results.
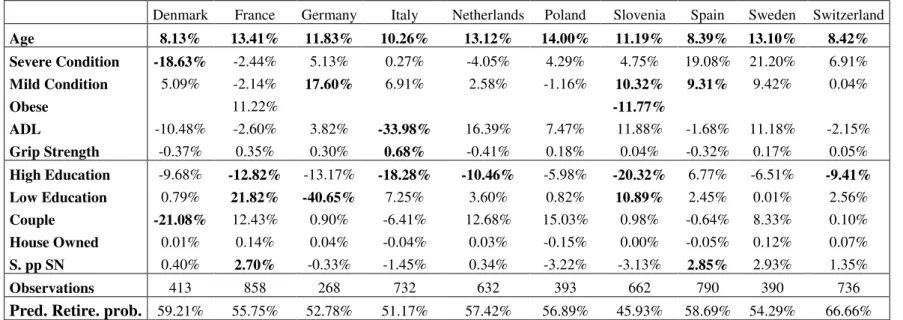
For men, the significance of age dummies starts earlier in countries like Austria, Belgium,
Hungary and Portugal. In contrast to the results for age groups 50-64 , severe condition is still
significant in the Czech Republic and Hungary. Moreover, it lost significance in Spain and
gained importance for Denmark. Severe condition now implies 2.04 percentage point higher
impact in the Czech Republic retirement probability in comparison to the previous estimation,
but in contrast, this factor’s effect in Hungary men retirement probability decreased. Mild condition is still significant in the Czech Republic, Germany and Spain, and increased the
probability of retirement. More details are illustrated in Tables 9a and 9b.
Except countries which have significant high education estimations in the age group 50-64,
now, this socio-demographic indicator is also significant in the Czech Republic, Italy and
Switzerland. In line with previous conclusions, high education implies lower retirement
probability. Low education’s effect is a little bit different. It increases French, Slovenian and
Czech men retirement probabilities, but on the other hand, it implies a decrease of 40.65
13
role in Denmark estimation, it decreases Danish men retirement probability by 21.08
percentage point. The percentage of house owned are still significant in Austria and Estonia.
The effects are very close to the previous results. Finally, the size of social network is no
longer significant in Poland, but it becomes important for France.
For women, the growth of the number of observations also lead to different results. Let us
start the analysis with the age variables. In Belgium, the age dummies become significant
earlier, but the most significant are those above 64 (see Table 10a). Both severe and mild
condition are significant and have positive impact in Czech and Slovenian women retirement
probability (see Table 10b). In line with those obtained in 50-64, the effect of severe condition
is larger than mild condition’s. From the countries the obesity is a significant regressor, only
Slovenia demonstrates a negative marginal effect, as it shows in 50-64 regressions. Having
restrictions in daily living only plays an important role in the regression for Spain. It is
strongly significant and it increases the probability of being retired by 12.46 percentage point.
Grip strength has a positive impact in Hungary, France, Italy and Slovenia women retirement
probability, and has negative impacts in the Czech Republic, Estonia and Sweden, for all of
these countries grip strength is a significant indicator. Both high and low education indicators
are statistically and economically significant in the Czech Republic, Estonia, Hungary and
Portugal. For the first two countries, high education implies lower retirement probability and
low education implies higher probability. While in Hungary and Portugal, both education
indicators lead to lower retirement probability, which means that, the higher the education
level that an Hungarian or Portuguese woman has, the lower the probability of retirement, all
else equal. The variable living in a couple is no longer significant in Poland. In the new
regressions, except Italy, the percentage of house owned is also significant in Germany, but
with negative marginal effect. Finally, the size of social network seems to increase Czech
women retirement probability, and decrease Estonian, German and Swedish women
retirement probability. Comparing to 50-64 estimation results, now this last
socio-demographic indicator has significance in more countries.
4.4 Estimation Results for Portugal subsample
The SHARE data regarding Portugal, allows to estimate additional regressions for Portugal.
socio-14
demographic regressors are the same that were used previously,6 but age dummies must be substituted by the continuous age variable. Unlike previous estimations, gender distinction is
not observed since the number of observations that the ordered probit model can take into
account will be too small, which will likely lead to less accurate estimation.
For Lisbon individuals, severe condition and having restrictions in activities of daily living
are statistically and economically significant. If a Lisbon individual experienced severe
diseases or had restrictions in activities of daily living, his/her probability of being retired is
29.63 or 32.80 percentage point lower than a Lisbon individual who does not have these
health problems. For non Lisbon individuals, the variables mild condition, having restrictions
in activities of daily living and grip strength are significant and will increase the retirement
probability. Living in a couple is strongly significant in non Lisbon regression, it decreases an individual’s retirement probability by 22.18 percentage point.
Comparing the results of these two regressions, the average impact that health indicators have
in Lisbon sample (31.22%) is much greater than in non Lisbon sample (8.28%), which
reflects that Lisbon individuals can more easily leave the labour force market than non Lisbon
ones due to health problems.
4.5 Income effect
This section will measure whether income change (individuals’ change in income when they move from labour force market to join the group of retirees, and vise-versa) has any impact in
one’s retirement probability. With this purpose, new regressions are run, and the variable
income change is included. Applying the same econometric model, the estimation results
show that income changes are important in Estonia, Italy, Netherlands, Poland, Spain and
Switzerland, and are statistically insignificant to other ten countries, including Portugal.
For the gender group men, income change is a significant regressor for countries like Estonia,
Spain and Switzerland. If this regressor increases by €1000 per year, the Estonian (Spanish)
men’s retirement probability increases by 0.824 (0.911) percentage point, ceteris paribus.
Switzerland is the only country with negative impact. If Swiss men’s income increases by
€1000 per year, their retirement probability decreases 0.849 percentage point. For women, the
income indicator is significant and increases the women retirement probability by 0.114,
6
15
0.176, 0.0603 and 0.323 percentage point in Estonia, Italy, Netherlands and Poland
respectively, if each woman’s income increases by €1000 per year and keep all other variables constant. Moreover, in Estonia, income change has bigger impact on women than
men. It seems that Estonian women give more importance to income.
V- Conclusion
This work project is based on the data from Survey of Health, Ageing and Retirement in
Europe (SHARE), Wave 4, to study retirement behavior of elderly individuals in 16 European
countries. As SHARE is a longitudinal survey, which contains multidisciplinary and
cross-national panel database, and focuses in elderly respondents above 50 years old, it is the most
appropriate source for the present work project analysis.
The findings have proved that health is a very important determinant for both men and women’s retirement decision in later life. Poor health leads older workers from some countries to retire earlier, and good health leads them to remain in labour force market. The
findings have shown that severe and mild condition, obesity, having restrictions in activities
of daily living and grip strength are important and have different impacts in the 16 countries.
The statistical significance and the effect of each referred health indicators are also different
for men and women. These findings reveal that the multi-dimensional nature of the health
condition of elderly individuals is really important when studying its effect on labour force
participation or retirement behaviour, as Kalwij and Vermeulen (2005) mentioned.
The general results have also shown that socio demographic indicators are important in
elderly individuals’ retirement behaviour. Among those measures, the education level is the
most important one in most of countries. For the majority, high education leads older men and
women to remain in labour force market, while low education leads to higher retirement
probability. This is likely due to the association between different natures of job and different
levels of education, for instance, the job of the majority of individuals who have low level of
education may be more strenuous than the job of individuals who have high level of education.
Moreover, in most countries, it is confirmed that older people have higher probability to retire.
When the sample was increased to 70 years old, the findings suggest that the average impact
that health indicators have in each country is bigger. Portugal subsample analysis gives the
16
individuals when they experience some disease. It is also confirmed that income changes have
positive impact in retirement behaviour in the majority of the countries, in which the income
change is statistically significant.
Returning to the main topic of the discussion, the empirical results show that many people
retire due to health problems and/or physical incapability. Therefore, the health condition is
an important issue in retirement decision, because poor health individuals are eager to choose
early retirement. Hence, the increase in legal retirement age may not be a relevant solution for
the Government debt problems in some circumstances, because people who have jobs that
require a lot of physical ability, may present legitimate reasons to retire (such as poor health)
when they need, whichever the legal retirement age is. In other words, the government would
pay pensions to those people even they had not reached the legal retirement age.
In conclusion, it is strongly suggested that when adjusting the retirement age, such adjustment
should not only based on private or public sector and/or different genders, but should also
take into account the nature of each of job. For instance, the legal retirement age for sectors
which are wearing or require a lot physical ability should not increase. Thus, the solution for
Government debt problems will be better in the future, because the pension plans are
17 References
Bosworth, B. and K. Burke (2012), “Changing Source of Income Among the Aged Population”, CRR WP: 27.
Bound, John (1991), “Self-Reported Versus Objective Measures of Health in Retirement
Models”, The Journal of Human Resources, Vol. 26, No.1: 106-138.
Disney, R., C. Emmerson and M. Wakefoeld (2004), “Ill health and retirement in Britain: A
panel data based analysis”, Journal of Health Economics.
European Commission (2011), “Female Labour Market Participation”, Europe 2020.
Kalwij, A. and F. Vermeulen (2005), “Labour Force Participation of the Elderly in Europe: The Importance of being Healthy”, IZA DP No. 1887.
Kerkhofs, M., M. Lindeboom and J. Theeuwes (1999), “Retirement, financial incentives and
health”, Labour Economics, 6: 203-227
Myers, R., 1982, “Why Do People Retire from Work Early?”, Social Security Bulletin,
September: 10-14.
OECD (2011), “Average Effective Age of Retirement versus The Official Age in 2011 in
OECD countries”.
OECD (2013), “Life expectancy”, in OECD Factbook 2013: Economic, Environmental and
Social Statistics, OECD Publishing: 232-233.
Sauré, Philip and Hosny Zoabi, 2011, “Retirement Age across Countries: The Role of Occupations”, unpublished manuscript.
Stecker, Margaret L. (1995), “Why Do Beneficiaries Retire? Who Among Them Return to
Work?”, Social Security Bulletin, 18: 3-12, 35-36.
Train, Kenneth E. 2003. Discrete Choice Methods with Simulation, 163-167. Cambridge:
18 Appendices
Table 1: Life expectancy
1970 1990 2000 2010
Austria 70.0 75.6 78.2 80.7
Belgium 71.0 76.1 77.8 80.3
Czech 69.6 71.5 75.1 77.7
Denmark 73.3 74.9 76.8 79.3
Estonia 69.7 69.6 70.6 75.6
France 72.2 76.8 79.0 81.3
Germany 70.5 75.3 78.2 80.5
Hungary 69.2 69.4 71.7 74.3
Italy 72.0 77.1 79.8 -
Netherlands 73.7 77.0 78.0 80.8
Poland 70.0 70.7 73.8 76.3
Portugal 66.7 74.1 76.7 79.8
Slovenia - 73.3 75.5 79.5
Spain 72.0 77.0 79.4 82.2
Sweden 74.7 77.6 79.7 81.5
Switzerland 73.1 77.5 79.9 82.6
Average 66.7 74.6 76.9 79.5
Source: OECD 54,0
56,0 58,0 60,0 62,0 64,0 66,0 A u str ia B elg iu m c C ze ch … Den m ar k E sto n ia F ran ce Ger m an y Hu n g ar y Italy c Neth er lan d s P o lan d P o rtu g al Slo v en ia Sp ain Sw ed en S w it zer lan d A v er ag e
Source: Average Effective Age of Retirement versus The Official Age in 2011 in OECD countries.
Graph 2: Women effective and official retirement average age
Effective Official 54,0 56,0 58,0 60,0 62,0 64,0 66,0 68,0 A u str ia B elg iu m c C ze ch … Den m ar k E sto n ia Fra n ce Ger m an y Hu n g ar y Italy c Neth er lan d s P o lan d P o rtu g al S lo v en ia Sp ain Sw ed en Sw itzer lan d
Source: Average Effective Age of Retirement versus The Official Age in 2011 in OECD countries.
Graph 1: Men effective and official retirement average age
19
Table 2: Sample statistics and age groups Table 3: Men retirees percentage Table 4: Women retirees percentage
Observations Age50-54 Age55-59 Age60-64 Age50-54 Age55-59 Age60-64 Age50-54 Age55-59 Age60-64
Austria 2,514 29.04% 32.26% 38.70% Austria 9.58% 27.78% 73.33% Austria 8.89% 32.26% 77.96%
Belgium 2,798 31.70% 35.74% 32.56% Belgium 3.46% 15.53% 56.07% Belgium 1.48% 9.53% 40.53%
Czech 2,968 25.20% 34.23% 40.57% Czech 5.47% 15.33% 62.57% Czech 6.88% 32.04% 62.57%
Denmark 1,180 34.83% 35.00% 30.17% Denmark 0.55% 0.50% 25.93% Denmark 0 0.47% 37.31%
Estonia 3,035 28.43% 34.50% 37.07% Estonia 1.37% 4.21% 35.23% Estonia 2.49% 2.85% 47.39%
France 2,845 28.44% 35.36% 36.20% France 1.44% 13.70% 77.62% France 1.95% 8.92% 65.40%
Germany 601 3.66% 42.60% 53.74% Germany 0 6.19% 35.21% Germany 0 2.55% 36.46%
Hungary 1,622 21.45% 38.90% 39.64% Hungary 11.43% 15.90% 72.71% Hungary 3.86% 24.14% 81.58%
Italy 1,540 22.53% 33.90% 43.57% Italy 1.56% 12.50% 61.51% Italy 0 4.48% 46.31%
Netherlands 1,334 20.69% 34.18% 45.13% Netherlands 0 2.63% 35.85% Netherlands 0 0.38% 19.29%
Poland 780 4.36% 41.92% 53.72% Poland 0 7.81% 39.06% Poland 3.13% 29.65% 80.18%
Portugal 1,027 27.85% 36.81% 35.35% Portugal 8.91% 20.47% 73.94% Portugal 3.85% 17.87% 47.47%
Slovenia 1,410 27.16% 39.93% 32.91% Slovenia 0.09% 28.24% 78.37% Slovenia 4.91% 55.15% 88.67%
Spain 1,449 27.05% 37.47% 35.47% Spain 5.06% 8.71% 32.65% Spain 1.71% 4.98% 11.15%
Sweden 603 3.32% 35.16% 61.53% Sweden 0 5.43% 17.31% Sweden 0 5.00% 22.90%
Switzerland 1,831 30.75% 36.48% 32.77% Switzerland 0 196.72% 21.94% Switzerland 0 1.38% 19.88%
20
Table 5: Health indicators (50-64 years old aging population )
Table 6: Socio-demographic indicators (50-64 years old aging population )
Severe condition
Mild
condition Obese ADLs
Mean of max. Grip
strength High Education Low Education Couple
Austria 6.44% 55.14% 20.78% 5.56% 37.68 Austria 11.65% 59.07% 71.96%
Belgium 7.21% 63.61% 20.20% 9.68% 38.38 Belgium 32.88% 18.12% 75.34%
Czech 6.27% 60.37% 26.89% 5.31% 37.71 Czech 16.27% 15.70% 78.71%
Denmark 4.43% 54.89% 18.05% 4.51% 40.80 Denmark 29.75% 34.83% 83.64%
Estonia 8.29% 67.98% 29.40% 10.38% 37.51 Estonia 25.11% 12.52% 76.67%
France 5.51% 56.62% 18.63% 6.86% 36.52 France 22.88% 19.16% 76.91%
Germany 7.83% 62.67% 8.33% 7.83% 37.08 Germany 32.28% 6.82% 82.03%
Hungary 9.77% 71.43% 31.84% 8.66% 35.70 Hungary 10.85% 25.96% 79.47%
Italy 4.36% 53.35% 16.83% 3.38% 35.72 Italy 12.21% 54.22% 87.14%
Netherlands 5.87% 47.03% 15.03% 4.82% 38.39 Netherlands 29.01% 18.44% 84.86%
Poland 4.25% 61.39% 14.29% 10.41% 36.37 Poland 8.46% 25.00% 80.90%
Portugal 7.75% 68.50% 23.78% 10.43% 32.65 Portugal 6.72% 75.95% 84.23%
Slovenia 6.62% 57.08% 23.99% 6.76% 38.21 Slovenia 13.33% 29.65% 81.28%
Spain 4.22% 58.12% 19.43% 5.39% 33.48 Spain 15.46% 57.28% 84.68%
Sweden 3.49% 43.36% 9.68% 5.81% 37.99 Sweden 35.32% 19.40% 79.60%
Switzerland 4.93% 45.43% 12.65% 3.45% 37.84 Switzerland 14.75% 56.42% 80.67%
Average 6.08% 57.94% 19.36% 6.83% 37.00 Average 19.81% 33.03% 80.51%
Note: Bold entries in the next tables are significant at the 10 percent significant level, and the bottom lines show the predicted retirement probabilities.
21
Table 7a: Marginal effects men (50-64) Part 1
Austria Belgium Czech France Hungary Portugal Slovenia
Age51 -31.22%
Age52 8.48% -27.56% -6.24% 28.40%
Age53 2.55% 0.32% -27.57% -2.99% 6.62% 37.25% 17.19%
Age54 -4.40% 19.10% -28.42% 5.70% 31.09% 12.47% 49.31%
Age55 31.71% 14.81% -30.49% 21.21% 2.23% 22.23% 35.19%
Age56 11.99% 23.76% -28.46% 39.44% 12.41% 20.01% 43.93%
Age57 32.74% 40.57% -26.36% 42.28% -5.97% 55.90% 42.84%
Age58 51.25% 57.79% -29.24% 48.34% 19.48% 33.13% 60.84%
Age59 42.48% 33.79% -26.09% 48.15% 36.28% 56.34% 62.98%
Age60 61.47% 60.85% -27.31% 73.45% 48.61% 60.27% 69.84%
Age61 65.59% 74.66% -27.20% 82.00% 56.55% 57.69% 71.59%
Age62 67.84% 82.17% -23.22% 82.60% 66.81% 67.85% 73.33%
Age63 70.89% 80.75% -2.48% 83.69% 70.60% 69.20% 73.10%
Age64 73.95% 82.86% 83.52% 69.44% 70.45% 73.92%
Severe Condition 9.20% 4.66% 14.54% -2.29% 16.41% -0.06% 2.47%
Mild Condition 6.01% -1.23% 10.81% -1.03% 6.29% 1.03% 9.09%
Obese -1.27% -7.97% 5.83% 12.18% -1.83% 1.53% -9.52%
ADL 29.92% -6.14% 2.69% -5.09% -6.28% 53.53% 20.16%
Grip Strength -0.01% 0.16% -0.53% 0.23% -0.52% 0.01% 0.10%
High Education -17.91% -3.09% -4.82% -10.85% 4.08% -14.14% -20.13%
Low Education 15.23% 6.50% 10.52% 18.58% -4.14% 1.18% 13.27%
Couple 14.63% 4.32% -0.72% 7.42% 0.55% -4.85% 3.27%
House Owned -0.19% -0.02% -0.04% 0.07% 0.06% -0.09% 0.04%
Social Network Size -0.71% 0.46% -1.15% 3.08% 4.37% -0.63% -3.27%
Observations 515 625 780 670 626 269 497
Pred. Retirement prob. 62.18% 80.94% 65.54% 69.07% 58.39% 50.98% 60.79%
Table 7b: Marginal effects men (50-64) Part 2
Denmark Estonia Germany Italy Netherlands Poland Spain Sweden Switzerland
Age 2.69% 2.91% 7.54% 10.48% 10.29% 9.67% 3.03% 3.10% 5.66%
Severe Condition 0.43% -0.35% 18.02% 6.99% -6.87% 7.25% 25.18% 16.28% 3.91%
Mild Condition -0.02% 2.37% 15.01% 12.25% 0.49% -2.06% 5.36% -3.63% -1.34%
Obese 0.71% 1.85%
ADL -4.17% 1.81% 8.81% 9.07% 1.05% -0.32% 17.80% -5.65%
Grip Strength -0.24% -0.21% 0.11% -0.02% -0.56% -0.03% -0.41% 0.27% 0.15%
High Education -2.40% -4.54% -10.90% -16.76% -12.51% -5.75% 0.98% -1.99% -5.39%
Low Education 3.91% -1.56% -13.22% 7.13% 1.08% 9.02% -0.73% -0.89% 0.69%
Couple -9.46% -1.44% 7.25% -15.57% 11.42% 5.75% -2.74% -0.001% -3.08%
House Owned 0.10% -0.09% 0.00% -0.22% 0.13% -0.10% 0.00% 0.12% 0.04%
Social Network Size 0.15% -0.91% -3.54% -1.26% 0.39% -4.29% 2.32% 0.02% 1.37%
Observations 216 995 153 203 308 259 544 208 299
22 Table 8b: Marginal effects women (50-64) Part 2
Denmark Estonia Germany Italy Netherlands Poland Spain Sweden Switzerland
Age 2.96% 3.71% 6.76% 5.10% 5.45% 13.37% 1.15% 4.50% 4.45%
Severe Condition -2.12% 2.67% 44.39% -3.22% -5.03% -41.24% 3.10% -5.12% -3.03%
Mild Condition -0.53% 2.98% -11.35% 3.67% -3.73% 6.98% -0.67% 3.79% 0.75%
Obese 2.05% -1.15%
ADL 12.33% 2.23% -1.24% 1.75% -7.67% 13.99% 8.87% -3.12%
Grip Strength -0.03% -0.36% -0.76% 0.46% -0.05% 0.44% 0.08% -0.19% -0.59%
High Education -1.73% -3.52% -7.25% -1.89% 6.41% -16.19% -0.81% 1.17% -4.92%
Low Education -0.25% 2.55% 2.07% -13.24% 3.08% -5.72% -3.14% -3.01% -1.33%
Couple 1.99% 4.19% -2.51% 1.81% -1.08% 12.31% -4.42% 0.14% -4.04%
House Owned -0.03% -0.04% -0.03% 0.16% -0.03% 0.08% -0.002% 0.04% 0.04%
Social Netw. Size 0.43% -0.75% -2.83% 0.22% 1.32% -0.65% -0.39% -3.20% 0.53%
Observations 379 1,431 227 221 355 366 694 241 319
P. Retire. prob. 85.76% 83.31% 80.87% 74.89% 86.09% 41.36% 92.19% 86.13% 90.77%
Table 8a: Marginal effects women (50-64) Part 1
Austria Belgium Czech France Hungary Portugal Slovenia
Age51 0.10% -49.41% 3.76%
Age52 19.00% -50.11% 16.58% 15.12% 19.87%
Age53 -15.35% 7.09% -46.80% 24.07% 0.51% 22.93%
Age54 -6.08% -47.50% 21.87% 6.46% 31.75%
Age55 34.82% 2.90% -46.77% 28.45% 45.07% 2.34% 48.15%
Age56 33.31% 20.52% -46.60% 43.19% 51.78% 13.51% 51.56%
Age57 49.30% 15.56% -35.57% 23.89% 56.43% 13.34% 53.55%
Age58 50.83% 35.27% -31.22% 52.76% 56.95% 28.04% 54.84%
Age59 57.37% 47.00% -14.17% 50.52% 65.56% 39.43% 56.09%
Age60 67.01% 43.99% -0.69% 74.33% 73.50% 32.49% 55.22%
Age61 69.96% 65.90% 32.97% 85.86% 74.67% 53.35% 56.32%
Age62 70.27% 69.98% 32.23% 86.79% 72.06% 57.96% 56.98%
Age63 72.49% 76.11% 48.61% 86.10% 73.10% 66.19% 54.83%
Age64 75.11% 80.00% 86.93% 71.59% 52.02% 59.05%
Severe Condition 10.78% 0.77% 11.72% 3.15% 15.01% 12.83% 35.29%
Mild Condition 4.58% 2.34% 11.40% 0.20% -1.58% 3.96% 17.48%
Obese 6.88% 3.78% 7.31% -3.90% 8.19% 4.95% -18.50%
ADL 19.14% -0.82% -10.92% 3.03% 6.23% -3.35% -13.11%
Grip Strength 0.00% 0.04% -1.02% 0.40% 0.55% 0.11% 0.97%
High Education
-16.00% -2.97% -22.81% 2.34% -17.99% -15.10% -40.16%
Low Education 7.91% -2.02% 22.65% -5.65% -13.19% -12.34% -0.57%
Couple -7.90% -0.28% -1.55% 4.48% 2.40% -3.48% 3.92%
House Owned -0.04% 0.04% -0.05% -0.08% -0.15% 0.09% 0.09%
Social Network Size 0.02% 0.70% 2.58% 0.91% 1.26% 0.97% -2.48%
Observations 683 718 1,006 764 780 360 621
23
Table 9a: Marginal effects men (50-70) Part 1
Austria Belgium Czech Estonia Hungary Portugal
Age51 -66.30% -38.62% -60.09%
Age52 -63.71% -37.97% -56.93% -55.41% -41.58%
Age53 -61.77% -35.09% -56.78% -51.92% -39.69%
Age54 -63.53% -34.58% -57.68% -40.62% -54.73%
Age55 -58.97% -34.21% -59.56% -54.53% -50.64%
Age56 -61.09% -34.05% -57.67% 26.85% -51.09% -49.84%
Age57 -59.15% -31.90% -55.73% 18.88% -56.73% -16.28%
Age58 -54.33% -30.00% -58.46% 27.19% -48.14% -43.69%
Age59 -57.72% -31.36% 55.39% 19.17% -37.98% -17.00%
Age60 -44.55% -28.84% -56.65% 42.32% -26.14% -3.86%
Age61 -37.60% -26.58% -56.34% 55.63% -16.44% -12.70%
Age62 -26.64% -22.59% -51.16% 61.87% 9.79% 18.05%
Age63 -18.96% -23.74% -21.69% 71.12% 27.76% 15.94%
Age64 2.90% -21.10% 80.70% 26.73% 25.66%
Age65 1.78% -18.79% -22.73% 77.31% 26.10% 17.83%
Age66 14.35% 80.56% 34.45%
Age67 8.08% -28.37% 82.52% 31.27% 29.57%
Age68 21.90% -13.39% 82.58% 15.82%
Age69 -2.41% 81.50% 30.51% 35.31%
Age70 1.95% 4.24% -15.19% 83.14% 27.51%
Severe Condition 12.31% 2.65% 16.58% -1.52% 14.21% -0.69%
Mild Condition 5.43% -0.17% 11.76% 1.43% 7.10% 5.01%
Obese 2.16% -9.13% 5.58% 3.48% -2.34% -1.01%
ADL 18.06% -8.54% 1.60% 8.36% -11.67% 24.73%
Grip Strength -0.28% 0.09% -0.65% -0.41% -0.84% -0.76%
High Education -23.98% -5.62% -12.53% -11.52% 3.54% -7.24%
Low Education 16.51% 8.24% 8.68% 2.13% -4.87% -2.79%
Couple 7.70% 8.80% -2.42% -5.24% 0.60% -1.38%
House Owned -0.18% -0.04% -0.02% -0.20% -0.03% 0.04%
Social Network Size -0.02% 1.16% -1.35% -1.45% 3.64% -1.27%
Observations 702 759 1,100 1,390 833 394
24
Table 10a: Marginal effects women (50-70) Part 1
Austria Belgium Czech Estonia Hungary Portugal
Age51 -1.17%
Age52 18.35% -72.67% 25.11% 14.05%
Age53 -16.42% -11.69% -69.80% 32.66% 22.30% -0.50%
Age54 -8.67% -11.63% -68.45% 28.09% 7.53%
Age55 32.72% -13.20% -67.43% 15.09% 37.59% 3.06%
Age56 31.65% -3.78% -66.23% 3.37% 41.25% 16.74%
Age57 42.90% -6.74% -48.57% 2.55% 43.98% 15.40%
Age58 45.76% 4.51% -41.94% 12.42% 44.13% 31.93%
Age59 49.44% 14.48% -20.45% 42.96% 48.21% 42.89%
Age60 56.71% 11.91% -5.95% 56.60% 52.72% 36.76%
Age61 58.64% 30.33% 20.53% 70.34% 53.98% 55.66%
Age62 58.38% 35.52% 19.76% 78.63% 51.33% 58.29%
Age63 59.77% 44.77% 29.30% 79.31% 52.17% 64.13%
Age64 61.66% 48.62% 32.04% 79.59% 50.77% 54.41%
Age65 57.66% 66.33% 30.49% 80.15% 49.42% 68.77%
Age66 59.39% 52.84% 80.96% 52.41% 72.69%
Age67 58.41% 31.92% 81.79% 49.34% 73.30%
Age68 57.71% 62.80% 26.96% 81.13% 52.35% 66.01%
Age69 58.47% 54.18% 82.14% 50.88% 70.31%
Age70 58.45% 21.04% 25.98% 83.76% 50.08% 72.66%
Severe Condition -3.11% 0.34% 12.48% 2.64% 14.24% 18.55%
Mild Condition 6.61% 8.00% 11.39% 5.47% -1.92% 5.85%
Obese 14.31% 6.69% 6.25% 7.73% 7.07% 9.19%
ADL 11.28% -5.78% -9.72% 5.84% 0.19% -8.45%
Grip Strength -0.26% -0.19% -1.02% -0.64% 0.57% -0.01%
High Education -17.94% -5.12% -21.90% -9.94% -16.70% -18.67%
Low Education 1.15% -2.92% 19.39% 7.71% -13.94% -17.07%
Couple -8.87% -1.97% -1.73% 8.78% 1.38% -8.55%
House Owned -0.06% 0.12% -0.04% -0.09% -0.12% 0.02%
Social Network Size 0.36% 0.45% 2.53% -1.41% 2.27% 1.38%
Observations 890 839 1,368 1,974 1,019 478
25 Table 9b: Marginal effects men (50-70) Part 2
Denmark France Germany Italy Netherlands Poland Slovenia Spain Sweden Switzerland
Age 8.13% 13.41% 11.83% 10.26% 13.12% 14.00% 11.19% 8.39% 13.10% 8.42%
Severe Condition -18.63% -2.44% 5.13% 0.27% -4.05% 4.29% 4.75% 19.08% 21.20% 6.91%
Mild Condition 5.09% -2.14% 17.60% 6.91% 2.58% -1.16% 10.32% 9.31% 9.42% 0.04%
Obese 11.22% -11.77%
ADL -10.48% -2.60% 3.82% -33.98% 16.39% 7.47% 11.88% -1.68% 11.18% -2.15%
Grip Strength -0.37% 0.35% 0.30% 0.68% -0.41% 0.18% 0.04% -0.32% 0.17% 0.05%
High Education -9.68% -12.82% -13.17% -18.28% -10.46% -5.98% -20.32% 6.77% -6.51% -9.41%
Low Education 0.79% 21.82% -40.65% 7.25% 3.60% 0.82% 10.89% 2.45% 0.01% 2.56%
Couple -21.08% 12.43% 0.90% -6.41% 12.68% 15.03% 0.98% -0.64% 8.33% 0.10%
House Owned 0.01% 0.14% 0.04% -0.04% 0.03% -0.15% 0.00% -0.05% 0.12% 0.07%
S. pp SN 0.40% 2.70% -0.33% -1.45% 0.34% -3.22% -3.13% 2.85% 2.93% 1.35%
Observations 413 858 268 732 632 393 662 790 390 736
Pred. Retire. prob. 59.21% 55.75% 52.78% 51.17% 57.42% 56.89% 45.93% 58.69% 54.29% 66.66%
Table 10b: Marginal effects women (50-70) Part 2
Denmark France Germany Italy Netherlands Poland Slovenia Spain Sweden Switzerland
Age 6.86% 9.96% 8.66% 6.30% 4.36% 8.81% 7.53% 1.99% 17.36% 6.48%
Severe Condition -1.08% 10.42% 28.11% -7.17% -4.85% -15.41% 20.11% 1.63% -16.98% -0.63%
Mild Condition 0.03% -2.57% -10.06% 2.04% -0.95% 2.70% 8.85% -1.62% 9.71% -3.54%
Obese -4.43% -12.51%
ADL 9.19% 9.12% -12.32% -2.82% 4.92% -9.59% -3.39% 12.46% 17.03% 5.34%
Grip Strength -0.04% 0.80% -0.55% 0.56% -0.07% 0.34% 0.76% 0.19% -1.12% -0.17%
High Education -4.57% 2.63% -2.71% 3.90% 4.17% -14.35% -26.10% -0.92% -3.49% -10.00%
Low Education -2.07% -2.94% -11.11% -10.22% -0.19% -11.53% -3.46% -3.67% -7.31% -4.30%
Couple 2.89% 6.29% 3.53% -3.39% 1.02% 2.06% 4.60% -7.55% -1.10% -9.18%
House Owned -0.04% -0.09% -0.24% 0.27% -0.07% -0.03% 0.02% -0.02% -0.05% 0.03%
Social Network Size 1.50% 0.49% -3.62% 0.26% 0.76% 0.01% 0.85% -0.23% -5.17% -0.48%
Observations 616 956 343 950 744 592 820 956 482 717