Ako Achere Remy
SOLID WASTE MANAGEMENT: WORLD PERSPECTIVES AND THE
CAMEROON CASE STUDY
Universidade Fernando Pessoa Faculty of Science and Technology
Master in Environmental Engineering and Management
Ako Achere Remy
SOLID WASTE MANAGEMENT: WORLD PERSPECTIVES AND THE
CAMEROON CASE STUDY
Universidade Fernando Pessoa Faculty of Science and Technology
Master in Environmental Engineering and Management
Ako Achere Remy
SOLID WASTE MANAGEMENT: WORLD PERSPECTIVES AND THE
CAMEROON CASE STUDY
Master in Environmental Engineering and Management
This research is a compilation of data from all those mentioned and cited in the referenced section of this work.
(Ako Achere Remy)
Submitted at the Universidade Fernando Pessoa in fulfillment of an MSc in Environmental Engineering and Management, under the Supervision of Professor Maria Alzira Pimenta Dinis and Professor Maria João Simas Guerreiro.
ABSTRACT
Nowadays, many nations in the world transform their contemporary waste management practice into a more efficient and sustainable one. This is to render them capable of handling increased refuse generation and the numerous ambiguities of the current municipal solid waste management (MSWM) systems. This has been aggravated by economic activities, urbanization and life quality provided to the city inhabitants. This has influenced the masses to shift from rural to the urban environments. More so, low, middle and high-income countries spend roughly 40% of the annual budget on waste related environmental problems. In spite of the changes in strategy, the quantity of municipal solid waste (MSW) continues to increase, and its diverse characteristics make it a lot more problematic.
This study strives to understand the key drivers of waste handling and present the challenges, threats, and opportunities in transforming the traditional waste streams into optimized practices with acceptable waste administration. In the quest of understanding the challenges, a literature research pattern of facts compilation served as the main model for the study. This work investigates the policies and options that are employed in 29 nations all over the world. It also proposes a direct or indirect framework for a lower middle-income nation-Cameroon.
The study concludes that: firstly, strategies based on, social, economic, political tools, and new technologies, can assist cities/countries in their revolution geared towards a sustainable MSWM system. Furthermore, waste handling difficulties are not only technologically orchestrated, but they are due to political misappropriation. Lastly, the couple force existing between waste volume and income will remain directly proportionate if stakeholders are not educated to hold up with MSW streams in the world.
RESUMO
Atualmente, muitos países no mundo têm como objetivo transformar as suas atuais práticas de gestão de resíduos em práticas mais eficientes e sustentáveis. Induzida por numerosas lacunas existentes nos atuais sistemas de gestão de resíduos e agravada pelo aumento da migração das populações das zonas rurais para os ambientes urbanos, a produção de resíduos e os problemas que desta advêm têm aumentado. As atividades económicas atualmente praticadas e o aumento da qualidade de vida das populações são também fatores que contribuíram para o agravamento destes problemas. Em média, e incluindo os países subdesenvolvidos, desenvolvidos e em vias de desenvolvimento, 40% do orçamento despendido na resolução dos problemas ambientais a nível mundial é destinado à resolução destes problemas. Apesar do montante gasto na gestão dos resíduos, a quantidade de resíduos urbanos gerados continua a aumentar e a cada vez maior diversificação dos resíduos gerados dificulta a sua gestão.
Este estudo visa compreender os principais fatores intervenientes na gestão dos resíduos, apresentando os principais desafios, ameaças e oportunidades de transformação dos tradicionais fluxos de resíduos, assim como a otimização de práticas aceitáveis de gestão de resíduos. De forma a melhor entender os desafios do processo de gestão dos resíduos, foi efectuada uma compilação de dados obtida através de uma pesquisa literária, pesquisa esta que serviu de base de estudo deste trabalho. Este trabalho procura ainda investigar as orientações políticas e linhas de conduta adotadas em todo 29 paysage o mundo.
Este estudo permite-nos concluir que: em primeiro lugar, estratégias baseadas em ferramentas e políticas socioeconómicas e tecnologias mais recentes podem conduzir as cidades/países a implementar uma revolução sustentável, sem stresse, acessível, viável e mais eficaz das suas estratégias de SGRS Urbanos; em segundo lugar, verificou-se que os problemas de gestão de resíduos não são resolvidos apenas com o recurso à tecnologia, são essencialmente resolvidos através de políticas de gestão apropriadas; por último, a força mútua existente entre o volume de resíduos gerados e os encargos resultantes continuará a ser diretamente proporcional se os principais intervenientes nos sistemas de Resíduos Sólidos não forem devidamente educados e se estes não se preocuparem com os fluxos de resíduos gerados a nível global.
DEDICATION
ACKNOWLEDGEMENTS
Opening, I like to thank the people who supported and helped me immensely with this Study:
To Professor Maria Alzira Pimenta Dinis, my hypothesis advisor, sincere gratitude for Proposing this subject to me, her invaluable assistance and support throughout my involvement in the environmental engineering department, for her reviews, constructive advices, patience and encouragement. To Professor: Maria João Simas Guerreiro, my co-advisor, for her valuable insights, guidance and support. To my family for their endless morally supports throughout this study. To Environmental Engineer: Joel Braga of SULDOURO–Gaia for his timely and angelic support. Many thanks, to Mr. David and all the workers of SULDOURO, for their hospitality and kindness in sharing their valuable experience with me.
GENERAL INDEX
ABSTRACT………..iii
RESUMO………...iv
DEDICATION………..…...v
ACKNOWLEDGMENT………...….vi
FIGURES INDEX………..…...ix
TABLES INDEX………..…..x
LIST OF ABBREVIATIONS ………...…....xi
1. INTRODUCTION……….1
2. SOLID WASTE MANAGEMENT: “STATE-OF-THE–ART”………...4
2.1 WASTE GENERATION………..4
2.2 WASTE COMPOSITION……….6
2.3 WASTE COLLECTION………...7
2.4 WASTE TREATMENT AND DISPOSAL………..9
2.5 WASTE MANAGEMENT STRATEGIES………11
3. SOLID WASTE MANAGEMENT ASSOCIATED PROBLEMS……….17
3.1 REDUCTION AT SOURCE………..17
3.2 WASTE SORTING AT SOURCE...20
3.3 WASTE COLLECTION AND CONTAINER………...22
3.4 PARTNERSHIP AND LEGISLATIONS………...23
3.5 TIPPING FEES, RECYCLING AND LANDFILLS………..24
4. MSWM PROBLEMS-OPTIMISATION STRATEGIES………...27
4.1 WASTE PREVENTION……….28
4.2 SUSTAINABLE DESIGN………..32
5. CAMEROON WASTE FRAMEWORK………..35
5.1 INTRODUCTION………..35
5.2 MINENP (Legislative Tools)………..37
5.3 REGULATORY BODY (Assessment tools)………..38
5.4 MANAGERIAL AND SOCIOTECHNICAL TOOLS………...40
6. CONCLUSIONS……….46
7. REFERENCES………48
7.1 BOOKS, SHORT MAGAZINES ARTICLES, REVIEW ARTICLES, COMMUNICATIONS AND POSTERS ON WEBPAGES………48
7.2 LEGISLATION………..62
8. APPENDIXES……….63
Appendix A - The waste generation rates and total annual waste in thousands of tonnes of the 29 case studies and their respective income group ……...a
Appendix B - Relative composition of household waste in low, middle and high-
income Countries in the world……….b
Appendix C - MSW composition of the city of Yaounde in Cameroon………....b
Appendix D - Landfill tipping fee of some countries in high-income countries and
FIGURES INDEX
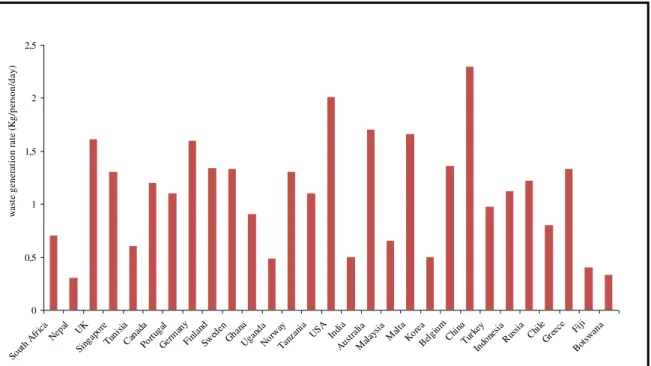
Figure 1 - Solid waste generation rates in kg/person/day………..…...5
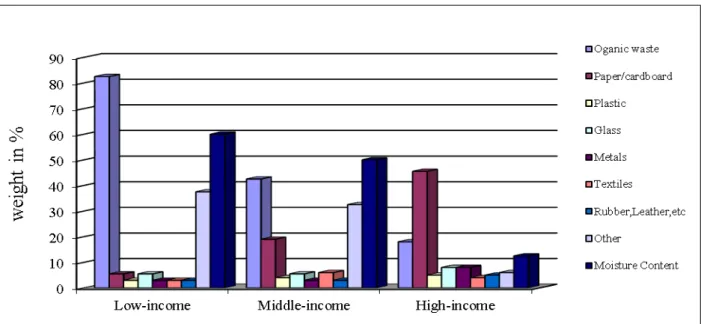
Figure 2 - Waste composition in high, middle and low-income countries………...7
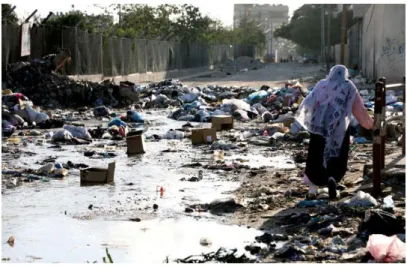
Figure 3 - Unassembled waste obstructing rainstorm and street………..9
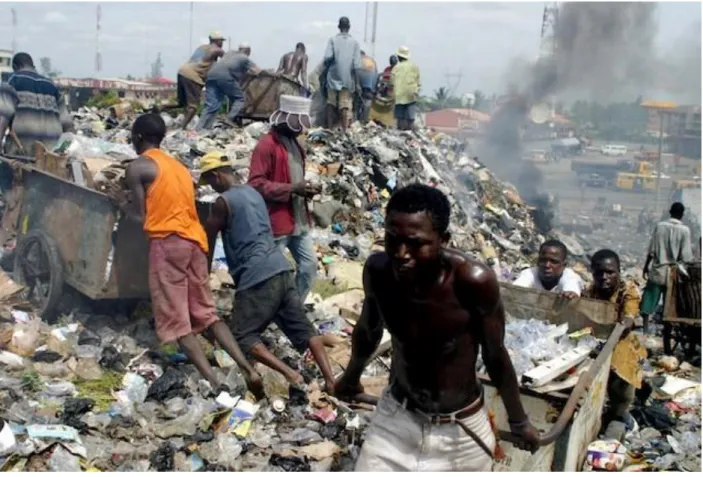
Figure 4 - A typical disposal and treatment strategy in low-income nations………..11
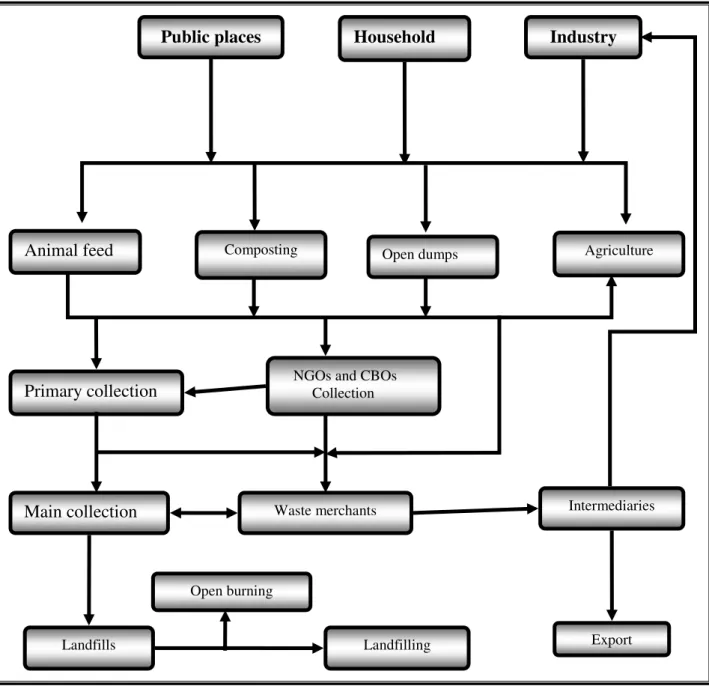
Figure 5 - Solid Waste Flow stream in low-Income Countries…...14
Figure 6 - The waste flow stream in high-income countries………16
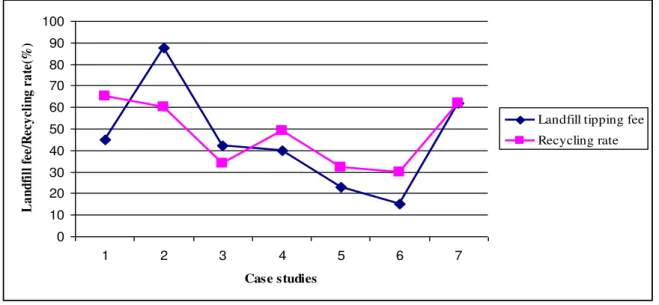
Figure 7 - The rate of change of landfill tipping fee and recycling rates in some high income nations (data source appendix D)………...26
Figure 8 - The solid waste management enhancement strategy pyramid……….……...28 Figure 9 - The proposed operational MSWM Framework and Responsibilities for municipalities in Cameroon………...…..39
Figure 10 - MSW composition of the city of Yaounde with a high concentration of organic matter……….………...……….41
Figure 11 - Illustrates a 16 m3 waste skip of HYSACAM placed on the sidewalk for waste
TABLES INDEX
Table 1 - Example of some major MSWM strategies and associated problems.………..18
Table 2 - List of some online waste exchange links and the respective countries……….…32
LIST OF ABBREVIATIONS
A
ASTC - Association of Science-Technology Centers
APO - Asian Productivity Organisation
ABA - American Bar Association
C
CCME - Canadian Council of Ministers of the Environment
CIA - Central Intelligence Agency
CBOs - Community-Based Organisations
CSS - Center for Sustainable Systems
D
DEF - Department of Environment FIJI
E
EPA - Environmental Protection Agency
EUROSTAT - European Union Statistics Agency
EU - European Union
EC - European Commission
EPR - Extended Producer Responsibility
EGSSAA - Environmental Guidelines for Small-Scale Activities in Africa
ERA-CAM - Environnement Recherche Action au Cameroun.
EAYT - Earn-As-You-Throw
EEA - European Economic Agency
G
g - Gram
GNI - Gross National Investment
GPP - Green Public Procurement
H
HMLI - High, Middle, and Low-Incomes
HYSACAM - Hygiène et Salubrité du Cameroon
I
ISWM - Integrated Solid Waste Management
IMF - International Monetary Fund
ISWA - International Solid Waste Association
IMCMWM - Inter-Ministerial Commission for Municipal Waste Management
K
Kg - Kilogram
L
LIPOR - Serviço Intermunicipalizado de Gestão de Resíduos do Grande Porto
L - Liters
M
MUDI - Ministry of Urban Development of Indian
MSWM - Municipal Solid Waste Management
MEP - Ministry of Environmental Protection of China
MINENP - Ministry of Environment and Nature Protection
MSW - Municipal Solid Waste
MSWG - Municipal Solid Waste Generation
mm - millimetre
m/s - meters per second
N
NGO - Non-Governmental Organization
NEMP - National Environmental Management Plan
O
P
PPP - Public Private Partnerships
PRC - Presidency of the Republic of Cameroon
PM - Prime Minister
PAYT - Pay-As-You-Throw
R
RCRA - Resource Conservation and Recovery Act
S
SWM - Solid Waste Management
SIC- Standard Industrial Classification
U
UNEP - United Nation Environmental Programme
USA - United States of America
UK - United Kingdom
UN - United Nations
UN-HABITAT - United Nations Human settlements programme
USEPA - United State Environmental Protection Agency
W
WB - World Bank
WTT - Waste Treatment Technology
1. INTRODUCTION
According to Section 261.2 of the Resource Conservation and Recovery Act (RCRA) Regulations, solid waste is defined as, “any garbage or refuse, sludge from a wastewater treatment plant, water supply treatment plant, or air pollution control facility and other discarded material, including solid, liquid, semi-solid, or contained gaseous material resulting from industrial, commercial, mining, and agricultural operations, and from community activities” (EPA, 2011).
Municipal solid waste (MSW), also known as trash or garbage is constituted of household waste, such as appliances, furniture, residential garden waste and domestic hazardous waste. Refuse from local council operations like street sweeping, waste bins, commercial, construction and demolition, and some treated industrial waste may also be considered MSW (Weinstein, 2006), that is set aside for street and home collection (Laner et al., 2011). MSW classification has changed since the late 1960’s for development of strategies (e.g. waste hierarchy) that enhance handling and planning of all items and materials to be discarded (EPA, 2011a; Eurosat, 2009).
Transition towards consumerism societies based on global markets, new materials and telecommunication development, has disseminated goods and information throughout the world (APO, 2007), with a consequent increase in waste production. Waste production rates are increasing exponentially as the world population grows, powered by changes in lifestyles, development and consumption of more non-biodegradable materials (Asase et al., 2009).
In low and some middle-income nations, inadequate service coverage, operational inefficiencies, limited recycling, insufficient management of non-industrial hazardous waste and unsatisfactory landfill disposal mechanisms characterize municipal solid waste management (MSWM) (Parthan et al., 2011). Nonetheless, an increase in the rate of waste generation resembles that of high-income countries. This increase is directly proportional to the number of inhabitants and respective economic status. Hence, failure to provide a suitable discarding system has resulted in immeasurable environmental degradation, with increased health risks to local population and global warming (Al-Salem et al., 2010; MEP, 2010).
Some high and middle-income countries have searched for sustainable MSWM alternatives, like the recent integrated solid waste management plan (ISWM). ISWM is the combination of techniques and programs to efficiently manage municipal waste streams. Considering that waste streams are made up of distinct components that should be dealt with separately in a sustainable manner (EPA, 2012a; Simon, 2008). Sustainability will comprise the usage of a range of different management/treatment options at a local level in each waste stream.
ISWM is broadly evident in the waste management systems in most high-income countries (Pires et al., 2010). Some initiatives towards ISWM in low and some middle-income countries like South Africa, China, and Ghana have been reported, and are often orchestrated by non-governmental organizations (NGOs) (Dong et al., 2010; Lincoln, 2011; Thompson, 2010).
Nonetheless, research statements like; if MSWM strategy problems are technical or political, or/and if high-income citizens generate more waste because of their revenue, were tentatively answered in a number of publications such as research/review papers, articles and thesis. Trends of MSW generation, recycle and composition in some high and low-income countries were assessed by APO (2007), Al-Salem et al. (2010), Hogg et al. (2002), Hoornweg and Giannel (2007), Issam et al. (2010), Laner et al. (2011), Naushad et al. (2008), Parthan et al. (2011), Pires et al. (2010), and Troschinetz and Mihelcic (2008). Additionally, comparisons of MSWM among different cities in the world have also been conducted (Rodic et al., 2010; Tanaka, 2007; UNEP, 2005). The above-mentioned studies have chiefly focused on precise aspects of waste management in most countries, and major cities in the world.
collection, recycling, treatment and disposal; scrutinize current problems and barriers in MSW management in the world; and analyse strategies for future MSWM in Cameroon, a lower middle-income country in West Africa.
Moreover, the research is conceptually based on five chapters. Chapter One introduces background information on solid waste. Notwithstanding, it upholds research background, problems description, research statement, and objectives. Chapter Two holds a review of the various MSWM strategies in the world and presents the methods used for data collection, and analysis. Chapter Three illustrates some important MSWM problems with facts obtained from overflowing sources, in a comparison format based on the gross national investment (GNI) status of low, middle, and high-income countries in the world. Chapter Four paints a picture of the optimization strategies to the identified MSWM problems, with highlights on the socio-technical potentials of all stakeholders involved in MSWM. And, lastly, Chapter Five analyses a cautious conception framework of an ideal pattern, for a sustainable MSWM framework in Cameroon.
2. SOLID WASTE MANAGEMENT: “STATE-OF-THE–ART”
Managing municipal waste in the world has been guarded and implemented with respect to a particular pathway, objective, or strategy. These strategies differ from nation to nation and are often in conformity with the urgent needs of the city/country in relation to the actual status of the waste generated.
2.1 WASTE GENERATION
The availability and quality of data has been the major misfortune of the municipal solid waste management (MSWM) sectors, and this work in particular. Waste data are lacking for many income groups particularly those of low-income countries, where data qualities are changeable, and inconsistence or are often approximations (UN-HABITAT, 2010). Nonetheless, to assemble facts for this work, the following criteria served as foundation in selecting case studies and data predominantly, the country should have a socio-economic status of low, middle, or high-income, as designated by the World Bank, standing firm as the main financial institution. It classifies all the 187 member countries into income categories (income groups) based on bank's operational lending categories (World Bank, 2012; 2011).
The World Bank’s main criterion for classifying economies is gross national income (GNI) or gross national product (GNP) per capita (World Bank, 2012). Therefore, the World Bank atlas assessment method of 2010, classifies the economies groups liable to the GNI in terms of united state dollars (USD) as: countries who’s GNI is $1,005 or less as low-income; lower Middle-income, $1,006 - $3,975; upper middle-income, $3,97 - $12,275; and high-income, $12,276 or more (World Bank, 2012).
Secondly, lower middle and upper middle-income economies of the World Bank, are considered as middle-income economies. Lastly, all case studies originating from member countries/cities within the income group must contain waste characterization data for 10% or more of the county as presented in Appendix A.
0 0,5 1 1,5 2 2,5 Sout h A
fricaNepal UK Sing apor e Tuni sia Can ada Portu gal Ger man y Finl and Swed en Gha na Uga nda Nor way Tanz
ania USAIndi a Aus tralia Mal aysi a Mal ta Kor ea
Belgi um Chi na Turk ey Indo nesi a Rus sia Chi le Gre ece Fiji
Bot swan a w as te g en er at io n r at e (K g /p er so n /d ay )
contribute to the dramatic increase in waste volume. This instigates the purchase and usage of more materials, and encourages immigration, and high birth rates (Rodic et al., 2010; UN, 2011).
Consequently, in high-income countries such as Germany, USA, Canada, waste generation rates is over 2.3 Kg/person/day, while the residents of low-income countries generate less than 0.5 Kg/person/day (See Figure 1). A similar tendency exists in middle-income nations. Encouraged by the improvements in economic conditions, living standards have changed and the rate of consumption of materials increased as well. Subsequently, it induces production of large amounts of waste. Even so, waste creation is stratified; the rich localities have generation rates of 1.6 Kg/person/day. While, lower-income quarters generate as low as 0.6 Kg/person/day. Likewise, waste generation rates vary within high-income nations like Canada, for example, low-income households generate 2.6 Kg/day; middle-income households produce 2.7 Kg/day, and high-income households, 4 Kg/day (Asase et al., 2009; EPA, 2010b). Furthermore, these variations portrait a clear picture regarding the composition of waste.
2.2 WASTE COMPOSITION
Waste is composed mostly of organic matter, paper and cardboard, plastic, glass, metals, textiles, rubber, and leather. Nonetheless, waste composition is based on three fundamental indicators: tradition and culture, lifestyle or eating habits, and the economy of the state.
Waste produced in low-income countries contains a greater percentage of organic materials (82.5%) and moisture content, higher than those of high-income nations as revealed in Figure 1. This is due to the frequent home cooking of freshly harvested tubers, fruits, meat, fish, vegetables, and, to the insignificant rate of consumption of packaged food (Khatib, 2011; Manga et al., 2008). Moreover, waste produced in low-income countries contains paper, but low amounts of plastic, glass and metal (Al-Khatib et al., 2010; Okot-Okumu and Richard, 2011; Thompson, 2010). Furthermore, low-income households generate higher fractions of organic waste than high-income families (Al-Khatib et al., 2010: Lincoln, 2011).
On the other hand, in high and some middle-income countries (parts of South Africa and Russia), lifestyle favours ready-made packaged food instead of home cooking. The prevalent consumption of processed and packaged food products result in a higher percentage of inorganic materials like metals (8%), plastics (8%), and paper/cardboard (45%) (Figure 2).
Figure 2 - The waste composition in low, middle, and high-income countries and in comparison with moisture content.
2.3 WASTE COLLECTION
Waste collection implies gathering of waste, and transport to either the processing facility (WTS), transfer facility or disposal site (EPA, 2010a; b). This process has taken several designs at various collection sites in the world. Firstly, In high-income nations like America, Portugal, Germany, and Canada and some middle-income states like Russia, and part of South Africa, colour code bins are placed in convenient locations, permitting waste holders and producers of a given area to dump it in the respective bins (Pires et al., 2010; UN-HABITAT, 2010).
In contrast, a fairly different assembly approach is used in middle-income countries like South Africa, China, and India, even though they practice a mixed waste collection stream. Household waste is commonly placed in plastic and woven bags or in other sorts of improvised containers and stored at home before taken to the gathering points. Collection containers and skips of sizes 6-16 m3 are placed on roadsides to be collected by waste vehicles or hand-operated carts once a day or twice a week in some nations like South Africa. Notwithstanding, the frequency and area covered is lower in some fatherlands, because of budget and infrastructural constraints. However, the assortment area coverage within a country or city is lower than 50% (APO, 2007; Lincoln, 2011; Tay, 2012).
Additionally, disparity is the order of the day among indigenous groups, often the frequency of collection ranges from twice a week for the high-income residential areas to once a week in the low and middle-income localities. The high-income societies are endowed with adequate collection systems, while low-income regions do not benefit from the same treatment. Therefore, open roadside dumping within a given municipality and country becomes rampant (Manga et al., 2008; Tay, 2012). Despite this disparity, a variety of strategies are employed. Door-to-door collection, where household waste is placed at the doorstep for waste collectors to carry to the primary gathering vessels, it is the collector of the waste who has the responsibility to collect the waste separately (APO, 2007).
The second strategy is Block collection; the assemblage vehicles arrive at a particular place and time to collect waste from households. Families bring waste in assorted vessels and empty them directly into the waste truck. However, this vast social inequality and pitiable MSWM systems instigate citizens to exploit open dumps. Furthermore, municipalities employ sweepers to sweep the streets and public areas using simple utensils and at times automatic sweeping mechanical trucks are employed particularly at the city centers (Lincoln, 2011; Manga et al., 2008).
Most cities in low-income countries collect only part of the overall waste and merely a tiny fraction of the wastes is treated or fairly disposed of (Okot-Okumu and Richard, 2011). The absence of a reliable refuse assortment system, compel family circles to use open dump (15.5%), or simply burn it in their backyards (10%). Accordingly, the unassembled wastes (58.7%) may also accumulate on the streets thus, obstructing rainstorm and water drainage systems (Figure 3) (APO, 2007; Okot-Okumu and Richard, 2011; Tay, 2012).
Figure 3 - Unassembled waste obstructing rainstorm and street.
Moreover, the urban low-income vicinities receive very low or no waste gathering services due to inaccessible roads (Manga et al., 2008). Furthermore, these areas are totally neglected due to their illegal status. In Fiji and Mumbai-Uganda for example, illegal shanty town of over a thousand inhabitants are formed every year (UN-HABITAT, 2010). Besides, waste pickers roam the streets in search of recyclable goods. Being predominantly biodegradable (82.5%) lower-income families dispose waste daily, because of poor and improvised storage utensils, while high and middle income homes dispose twice a week and commercial premises dispose daily as well (Okot-Okumu and Richard, 2011; UN-HABITAT, 2010). The gigantic nature of engendered waste seeks for immediate treatment and clearance options to limit instantaneous effects to the holder.
2.4 WASTE TREATMENT AND DISPOSAL
facility. In UK-London for example, the recyclables are sorted, baled, and 98% are shipped to their respective recyclers whom then transforms it into new products and only 2% of it ends up in the landfill (Asase et al., 2009). Furthermore, in Portugal for instance, with a global recycling rate of 20%, the recycling rates for the different materials are: 12.5% for paper/cardboard, 4.5% of plastics, 30.2% for glass, 24.8% for steel, 6.9% for aluminium and 80% is landfilled, where landfill methane gas is recovered for electricity production (LIPOR, 2008). Notwithstanding, the above treatment strategies, and several others are used either to get rid of the waste (incineration), or to transform it to fertilizers (composting, aerobic digestion), and many more (Thompson,2010).
Indistinguishable, in middle-income countries MSWM is oriented by the rapid urbanization and globalization, therefore, some of the above treatment and techniques such as, landfill gas recovery, waste incineration, composting are being employed. However, 70% or more of it ends up in controlled and semi-sanitary landfills, with less recovery and shipment of recyclables (APO, 2007; Okot-Okumu and Richard, 2011; UN-HABITAT, 2010).
Figure 4 - A typical disposal and treatment strategy in low-income nations (world environmental day).
2.5 WASTE MANAGEMENT STRATEGIES
The international plan of action to sustainable development manifested in the United Nations (UN), Rio de Janeiro Summit of 1992, and the goals of Agenda 21 achieving sustainable development that meets the needs of the poor and recognizing the limits in development to meet global needs (Cutler et al, 2007). More so, the European Council in 2001 adopted the first European Union (EU) sustainable development plan with overall aim, to sustain and endorse actions enabling high-income countries of EU to realize continuous improvement of life for both actual and upcoming generations (Naushad, 2008; Pires et al., 2010). Last but not the least, in 2002, the EPA launched the 2020 vision whose need is to shift focus away from waste to resource materials management. All these ushered a new phase in the regulatory framework of MSWM in the world (EPA, 2012b).
20-30-60% of all urban waste is not collected and less than 50% of the population is served (APO, 2007; Khatib, 2011; Kyessi and Mwakalinga, 2009; UN-HABITAT, 2010: World Bank, 2012). In some cases, as much as 80% of the collection and transportation equipment is out of service, in need of repair or maintenance. Consequently, open dumping and burning becomes legal (World Bank, 2012).
Additionally, acknowledging that humanity is chiefly resource constrained thus end-of-life products and materials have a positive value. Therefore, in low-income societies, wastage is minimised, products are repaired and reused, some organic matter returns to the farms and some food remains are utilised as animal feed (See Figure 5). However, as cities mature, waste mount up in the streets and watercourses, posing acute health risks (Okot-Okumu and Richard, 2011).
More so, streamlined by the economy, refuse stream management is further stratified at the local strata, dependent on the local income standing, road infrastructures and degree of urbanization (APO, 2007; Manga et al., 2008). In addition, there are no clear roles/functions of the various national partners in relation to this sector and no single agency or committee is designated to coordinate the projects and activities of all allies (UN, 2011).
The absence of organization among the relevant intervening actors has resulted in different agencies becoming the national complement to different external support agencies for different MSWM collaborative projects without being aware of what other national agencies are doing (Manga et al., 2008). Hence, the waste stream obeys a haphazard trend, where partially disposed portion of the organic refuse is reused in agriculture, composting, and for agriculture. The rest gets to the collection vessels, where fragments are being collected by waste pickers for sales. This collection also occurs at the landfill site, and there is no accountability (Regassa et al., 2011). Lastly, a huge fraction ends up in/by the roadside and riverbeds as open dumps. Nevertheless, recyclables from the open dumps, primary/secondary collection streams, and landfills, do return to the waste market (waste merchants and intermediaries). The purchased materials are either traded locally to on-site recycling firm, if any or exported as presented in Figure 5 (Asase et al., 2009; Ranjith, 2012).
other indirect means, regardless of how much or how little waste they generate. Part of the funds is later distributed to the municipalities depending on the sizes and importance. For that reason, homes and public areas are mainly interested in receiving effective waste collection and disposal service (World Bank, 2012).
In addition, about 70% of the city’s population live in low-income, high-density populated areas; the middle class is occupied by 17% of the population, and only 3% lives in high-income, low-density residential areas with organized infrastructures (Asase et al., 2009). Tantamount to this, waste service providers who are often from the 3%, provide service in a selfish manner, so long as the quality of their own living environment is not affected by dumpsites, then, the system is effective. Furthermore, inadequate gathering, information, quantification, and classification of waste have often resulted in health, social, economic, and environmental impact within this group (Agyepong, 2011).
Figure 5 - Waste flow stream in low-income countries, from producers to collectors, treatment and finally to disposal and recycling.
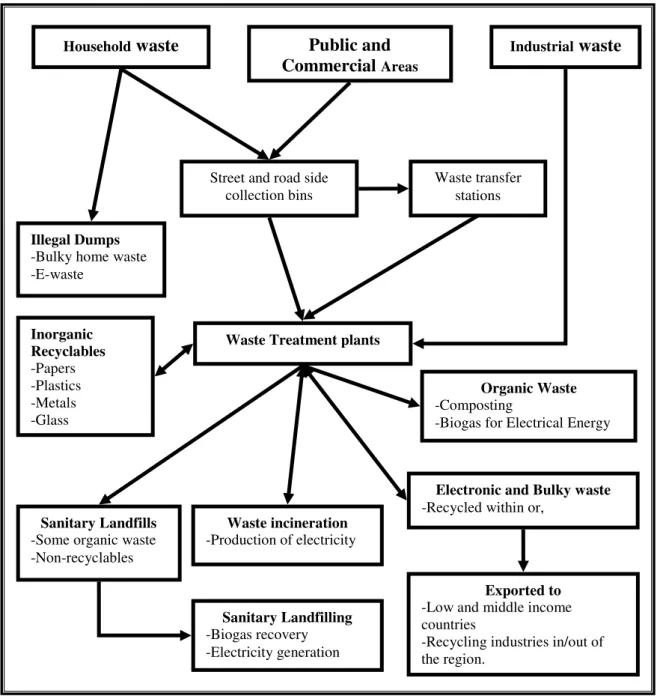
On the other hand, handling waste in high-income countries, has taken a completely altered trend with fundamental strategies confined to public and environmental health and safety, waste collection, treatment/landfills directives implementation and waste minimisation (EPA, 2012a; Eurostat, 2009; OECD, 2011). Waste assembly is a necessity rather than a luxury as in low and some middle-income countries, with collection rates often above 90%. Approaches implemented in this economic group is composed of a variety of methods; vacuum waste collection system (VWCS), payable collection bins (PAYT), sophisticated compacting waste storage means, and adapted collection trucks (Naushad et al., 2008). Besides, collectors practice door-to-door collection using low capacity waste compactor trucks, to carry both
Animal feed
Intermediaries Industry
Open dumps Household
Open burning
Composting Agriculture
NGOs and CBOs Collection
Main collection Primary collection
Landfills
Public places
Waste merchants
mixed and segregated waste from households in districts with narrow streets. Furthermore, the assembled waste is transferred to a waste transfer station (WTS) as shown in Figure 6. Anyhow, the amount and composition of municipal waste disposed depends on national and regional waste supervision practices and rules (EPA, 2012a; d).
Besides, regardless of these improvements in MSWM approaches, and polices such as the Waste Directive of EU-27 and EPA Act 490 (EPA, 2012a; Europa, 2011). Only a few countries have succeeded in dropping or stabilising the quantity of wastes disposed of. Anyhow, the kilogram of municipal waste per capita created each year is gradually stabilizing, in some countries like Portugal, Germany, Finland, and Sweden (OECD, 2011).
Nevertheless, there are some states USA, and Canada, with apparently the same MSWM strategies and boundaries whose waste volume is yet to stabilise. Likewise, most countries in this context have in place quality, assurance systems that either stand freely, or are supportive of the existing legislative standards. These systems have a variety of objectives aimed at ensuring the production of quality collection, transportation, and treatment services, often highly dependent on the local and regional policies, such as those of the EU-27 countries (Pires et al., 2010).
Household waste Public and Commercial Areas
Industrial waste
Street and road side collection bins Inorganic Recyclables -Papers -Plastics -Metals -Glass Waste transfer stations
Waste Treatment plants
Waste incineration -Production of electricity
Organic Waste -Composting
-Biogas for Electrical Energy
Sanitary Landfilling -Biogas recovery -Electricity generation Sanitary Landfills
-Some organic waste -Non-recyclables
Electronic and Bulky waste -Recycled within or,
Exported to -Low and middle income countries
-Recycling industries in/out of the region.
Illegal Dumps -Bulky home waste -E-waste
Figure 6 - The waste flow stream from point of generation, collection, transportation and to respective disposal
sites.
3. SOLID WASTE MANAGEMENT ASSOCIATED PROBLEMS
The socioeconomic status of high, middle, or low-income countries, as designated by the World Bank, is based on the country’s gross national investment (GNI), as previously elucidated. Therefore, for representation of facts in this comparative analysis, countries without a national illustrative statistic were not considered (Appendix A). In addition, statistics from non-governmental organisations such as UNEP, WB, UN, OECD, EU, do not consistently provide actual national data, but rather provide data for particular large population centres in the nation, and all of these were encompassed in this study.
Waste management systems have social drivers (consumption habits, lifestyle and communication); economic (waste cost and benefit), political (waste regulation and laws), technological (various waste treatment technologies), and environmental drivers capable of shaping the operating system (Pires et al., 2010; Zaman et al., 2011) and that should be given equal attention. Contrarily, the utmost ideal waste design will be unsuccessful. Neglecting the dynamics of the drivers involved has resulted in problems such as source reduction, source sorting, recycling, waste collection (Table 1), for the various income groups in the world (UN-HABITAT, 2010).
3.1 REDUCTION AT SOURCE
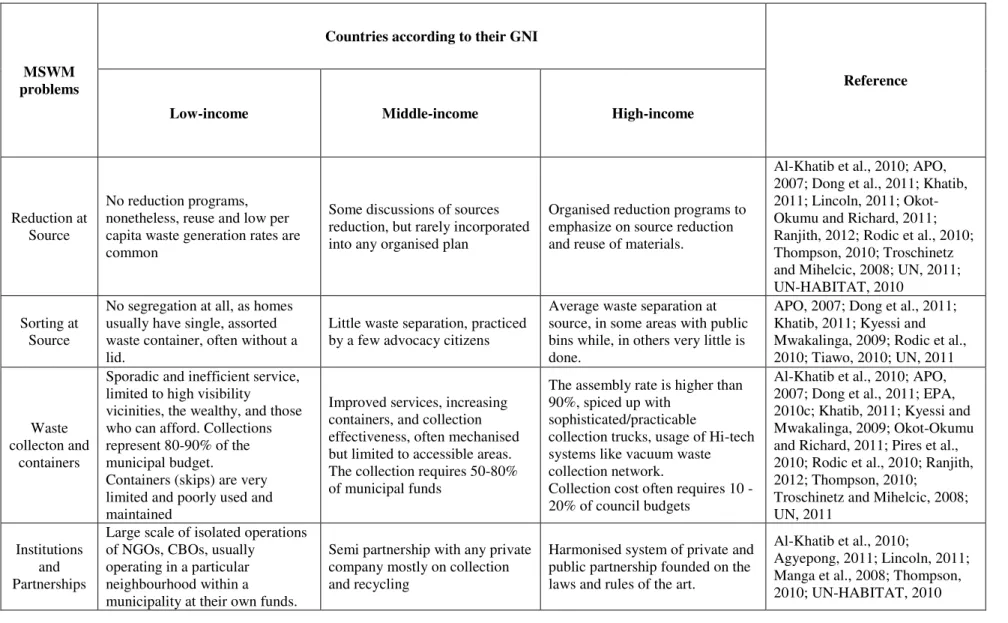
Table 1 – Example of some major MSWM strategies and associated problems.
MSWM problems
Countries according to their GNI
Reference
Low-income Middle-income High-income
Reduction at Source
No reduction programs, nonetheless, reuse and low per capita waste generation rates are common
Some discussions of sources reduction, but rarely incorporated into any organised plan
Organised reduction programs to emphasize on source reduction and reuse of materials.
Al-Khatib et al., 2010; APO, 2007; Dong et al., 2011; Khatib, 2011; Lincoln, 2011; Okot-Okumu and Richard, 2011; Ranjith, 2012; Rodic et al., 2010; Thompson, 2010; Troschinetz and Mihelcic, 2008; UN, 2011; UN-HABITAT, 2010
Sorting at Source
No segregation at all, as homes usually have single, assorted waste container, often without a lid.
Little waste separation, practiced by a few advocacy citizens
Average waste separation at source, in some areas with public bins while, in others very little is done.
APO, 2007; Dong et al., 2011; Khatib, 2011; Kyessi and Mwakalinga, 2009; Rodic et al., 2010; Tiawo, 2010; UN, 2011
Waste collecton and
containers
Sporadic and inefficient service, limited to high visibility
vicinities, the wealthy, and those who can afford. Collections represent 80-90% of the municipal budget.
Containers (skips) are very limited and poorly used and maintained
Improved services, increasing containers, and collection effectiveness, often mechanised but limited to accessible areas. The collection requires 50-80% of municipal funds
The assembly rate is higher than 90%, spiced up with
sophisticated/practicable
collection trucks, usage of Hi-tech systems like vacuum waste collection network.
Collection cost often requires 10 -20% of council budgets
Al-Khatib et al., 2010; APO, 2007; Dong et al., 2011; EPA, 2010c; Khatib, 2011; Kyessi and Mwakalinga, 2009; Okot-Okumu and Richard, 2011; Pires et al., 2010; Rodic et al., 2010; Ranjith, 2012; Thompson, 2010;
Troschinetz and Mihelcic, 2008; UN, 2011
Institutions and Partnerships
Large scale of isolated operations of NGOs, CBOs, usually
operating in a particular neighbourhood within a municipality at their own funds.
Semi partnership with any private company mostly on collection and recycling
Harmonised system of private and public partnership founded on the laws and rules of the art.
Al-Khatib et al., 2010;
MSWM problems
Countries according to their GNI
Reference
Low-income Middle-income High-income
Legislation and policies
General laws, handling all environmental drivers
Very good waste policies, but the implementation is problematic, coupled with the absence of assessment tools.
Too many laws but local and regional, often with specific objectives and targets, enhanced by abundant assessment tools.
Al-Khatib et al., 2010;
Agyepong, 2011; Lincoln, 2011; Manga et al., 2008; Nigatu et al., 2011; UN-HABITAT, 2010
Waste charges (Tipping fees
and PYAT)
Waste fees are regulated by local government taxation system. no PAYT strategy
Waste fees are regulated by some local and national governments, and there are more innovation in fee collection.
PAYT and landfills tipping fees large employed in waste treatment facilities. Upfront community participation reduces costs and increases options available to waste planers (recycling and composting)
Al-Khatib et al., 2010; Agyepong, 2011; EPA, 2010c; EPA, 2012d; Lincoln, 2011; Manga et al., 2008; Nigatu et al., 2011; Okot-Okumu and Richard, 2011; Thompson, 2010; UN-HABITAT, 2010
Waste Treatment (Recycling)
No direct governmental recycling plans except some isolated practice from the private sector and individual scale
Informal and partial municipal participation, involving some high technology. sorting and processing facilities (composting, recycling, and incineration. some materials are exported for recycling
Formal municipal, private and government participations in treatment facilities with hi-tech technology on site.
Al-Khatib et al., 2010; APO, 2007; EC, 2012; EPA, 2010; Dong et al., 2011; Kyessi and Mwakalinga, 2009; Nigatu et al., 2011Rodic et al., 2010; Ranjith, 2012; Sam, 2009; Thompson, 2010; UN-HABITAT, 2011
Landfills acquisition
The presence of cheap, abundant land makes it very easy
Availability of cheap land facing rapid and disoriented
urbanisation soon encroach landfill.
Controlled Sanitary landfills, with leak detection, leachate collection and treatment systems, gas collection, and treatment units. Is facing a huge dismay in locating a new site within the vicinities of the host city.
Reduction at source comprises designing, manufacturing, and usage of post consumer and pre-consumer materials in a way that reduces the quantity and toxicity of waste, when products reach the end of their valuable lives (EPA, 2012c). Additionally, source reduction activities include product reuse, elimination of unnecessary product packaging, reduction of products toxicity, increase in product lifespan, and decrease consumption, by changing consumer-buying practices. Consequently, source reduction varies according to the income group.
In high-income countries (e.g. USA) and some middle-income countries (e.g. Russia, Malta), the amount of waste each person generates has been on the rise since the 1960s, ranging from 1 to 2.5 Kg/person/day. This results in about 250 million tonnes of waste generated in 2010 in the USA alone (EPA, 2010a). EPA introduced an integrated waste hierarchy program in the early 1990s, the “Pay-As-You-Throw (PAYT)” program, in which citizens pay for each can or bag of waste they set out for disposal, rather than through a flat fee.
Therefore, by reducing waste at the source, people dispose of less waste and pay lower waste bills (EPA, 2012d). Nevertheless, the waste volume continues to rise, based on the above-mentioned drivers. Bulky wastes like furniture, mattresses and white goods like home appliances made chiefly of metal, textile and other recyclables, are being disposed of alongside regular house waste (UN-HABITAT, 2011).
Contrariwise, source reduction in low and some middle-income nations is achieved to its extremes. Held down by low economic potential, tradition and lifestyle, white goods, bulky wastes and some waste such as plastics and glass bottles are being used and reused for over a long period before they are disposed of (Troschinetz and Mihelcic, 2008). Huge volumes of waste are therefore, diverted from the waste stream.
3.2 WASTE SORTING AT SOURCE
components (Tiawo, 2010). Sorting out the different elements in refuse is indispensable for recovery of useful materials, minimizing landfilled resources and allowing recyclable materials to a new embodiment (Dong et al., 2011; UN, 2O11).
In low-income countries, in-home waste separation is considered a horrible exercise, and everybody wants to get rid of it as quickly as possible. Useful objects are not dumped in waste bags. Nevertheless, storing mixed wastes makes recycling operations very time consuming, reduces productivity and increases production costs. It also reduces the quality of recycled products. (Dong et al., 2010; Tiawo, 2010). Notwithstanding, the development of a recyclable market in Tanzania, Fiji, Nepal has boots the aptitude of some individuals to practice source separation and gain some money from the sales of the recyclables (APO, 2007; Dong et al., 2010; Okot-Okumu and Richard, 2011).
In some middle-income countries like South Africa, India, Russia, China, and Tanzania, communities that are sorting waste at the source are continuously increasing, especially, within the low-income regions. However, the inadequate number of classified containers for recycling in residential areas induces users to dispose waste in a mixed state. Besides, lack of public education and incentives weakens residents sorting intentions. In these countries, materials recovery takes place in the informal sector since government shows little interest (UNEP, 2011).
3.3 WASTE COLLECTION AND CONTAINERS
In low-income countries like Tanzania and Ghana, failure to consider local parameters (containers placing, type and size) at each locality has led to many situations where, gathering vehicles and containers have been purchased in large numbers but have not been effective and have been operational for a short duration (UN-HABITAT, 2011).
More so, the characteristics of waste from this region 82.5% organic matter according to Figure 2, very moist and heavy, often fill the trucks faster and overload it. Hence, lesser amounts are collected. Worthwhile, more time is needed for further collection as the truck has to undergo several trips per day. In addition, hand loading the trucks require more time and usually need more men per truck. Lastly, trucks breakdown for long duration caused by poor maintenance and lack of spare parts, which at times have to be imported (Kyessi and Mwakalinga, 2009; Thompson, 2010). Finally, the nonexistence of adapting trucks, limited equipment, street lighting and adequate road networks completely prohibit night collection periods, and consequently, less than half of the day’s production is collected (UN-HABITAT, 2011).
Furthermore, collection circumstances are not so different in middle-income countries. With a developing economy, some basic infrastructures like roads, streetlights, etc., have been constructed to permit the usage of any modern waste equipment such as compactor trucks, and roll off skips trucks. The local municipality then collects mixed waste disposed in the skip (dumpsters) or compact trucks during collection days and disposes them in a control landfill. Notwithstanding, as similar problems often result in approximately the same effects, huge volumes of waste wallow in the streets and river beds due to non sustainable designing. Nonetheless, local authorities have the responsibility to provide or arrange for the collection of household waste while employing different strategies like point to point, door to door and skip collections, unless an alternative collection service is available or/and cost of providing assortment service is unreasonably expensive (Geyer, 2008; Thompson, 2010).
plastic waste bins of 20L, 50L, 100L, 240L, and 1100L, all season roads and applicable laws, actually favours a 99% collection of generated waste in all vicinity throughout the year (Desmond, 2007; Pires et al, 2010).
3.4 PARTNERSHIP AND LEGISLATIONS
Cooperation and policies are considered as perfect cement in the waste stream, exists in countries all over the world (UN-HABITAT, 2011). The application of precise rules varies from one nation to the other. For example, in China, there exist four laws on waste management: environmental protection law of the People ’s Republic of China (PRC), the law of the PRC on prevention of environmental pollution caused by solid waste, cleaner production promotion law of the PRC, and the Circular Economy Promotion Law of the PRC (MEP, 2010). India, on the other hand, fosters Article 48-A, and 52-A of Indian’s Constitution (Chakrabarti, 2006; MUDI, 2012). Germany, Portugal, and the USA also, have laws and directives pointed earlier, that are prepared to battle; waste minimization, promote reuse, reduce philosophy, recycling, regulate waste transportation and shipment, and EPR for all stakeholders and search to impose stricter monitoring procedure for waste disposal (EPA, 2012c; Pires et al., 2010).
Cooperation and policies are considered as perfect cement in the waste stream, exists in countries all over the world (UN-HABITAT, 2011). The application of precise rules varies from one nation to the other. For example, in China, there exist four laws on waste management: environmental protection law of the People ’s Republic of China (PRC), the law of the PRC on prevention of environmental pollution caused by solid waste, cleaner production promotion law of the PRC, and the circular economy promotion Law of the PRC (MEP, 2010). India, on the other hand, fosters Article 48-A, and 52-A of Indian’s Constitution. Germany, Portugal, and the USA also, have laws and directives pointed earlier, that are prepared to battle; waste minimization, promote reuse, reduce philosophy, recycling, regulate waste transportation and shipment, and EPR for all stakeholders and search to impose stricter monitoring procedure for waste disposal (Chakrabarti, 2006; EPA, 2012c; MUDI, 2012; Pires et al., 2010).
community in general. (Sam, 2011: UN-HABITAT, 2010). Moreover, public-private partnerships (PPPs) exist in the form of municipalities, Waste pickers, Itinerant/stationary waste buyers, Small-scale recycling industry, micro-enterprises, large-scale recycling industry, community-based Organisations (CBOs), and NGOs. PPPs is an alliance by which government and private companies assume co-responsibility and co-ownership for the delivery of services (Dong et al., 2010; Okot-Okumu and Richard, 2011; Sam, 2009; Ranjith, 2012; Thompson, 2010). The degree of applicability of these laws and partnership results in enormous challenges and varies within the world.
Foremost, in low and some middle-income countries like Ghana, Nepal, South Africa, India, and Uganda, the private sectors- dynamism, access to finance, knowledge of technologies, managerial efficiency, and entrepreneurial spirit, combined with the social responsibility, and environmental awareness, is involved in the day-to-day gathering of homes waste in this area, with the creation of jobs for the local population, and enhancement of livelihood of the poor. Nonetheless, these partners work under shadow laws and conditions, with no clear directives and pattern to enhance their status (Scribner, 2011).
Contrarily, under mutually favourable circumstances, it is advantageous for both the public and the private sectors to play active roles, despite the disadvantages. Thus, capitalizing on the strengths of each sector, yet, this is far-fetched in this area. Furthermore, the public sector whose main rule is to regulate policies often assumes a blind eye or acts sporadically (Maria, 2008; Okot-Okumu and Richard, 2011). In contrast, in high and some middle-income countries, like, Germany, USA, Portugal, Sweden Finland and Russia, PPPs and legislation are under scrutinized local and zonal waste policies. These rigorous checks and control keeps the waste stream in a dynamic status, with each partner having a watchful eye on the activities of the other. Notwithstanding, in some regions such as the EU, local waste policies at times conflict with EU Directives. This at times, generates strains in some countries (Lincoln, 2011; OECD, 2011; Pires et al., 2010; Simões et al., 2012).
3.5 TIPPING FEES, RECYCLING AND LANDFILLS
range and not far from the source of waste. Typically, collection and transportation account for 75% of the total cost of solid waste management, and recycling has been relying on landfill tipping fees (WB, 2011). MSWM and partnerships have been greatly dependent on the refuse charges, where each tonnage of waste disposed at the site is taxed, and the amount paid influences the search for recycling and other disposal methods from one country to the other. (Achyut, 2008; Eco Governance, 2004).
Primarily, in most low and some medium-income countries, almost 99% of the generated waste goes to the landfill. Persuaded by the prepared tax (flat tax) system for waste collection, which is acquired through, land tax, electricity and water bills, goods, or other means as mentioned earlier. Supplementary budgets come from the state financial budget on the basis of projected fiscal revenue flows, and finally, as cooperation aids from foreign bodies. Hence, regardless of how huge or how little the waste volume, the municipality has to get rid of it. Moreover, abundant land within and around the towns/cities makes landfill disposal easy and cost effective. Nevertheless, as the cities grow bigger the vital space gets smaller as in high-income countries, thus disposal becomes problematic (Marques et al., 2011; Okot-Okumu and Richard, 2011; World Bank, 2012).
On the other hand, high-income nations and Russia, restricted by urbanisation and landfill Directive like that of the EU countries. Ideal landfill sites can be located only in the hinterlands and which are often far away from the waste sources. The scarcity of landfill space, endlessly contributes in the escalation of landfill tipping fees per tonne of refuse and the enrichment of recycling. Even so, the building and operating landfills, transfer stations, material recovery facilities, and waste-to-energy plants require money. The funds often come from hauliers, who pay per-load upon arriving at a facility and the amount could vary from $15-$87 or more as confirm in Figure 7. Waste transporters in return charge customers (waste producers) through PAYT bills for waste collection services to cover the cost (EPA, 2012d; Helou et al., 2011; Simões, 2012).
0 10 20 30 40 50 60 70 80 90 100
1 2 3 4 5 6 7
Case studies
L
a
n
d
fi
ll
f
ee
/R
ec
y
cl
in
g
r
a
te
(%)
Landfill tipping fee Recycling rate
recyclables. The recyclables can be sole for extra profit, and the biodegradable organic matter can be sold as well to mechanical biological treatment plants (MBT) plants, to be used as raw material in the production of biogas, fertilizer and electricity (CSS, 2009; Helou et al., 2011; Sterecycle, 2012).
4. MSWM PROBLEMS-OPTIMISATION STRATEGIES
Despite the achievements obtained in waste recycling, the amounts of waste discarded or pending disposal are on the rise. This raises important questions on the aptitude of the existing treatment facilities (ISWA, 2012). Nevertheless, the era where MSWM systems were designed in isolation of its main components (people and waste content) is now a matter of the past. People, environment, technology and finances, are vital components in the fight for resource conservation (EGSSAA, 2009), which begins with awareness of the natural limits of resources, both materials and energy (EC, 2012). This awareness present in ancient times has gradually been misplaced in face of today’s “prosperous society” (ISWA, 2012).
Provided nations continue to afford raw materials and energy with ease. It is therefore, likely, that this situation will not change. Nevertheless, some governments and enlightened civic groups are promoting successful incentives and tactics to ensure that people take better care of global possessions. Today’s MSWM practices do not adequately fulfill this objective. Hence, the need to further develop or enhance the effective management of resources used in manufacturing processes, should be designed to take into account resource conservation goals, even if this seems to conflict with economic benefits (EGSSAA, 2009; ISWA, 2012).
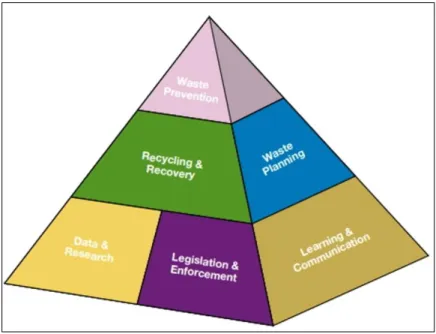
Figure 8- The waste strategy pyramid, illustrating polices that enhance a sustainable MSWM system (Rooker,
2006).
4.1 WASTE PREVENTION
Waste prevention is the reduction in the amount and/or toxicity of materials entering the waste stream prior to recycling or disposal. Preventing refuse before its creation, provides an alternative in managing waste. Besides, it gets to the roots of our society over-consumption and extravagant use of resources. Therefore, instead of spending time, effort, and money on short-term solutions to the problem of what to do with waste, more and more determination should be apply in advocating the following:
4.1.1 Pay-As-You-Throw (PAYT) / “Earn-as-you-throw (EAYT)”
In opposition, EAYT or waste for money is the contrary of PAYT, often applied in low-income regions, where source reduction is very high but waste collection is rather absent or inefficient. This tactic boosts the householder’s ability to supply separated waste for money (UNEP, 2011). Advocating each of these strategies in its corresponding environment will greatly enrich waste reduction, recycling and prevent open dumping. These methods further enhance the economy of local population and boost the installation of other recycling amenities due to the availability of materials (EPA, 2012d; Whitfield, 2010).
4.1.2 Green public procurement (GPP)
Green Public Procurement (GPP) is a plan by which governments and individuals integrate environmental criteria into all stages of their acquisition processes of goods or services. It is aimed at encouraging the spread of environmental technologies and the development of environmentally sound products, by seeking outcomes and solutions that have the least possible impact on the environment throughout the life-cycle. Additionally, GPP is a win-win tool, which leverages economic and environmental objectives. On the one hand, it enables the production and procurement of low-carbon, environmentally friendly goods, and services (OECD, 2009). Nonetheless, GPP represents a business opportunity for the suppliers of goods and services, as it encroaches rapidly the boundaries of the growing market for environmentally positive products and services.
Furthermore, though GPP is a self-conscious/personal initiative tool, its usage and impact are being felt in most OECD and EU countries, particularly; Austria, Denmark, Finland, Germany, Netherlands, Sweden, USA, and the UK, operating under certain umbrellas like, eco-labelling and eco-certifications of goods and services. Likewise, with an EU public investment budget of 16%, it can help stimulate production of more sustainable goods and services which otherwise would be difficult to get onto the market. Endorsing on green consumption/purchasing attitude in this manner, will value Directive 94/62/EC on packaging, and packaging waste. Additionally, the utilisation of biodegradable packaging products by consumers enhances the quantity, quality, and composition of waste that the MSWM systems have to deal with (EC, 2012; EPA, 2010).
national criteria. The upcoming challenge as GPP becomes widespread, is to ensure that the principles are compatible between countries and continents in the world. A suitable universal playing ground will boost a single market, and ensure that, what is valid for the EU is also decent for the environment, according to EU Commissioner for Environment Janez Potočnik (EC, 2012).
4.1.3. Extended producer responsibility (EPR)
Article 8 and 14 of the EU’s waste framework Directive 2008/98/EU evokes the polluter-pays principle, a requirement for the costs of discarding waste to be handled by the current holder of the waste, by previous holders or by the producers of the product from which the waste came from (EC, 2012b). The idea behind EPR is voluntary, and this places the burden upon the manufacturer to reduce the environmental impacts of the product at each stage of the product life cycle. Furthermore, the producers and/or importers of the goods take responsibility for the waste (CCME, 2009; ISWA, 2012).
This would not only ease the burden of waste collection and disposal, but provides an incentive for companies to produce fewer wasteful products and packaging. Complementarily, EPR does not consider only the manufacturers accountable for environmental impact. The responsibility is extended to all those involved in the product chain, from manufacturers, suppliers, retailers, consumers, companies and disposers of products. This impact can be felt in electronics such as NOKIA electronics and packaging materials firms in Europe (Moyes, 2010; Nokia, 2011).
4.1.4 Waste Reuse
Reuse according to “Zero waste Scotland” is the act of using items as many times as possible, this helps save resources landfilled. This concept is already practiced in low and some middle-income countries to its limit, favoured by community lifestyle and “poverty.” Moreover, the activity focuses on the usage of components with economic and social values, and it is experienced at all levels of society.
Household within low-income peri-urban areas uses recovered materials, which include reuse of plastic bags, bottles, paper, cardboard, and cans for domestic and commercial purposes (Mbeng et al., 2009). The duration of reuse of these materials is high, and the materials return to the formal waste collection stream simply when they are no longer fitted to be reclaimed. Additionally, in high-income homes, only domestic servants and/or wardens carry out recovery. The extent to which these transactions occur depends on the availability of local market and materials needs (UNEP, 2011; 2005).
Last but not least, in high and some middle-income countries like Russia, the act of reuse faces a different direction. With the economic power at hand, goods are bought virtually on a regular base. This often results in the creation of huge volumes of waste per person awaiting disposal as displayed in Figure 2. Further handicapped by the capitalistic and individualistic lifestyle, reuse practices become impossible, and people rather prefer a brand new item than to repair and use the old ones. Additionally, maintenance/repairs costs are more expensive than those of new products. This somehow inhibits reuse and promotes usage of newer goods (Maria, 2008; OECD, 2009; Pires et al. 2010). To counterweight this attitude, most OECD, UK, USA, and EU countries have in place the following reuse strategies, powered by the government and private bodies (EPA, 2010b; c; OECD, 2009). The most prominent of all is the online waste exchange services.
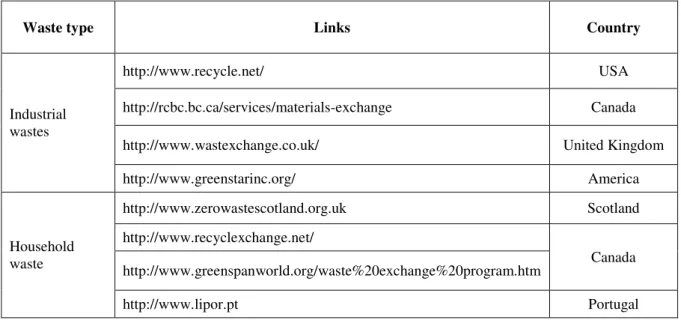
This service promotes reuse and waste diversion from landfills. For instance, a person might not want his old stereo set any more and, rather than throwing it out in the bin. He/she puts it online and the person who needs it simply gets into contact with the holder and collects it in person or pays for the shipping fee. Notwithstanding, other sites enhance sales of second hand or used items at giveaway prices (Andrews and Maurer, 2010; Whitfield et al., 2006). LIPOR (Serviço Intermunicipalizado de Gestão de Resíduos do Grande Porto) sorting centre of Porto-Portugal, offers a service to facilitate waste exchange , and has created a market for waste materials where individuals can dump bulky and white home goods for money (LIPOR, 2008).
Table 2: List of some online waste exchange links and the respective countries
Waste type Links Country
Industrial wastes
http://www.recycle.net/ USA
http://rcbc.bc.ca/services/materials-exchange Canada
http://www.wastexchange.co.uk/ United Kingdom
http://www.greenstarinc.org/ America
Household waste
http://www.zerowastescotland.org.uk Scotland
http://www.recyclexchange.net/
Canada http://www.greenspanworld.org/waste%20exchange%20program.htm
http://www.lipor.pt Portugal
4.2 SUSTAINABLE DESIGN
Climate change and resource depletion are evolving problems of great anxiety. Therefore, engineering research models are studying waste production processes and assessing the interactions in numerous sorts of MSW planning, evaluating the impacts from technical, social and economic viewpoints. However, often these models are not geared toward helping decision makers’ needs (Mohsen, 2009; MUDI, 2012).
The contribution is limited to the use of algebraic functional models, structured to derive strategic guidelines and/or orientations in a MSW process. At times, mathematical research findings are contradictory with existing ideas embedded in the minds of decision makers. For that reason, engineering models have not been applied to the same extent as system assessment tools (EPA, 2010c; Pires et al., 2010). Therefore, MSWM planning, policy, research, recovery or recycling process, should be designed based on the reality of the area of application. There must be no “copy-paste” models as has been the case over the past decades, because of the uniqueness of each environment.
4.3 LEARNING AND COMMUNICATION
Communication is a procedure by which to dispense and transfer wisdom in an attempt to create or share understanding. It demands a vast inventory of skills in intrapersonal and interpersonal processing, akin to listening, observing, speaking, questioning, analysing, and evaluating (OSPI, n.d.).
All the same, experience has proven that every new reform usually witnesses barriers. Campaigners must first eradicate their own inexperience to educate themselves, and gain knowledge of the basic causes and remedies of sociotechnical problems. Consequently, when educating others, they must invoke their opposition to the problem and arouse their understanding with the remedy. By irritating the masses with concern and being armed with knowledge of the therapy, the few moderate opponents will be influenced to either join the righteous battle, or be overcome by the greater force of the ethical revolution (Foldvary, 1998; OECD, 2009; OSPI, n.d; Rooker, 2006).
A linear model was developed based on the additive correlations between the amount of municipal solid waste generation (MSWG), populations, GDP per capita and illiteracy rate (after communication, and evaluation), and it is expressed as
MSWG = a + βX1 + αX2 + γX3
Where: MSWG is the amount of municipal solid waste generation, X1 is population, X2 is GDP per capita and X3 is illiteracy rate, and a , β, α, and γ. are the coefficient of correlation variables.