ABSTRACT: Purpose: Methodological paper aiming to describe the development of a digital and self‑reported
food frequency questionnaire (FFQ), created to the 1982 and 1993 Pelotas Birth Cohorts. Methods: The instrument was created based on FFQs previously applied to subjects belonging to both cohorts in the 2004 and 2008 follow‑ups. The FFQ was developed including 88 foods and/or meals where frequencies were clustered from a minimum of never or once/month to a maximum of greater than or equal to 5 times/day. The closed options related to portions were based on a 24‑hour recall previously asked to a subsample from the 1993 cohort. Three options for portions were created: equal to, less than or greater than. Equal to portion was described based on the 50 percentile of each food consumed reported in a 24‑hour recall. Photographs of portions related to the 50 percentile for each food were also included in the software. Results: This digital FFQ included food and meals based on the needs of current researches. The layout of the software was attractive to the staf members as well as to the cohort members. The responding time was 12 minutes and the software allowed several individuals to use it at the same time. Moreover, this instrument dismissed interviewers and double data entry. Conclusion: It is recommended the use of the same strategy in other studies, adapted to diferent contexts and situations.
Keywords: Questionnaires. Data collection. Database. Food consumption, Eating habits. Longitudinal studies.
Design of a digital and self‑reported food
frequency questionnaire to estimate food
consumption in adolescents and young adults:
birth cohorts at Pelotas, Rio Grande do Sul, Brazil
Desenho de um questionário de frequência alimentar digital autoaplicado
para avaliar o consumo alimentar de adolescentes e adultos jovens: coortes
de nascimentos de Pelotas, Rio Grande do Sul
Bruna Celestino SchneiderI,Janaína Vieira dos Santos MottaII,Ludmila Correa MunizIII,
Renata Moraes BielemannIII,Samanta Winck MadrugaIII,Silvana Paiva OrlandiIII,
Denise Petrucci GiganteI,III, Maria Cecília Formoso AssunçãoI,III
ORIGINAL ARTICLE / ARTIGO ORIGINAL
IGraduate Program in Epidemiology, Universidade Federal de Pelotas – Pelotas (RS), Brazil. IIGraduate Program in Health and Behavior, Universidade Católica de Pelotas – Pelotas (RS), Brazil.
IIISchool of Nutrition, Universidade Federal de Pelotas – Pelotas (RS), Brazil.
Corresponding author: Bruna Celestino Schneider. Programa de Pós‑Graduação em Epidemiologia – UFPel. Rua Marechal Deodoro, 1.160, 3º andar, CEP: 96020‑220, Pelotas, RS, Brasil. E‑mail: [email protected]
Conlict of interests: nothing to declare – Financial support: none.
INTRODUCTION
The evaluation of food consumption has been increasingly referred to when estimat‑ ing the association between dietary factors and the development of non‑communicable diseases and health problems (CNDHP)1. A challenge for researchers in nutritional com‑
municable diseases and health problems epidemiology is to accurately measure the food intake of the populations. Despite all the diiculty inherent in the dietary assessment, the methods for investigation of food intake are basic tools in epidemiological studies focused on the nutrition area. In this sense, attempts have been made to create instru‑ ments capable of positively responding to the diiculties imposed by the complexity of human feeding1,2.
The instruments for dietary evaluation must consider the extensive variability of food intake by the human individuals and groups, considering that feeding may vary from day to day, from week to week, and tends to go through more profound changes over the years. Besides, although there is a consistent pattern underlying the individ‑ ual diet, many cultural, economic and environmental facts contribute to the variation of food intake2,3. Different methods, such as dietary history, daily food log, 24‑hour
recall (24HR) and food frequency questionnaire (FFQ), are used in order to evaluate the dietary intake3.
RESUMO: Objetivo: Artigo metodológico com o objetivo de descrever a construção de um questionário de frequência alimentar (QFA) digital autoaplicado, desenvolvido para as coortes de nascimentos de Pelotas de 1982 e 1993. Métodos: O instrumento foi criado com base em QFAs anteriormente utilizados nas duas coortes em acompanhamentos nos anos de 2004 e 2008. O QFA foi elaborado incluindo 88 alimentos e/ou preparações cujas frequências foram agrupadas em categorias desde o valor mínimo de consumo de nunca ou < 1 vez/mês até o máximo de ≥ 5 vezes/dia. As opções fechadas relativas à porção foram construídas considerando recordatórios de 24 horas (R24Hs) anteriormente aplicados à subamostra da coorte de 1993. Três alternativas de porção foram construídas: igual, menos ou mais. A porção igual foi descrita com base no percentil 50 do consumo de cada alimento, obtido a partir das distribuições das porções constantes nos R24H. Fotos das porções relativas ao percentil 50 de cada alimento foram também incluídas ao formato do programa. Resultados: Esse QFA digital incluiu alimentos e preparações que atendem aos objetivos das pesquisas atuais. A aparência do programa foi atrativa à equipe de trabalho e também aos participantes do estudo. O tempo médio de aplicação de 12 minutos e a facilidade de preenchimento possibilitaram que vários participantes respondessem às questões ao mesmo tempo. Além disso, o instrumento dispensou a necessidade de entrevistador e a dupla entrada de dados em programa especíico. Conclusão: Recomenda‑se o uso dessa mesma estratégia em outros estudos, adaptando‑a aos diferentes contextos e situações.
DESIGN OF A DIGITAL AND SELF-REPORTED FOOD FREQUENCY QUESTIONNAIRE TO ESTIMATE FOOD CONSUMPTION IN ADOLESCENTS AND YOUNG ADULTS: BIRTH COHORTS AT PELOTAS, RIO GRANDE DO SUL, BRAZIL
Despite the diversity of available instruments, the FFQ has been considered the method of choice in epidemiological studies, especially when working with large sam‑ ples1,3. The preference for the FFQ is based on its low cost and convenience in obtaining
analyzing information. However, these advantages may be enlarged with the substitution of conventional method of use, such as questionnaires printed on paper, by the applica‑ tion of the digital instrument. Studies have shown that the researches with this kind of instrument have a series of advantages, once they allow continuous collection of data3,4, in
addition to being attractive especially to new generations.5 Other advantages of this kind
of use are speed and accuracy in the collection of data, considering that the answers of digital questionnaires be automatically stored in a database, eliminating the need for dig‑ italization, reducing codiication errors, and presenting reduced risk of data loss,6 which
decreases, consequently, the time and cost of data collection and the workload relating to the treatment of the data7,8.
Considering the above, the digital self‑administered FFQ was designed with the objec‑ tive of estimating the dietary intake among the participants in birth cohorts, from 1982 and 1993, in Pelotas. This article describes the development of this questionnaire with the objective of allowing the replication of this process for the creation of other FFQs, in sync with the speciic needs of each study.
METHODS
The city of Pelotas, located in the far south of the State of Rio Grande do Sul, Brazil, has 3 birth cohorts that were initiated at intervals of 11 years, the irst one being the birth cohort performed in 1982. The FFQ presented here was developed in order to be used in the collection of data of the two irst cohorts, at 30 (born in 1982—follow‑up in 2012) and 18 years of age (born in 1993 — follow‑up in 2011), respectively. The method‑ ology of these two studies is briely described below.
All hospital births occurred in 1982 and 1993 in the city of Pelotas were monitored, 5,914 and 5,249 live births included in a cohort study in the years of 1982 and 1993, respec‑ tively9,10.Both cohorts were monitored at diferent times9. In the years of 2004 and 2005
(cohort from 1982, participants aged 22 years) and 2008 (cohort from 1993, participants aged 15 years), all participants located were visited in their households and an FFQ, among other instruments, was applied by the interviewer. Additional information on the methods applied in such cohort studies may be found in other publications9,11‑13. Between 2011 and
ETHICAL ASPECTS
All the monitoring of birth cohorts in Pelotas was approved by the Ethics Committee of the School of Medicine of the Federal University of Pelotas. Since this article contemplates only the creation of the FFQ used in these follow‑ups, it was not submitted to this committee.
RESULTS
EVOLUTION OF THE USE OF THE FFQ IN THE COHORTS OF PELOTAS
An FFQ was applied for the irst time, in the birth cohorts of Pelotas, in 2004 and 2005, during the follow‑up of the members of the cohort of 1982, when they were 22 years of age. This questionnaire was based on the list of foods included in the instrument proposed by Sichieri14, adding the frequency of consumption of other foods of regional habits.
The FFQ used had a quantitative component (consisting of 70 foods) and a qualitative one (consisting of 15 food items) (Table 1). The recall period of this questionnaire com‑ prised the 12 months previous to the interview, in order to capture the seasonal variation of the available foods. For each food item in the quantitative component, the participants were asked about the frequency of consumption and the amount consumed, considering that the frequency of consumption was collected openly. Thus, if the individuals would report con‑ suming a given food, two questions would be asked in the sequence: “How many times?” (possible answers vary from zero to ten) and “How often?” (possible answers: day, week, month, or year). Regarding the quantities consumed, they were collected in household mea‑ sures through the following question: “How many (...) do you eat/a time?”. The (...) was replaced by the household measure u corresponding to each food (example: “how many spoons full of Rice do you eat/a time?”) (Table 2).
In 2008, during the follow‑up of the 15 years of age of the cohort of 1993, a FFQ was once again applied (Table 3). This questionnaire was based on the one previously applied to the participants of the cohort from 1982 at age 22. However, the FFQ became qualitative (without the size of the portion consumed) and consisted of 81 foods (Table 1). Diferences in relation to the one applied in the cohort from 1982 in 2004 and 2005 were as follows:
• Does not include foods such as stew steak, fried chicken, bacon, corn, peppers, cream cheese, butter or margarine, Orange juice, and lemonade
• Includes chips, milk (whole and low‑fat/skimmed), meat on the bone, soft drinks (regular and light), and artiicial juices
DESIGN OF A DIGITAL AND SELF-REPORTED FOOD FREQUENCY QUESTIONNAIRE TO ESTIMATE FOOD CONSUMPTION IN ADOLESCENTS AND YOUNG ADULTS: BIRTH COHORTS AT PELOTAS, RIO GRANDE DO SUL, BRAZIL
Cohort
Follow-up Quantitative FFQ Qualitative FFQ
1982 (2004-2005)
rice, beans, pasta, manioc lour, bread, homemade bread, bread made with whole wheat lour or rye, sweet or stufed cookies, crackers, cake, polenta, French fries, baked potato, cassava, popcorn, lentils/ peas/garbanzo beans, lettuce, kale, cabbage, orange or bergamot, banana, papaya, apple, watermelon or melon, pineapple, avocado, mango, strawberry, grape, peach, guava, pear, tomato, chayote, pumpkin, natural cucumber, green beans, carrots, beets, caulilower,
eggs, milk, yogurt, queijo, steak, pork, chicken, fresh ish, shrimp, bauru or cheeseburger, stewed steak, hot dog sausage or sausage,
hot dog, pizza, mayonnaise, inger food (kibe, pastel, empada), ice cream, sugar, candies, chocolate powder or Nescau, chocolate bar or goody, pudding or sweets, sot drinks, cofee, orange juice, lemonade,
fruit juice, beer, wine, cachaça/ whiskey/ vodka
corn, peppers, cream cheese, butter or margarine, ofal (kidney, liver, heart, gizzard, mondongo), fried chicken, canned ish (sardines
or tuna), bacon, garlic, onion, salt-preserved meats (beef jerky, cod), canned food (peas, olives, palm), cold cuts (cakegna, salami,
ham), barbecue, mate/chimarrão
1993 (2008)
rice, beans, pasta, manioc lour, bread branco, homemade bread, whole wheat bread, sweet or stufed cookies, crackers, cake, polenta, chips/inger food, French fries or chips, baked potato, cassava, popcorn, lentils/peas/garbanzo beans, lettuce, kale, cabbage, orange or bergamot, banana, papaya, apple, watermelon
or melon, pineapple, avocado, mango, strawberry, grape, peach, guava, pear, tomato, chuchu, pumpkin, natural cucumber, green beans, carrots, beets, caulilower, eggs, milk, low fat milk, yogurt,
cheese, boneless meat (steak, roast beef, stew, etc), meat on the bone (ribs, palette, etc), pork, chicken, fresh ish, shrimp, bauru
or cheeseburger, hot dog sausage or sausage, hot dog, pizza, mayonnaise, inger food (kibe, pastel, empada), ice cream, sugar,
candies, chocolate powder or Nescau, chocolate bar or goody, pudding or sweets, regular sot drinks, light sot drinks, cofee, fruit juice, artiicial juices, beer, wine, other alcoholic drinks, garlic,
onion, ofal (kidney, liver, heart, gizzard, mondongo), canned ish (sardines or tuna), salt preserved meats (beef jerky, cod), canned
food (peas, olives, palm), barbecue, mate/chimarrão
Table 1. Food items that made up the food frequency questionnaire in the diferent follow-ups in the birth cohorts of 1982 and 1993 in
Pelotas (RS).
Cohort
Follow-up Quantitative FFQ Qualitative FFQ
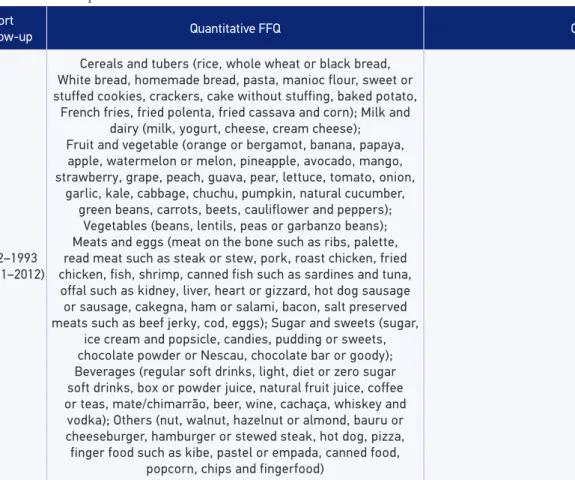
1982–1993 (2011–2012)
Cereals and tubers (rice, whole wheat or black bread, White bread, homemade bread, pasta, manioc flour, sweet or stuffed cookies, crackers, cake without stuffing, baked potato,
French fries, fried polenta, fried cassava and corn); Milk and dairy (milk, yogurt, cheese, cream cheese); Fruit and vegetable (orange or bergamot, banana, papaya,
apple, watermelon or melon, pineapple, avocado, mango, strawberry, grape, peach, guava, pear, lettuce, tomato, onion,
garlic, kale, cabbage, chuchu, pumpkin, natural cucumber, green beans, carrots, beets, cauliflower and peppers);
Vegetables (beans, lentils, peas or garbanzo beans); Meats and eggs (meat on the bone such as ribs, palette, read meat such as steak or stew, pork, roast chicken, fried chicken, fish, shrimp, canned fish such as sardines and tuna, offal such as kidney, liver, heart or gizzard, hot dog sausage
or sausage, cakegna, ham or salami, bacon, salt preserved meats such as beef jerky, cod, eggs); Sugar and sweets (sugar,
ice cream and popsicle, candies, pudding or sweets, chocolate powder or Nescau, chocolate bar or goody); Beverages (regular soft drinks, light, diet or zero sugar soft drinks, box or powder juice, natural fruit juice, coffee or teas, mate/chimarrão, beer, wine, cachaça, whiskey and
vodka); Others (nut, walnut, hazelnut or almond, bauru or cheeseburger, hamburger or stewed steak, hot dog, pizza, finger food such as kibe, pastel or empada, canned food,
popcorn, chips and fingerfood)
FFQ: food frequency questionnaire.
DESIGN OF A DIGITAL AND SELF-REPORTED FOOD FREQUENCY QUESTIONNAIRE TO ESTIMATE FOOD CONSUMPTION IN ADOLESCENTS AND YOUNG ADULTS: BIRTH COHORTS AT PELOTAS, RIO GRANDE DO SUL, BRAZIL
“How many times?” (possible answers vary from zero to ten) and “How often?” (possible answers: day, week, month, or year).
From these two questionnaires, a new FFQ was built to be used in the monitoring of the 18 years of the birth cohort of 1993 (carried out in 2011) and the 30 years of the cohort of 1982 (carried out in 2012). The process of putting together this semiquantitative, digital, and self‑administered FFQ is described next.
DEVELOPMENT OF THE SELF-ADMINISTERED DIGITAL FFQ
The new FFQ was developed with the help of the I9 company (http://www.i9naweb. com.br/), which was responsible for the creation of the digital format of the instrument. The whole application was processed by a server and the data were collected by the browser of any computer connected to this server’s network. The data were immediately saved in
Do you eat...? A. How many times? B. Per? C. How many... do you eat/a time?
13. Rice N 1 2 3 4 5 6 7 8 9 10 D S M A full soup spoon
14. Beans N 1 2 3 4 5 6 7 8 9 10 D S M A Scoop
15. Pasta N 1 2 3 4 5 6 7 8 9 10 D S M A Gripper
16. Manioc lour N 1 2 3 4 5 6 7 8 9 10 D S M A Spoon
17. Bread N 1 2 3 4 5 6 7 8 9 10 D S M A French or 2 slices
18. Homemade Bread N 1 2 3 4 5 6 7 8 9 10 D S M A Slice
19. Whole wheat or rye Bread N 1 2 3 4 5 6 7 8 9 10 D S M A Slice
20. Bocookies or stufed cookies N 1 2 3 4 5 6 7 8 9 10 D S M A Unit
21. Crackers N 1 2 3 4 5 6 7 8 9 10 D S M A Unit
22. Cake N 1 2 3 4 5 6 7 8 9 10 D S M A Slice
23. Polenta N 1 2 3 4 5 6 7 8 9 10 D S M A Piece
24. Frech fries N 1 2 3 4 5 6 7 8 9 10 D S M A Porção
25. Backed potato N 1 2 3 4 5 6 7 8 9 10 D S M A Unit
26. Cassava N 1 2 3 4 5 6 7 8 9 10 D S M A Piece
27. Popcorn N 1 2 3 4 5 6 7 8 9 10 D S M A Bag
28. Lentils, peas, garbanzo beans N 1 2 3 4 5 6 7 8 9 10 D S M A Spoon
Table 2. Food Frequency Questionnaire (quantitative component) applied to the participants of the birth cohort from 1982 during the follow-up of the 23 years of age. Pelotas (RS), 2004
the database installed in the server and, later on, the information was exported by the soft‑ ware itself, in Excel spreadsheets, which allows its conversion into the formats required for the analysis in diferent statistical packages, such as the Stata, SPSS, and SAS. The FFQ may be used online, with direct transference of data into the server, or of‑line, with the storage of the data in the computer it is installed in.
This FFQ included all foods which made up the questionnaire previously used by both cohorts and a question about the consumption of nuts, walnuts, almonds and hazelnuts was introduced (Table 1). Thus, such instrument consisted of 88 food items distributed into 9 food groups: cereals and tubers; milk and dairy; fruit and vegetables; legumes; meat and eggs; fats;
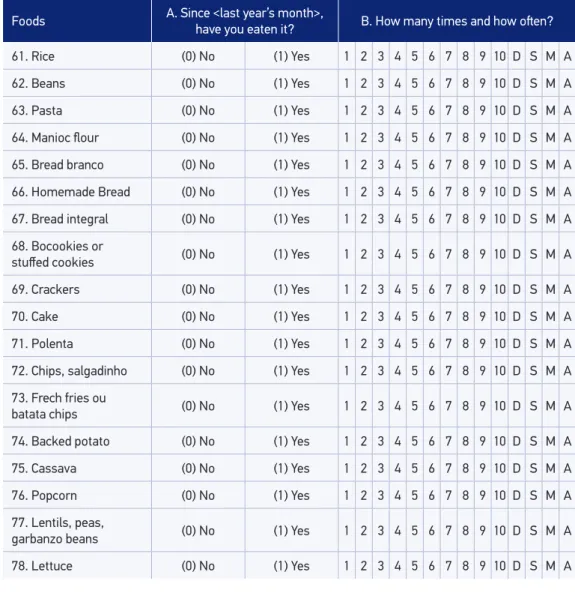
Foods A. Since <last year’s month>, have you eaten it? B. How many times and how oten?
61. Rice (0) No (1) Yes 1 2 3 4 5 6 7 8 9 10 D S M A
62. Beans (0) No (1) Yes 1 2 3 4 5 6 7 8 9 10 D S M A
63. Pasta (0) No (1) Yes 1 2 3 4 5 6 7 8 9 10 D S M A
64. Manioc lour (0) No (1) Yes 1 2 3 4 5 6 7 8 9 10 D S M A
65. Bread branco (0) No (1) Yes 1 2 3 4 5 6 7 8 9 10 D S M A
66. Homemade Bread (0) No (1) Yes 1 2 3 4 5 6 7 8 9 10 D S M A
67. Bread integral (0) No (1) Yes 1 2 3 4 5 6 7 8 9 10 D S M A
68. Bocookies or
stufed cookies (0) No (1) Yes 1 2 3 4 5 6 7 8 9 10 D S M A
69. Crackers (0) No (1) Yes 1 2 3 4 5 6 7 8 9 10 D S M A
70. Cake (0) No (1) Yes 1 2 3 4 5 6 7 8 9 10 D S M A
71. Polenta (0) No (1) Yes 1 2 3 4 5 6 7 8 9 10 D S M A
72. Chips, salgadinho (0) No (1) Yes 1 2 3 4 5 6 7 8 9 10 D S M A
73. Frech fries ou
batata chips (0) No (1) Yes 1 2 3 4 5 6 7 8 9 10 D S M A
74. Backed potato (0) No (1) Yes 1 2 3 4 5 6 7 8 9 10 D S M A
75. Cassava (0) No (1) Yes 1 2 3 4 5 6 7 8 9 10 D S M A
76. Popcorn (0) No (1) Yes 1 2 3 4 5 6 7 8 9 10 D S M A
77. Lentils, peas,
garbanzo beans (0) No (1) Yes 1 2 3 4 5 6 7 8 9 10 D S M A
78. Lettuce (0) No (1) Yes 1 2 3 4 5 6 7 8 9 10 D S M A
DESIGN OF A DIGITAL AND SELF-REPORTED FOOD FREQUENCY QUESTIONNAIRE TO ESTIMATE FOOD CONSUMPTION IN ADOLESCENTS AND YOUNG ADULTS: BIRTH COHORTS AT PELOTAS, RIO GRANDE DO SUL, BRAZIL
sugar and candies; drinks; others. For each food item, the participants were asked about their frequency of consumption and the quantities consumed. Eight options of answers for the fre‑ quency of consumption were used: never or < 1 time/month; 1 – 3 times/month; 1 time/week; 2 – 4 times/week; 5 – 6 times/week; 1 time/day; 2 – 4 times/day; ≥ 5 times/day. In order to obtain the data regarding the quantities consumed, a mean serving for each food was deined, considering that the respondent should inform whether having consumed each time an equal, larger, or smaller amount in relation to the mean serving. In order to deine the mean serving, the data from three 24HR was applied in a substudy conducted in 200615 with 185 adolescents in
the cohort of 1993, aged 13 years at the time. Some foods were grouped by type and nutritional composition (e.g., crystal sugar and reined sugar were classiied as sugar). For each food, we calculated the mean quantity (in grams or milliliters) consumed a day, obtained from the three 24HR. Thereafter, for each food item, the mean serving was deined as equivalent to the 50th
percentile (median) of the distribution. In order to determine the household measure regard‑ ing the mean portion, the Table for Food Consumption Evaluation in Household Measures (Tabela para Avaliação de Consumo Alimentar em Medidas Caseiras) was used16. Foods that were
not in the 24HR, such as mate (chimarrão), beer, wine, cachaça/whiskey/vodka and nuts, had their mean servings decided in a consensus by the authors themselves, based on usual house‑ hold measures and regional habits. In order to facilitate the understanding and the decision making of the respondents, the mean servings equivalent to each food were photographed in the Gastronomy Laboratory of the Federal University of Pelotas, the food being prepared according to the habits of the region, being subsequently inserted in the electronic FFQ.
LAYOUT OF THE FOOD FREQUENCY QUESTIONNAIRE
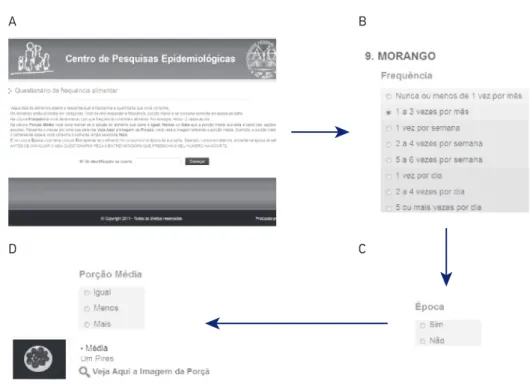
The new FFQ presents two parts: an initial page and the questionnaire itself. The initial page of the digital FFQ contains instructions on how to ill out the questionnaire, in addi‑ tion to a ield for registration number of identiication of the interviewee, which could be done manually or by means of a codebar reader (Figure 1A).
After the identiication of the user, through the FFQ itself, there is a screening for each kind of food. Besides, there are three diferent columns for each food. The irst column refers to the frequency of consumption (Figure 1B); the second one asks about the time of consumption (only for those foods that have a deined production season — watermelon or melon, pineapple, avo‑ cado, mango, strawberry, grape, peach, guava, pear, ice cream, and shrimp) (Figure 1C), while the third one refers to the size of the serving consumed (equal, smaller, and larger) (Figure 1D). In order to analyze the macro‑ and micronutrients, the “equal” portion must correspond to the mean serving, the “smaller” portion corresponds to half of the mean serving, and the “larger” portion to one and a half times the mean serving. These values were deined by the researchers.
detect the presence of incoherent answers that, for some reason, went unnoticed in the appli‑ cation process. Other iles in the same format convert the measures of portions referring to the household measures presented in the questionnaire by the mean servings or by the options of larger (1.5 times the mean serving) or smaller (half the mean serving) serving for grams of food. After this process, command routines of the statistical package Stata convert the quantity of each food into grams and milligrams of macro‑ and micronutrients, according to the Brazilian Table of Food Composition (Tabela Brasileira de Composição de Alimentos)17 or to
the United States Department of Agriculture table18,for food not present in the irst one18.
These routines and the scripts used may be requested to the authors of this study.
TESTING OF THE FOOD FREQUENCY QUESTIONNAIRE
The test of the new instrument was developed with adolescents and adults who do not belong to the two birth cohorts. The participants received an initial orientation on how to access and ill out the questionnaire.
A B
D C
DESIGN OF A DIGITAL AND SELF-REPORTED FOOD FREQUENCY QUESTIONNAIRE TO ESTIMATE FOOD CONSUMPTION IN ADOLESCENTS AND YOUNG ADULTS: BIRTH COHORTS AT PELOTAS, RIO GRANDE DO SUL, BRAZIL
DISCUSSION
The present study aimed at reporting the creation of a semiquantitative, self‑adminis‑ tered, and digital FFQ. The questionnaire was developed considering advances in researches in the ield of nutritional epidemiology regarding the new foods incorporated, such as nuts, walnuts, and hazelnuts, and also regarding the grouping of the questions on frequency and servings1,19.
The tests with the instrument had fully favorable results. Initially, the tests were per‑ formed in paper; later on, after the initial adjustments of the instructions, tests were made with the digital version. The mean time to ill out the FFQ in the digital versions was 12 min‑ utes and there was no diiculty in understanding the way it should be illed out. Some anal‑ ysis was performed, with the objective of verifying whether some answers of the FFQ were systematically diferent from others. For example, it was attempted to verify whether there was repetition of the same frequency of consumption for the foods listed in the question‑ naire, which could happen by fatigue of the interviewed. However, no problems of this nature were observed.
The possible sources of mistake in FFQ may result from the inadequate list of foods or the estimates of portions and usual frequencies1,3.The items included in the instrument at
matter were chosen based on the 24HR and the consumption frequencies from the FFQ previously applied to the cohorts of Pelotas, and, this way relect the foods and preparations usually consumed by this population. As for the usual frequencies chosen, other studies, such as the European Prospective Investigation into Cancer and Nutrition (EPIC)20,also use
grouped frequencies, which facilitate self‑admnitration1. The FFQ proposed for the cohorts
in Pelotas from 1982 and 1993 took into consideration the proposal of categorization of the frequencies pointed out by Willett1,with some modiications, such as the insertion of the
category of consumption of ive or more times a day, in order to facilitate the evaluation of adequacy of the daily intake of fruit and vegetable.
In relation to the estimates of portions, the consensus is that there is a challenge inher‑ ent to this choice for diferent types of foods and preparations1,3.In the irst FFQ applied
The strategy of use of images is not new, considering that, in the last two decades, stud‑ ies point out to the beneits of the use of photographs to help individuals and estimate the size of the portion they consume21‑23. A study published over 2 decades ago22 showed that
more than 50% of the evaluations of the size of servings were under‑ or overestimated when photographs of the mean serving were not used, while another study found that the use of photographs improved agreement between the quantitative FFQ and the food records with weighing23.
The digital version of the FFQ has some challenges, characteristics, and limitations similar to the FFQs developed on paper. Among which we may mention the dependence on the memory of the interviewed for the reporting of their diet and the low sensitivity for the evaluation of consumption of speciic nutrients24,25.Despite that, the FFQs are good
instruments for the evaluation of eating habits and also to estimate the intake of nutrients that have high variability in daily intake1,3.
The FFQ developed for the birth cohorts of Pelotas was created with the objective of meeting the needs of these current follow‑up studies. The use of this version of the instru‑ ment facilitated the reading and understanding of the questions, a fact that possibly reduced an important common bias in dietary surveys, related to the overestimate consumption of foods considered healthier26, once that, when asked by someone else, the respondents tend
to report what they are expected to eat, rather than what they actually eat.
Another advantage of the digital version regards the fast input of the data, which facili‑ tates the execution of analysis of consistency and eliminates the need for double entry of the data4,27. Moreover, the mean execution time of 12 minutes suggests that the digital instru‑
ment may shorten the time needed for the collection of dietary data. Besides, this survey may be easily used in household interviews, as long as the interviewer has a laptop computer. This instrument was developed so that the experience of answering an extensive and monotonous questionnaire, such as the FFQ, is faster, more pleasurable, and also facilitates data input. In the future, it is also intended to provide the information of dietary intake to the respondent immediately after the questionnaire.
CONCLUSIONS
This article, for being purely methodological, did not aim at providing information about the validation of the FFQ created. This is justiied by the fact that the FFQ should be created according to the regional habits, so that they collect reliable data on the diet of the individuals. From its creation, validation studies should be conducted in order to verify their reliability and validity.
DESIGN OF A DIGITAL AND SELF-REPORTED FOOD FREQUENCY QUESTIONNAIRE TO ESTIMATE FOOD CONSUMPTION IN ADOLESCENTS AND YOUNG ADULTS: BIRTH COHORTS AT PELOTAS, RIO GRANDE DO SUL, BRAZIL
Our evaluation of the process we described is that the use of this technological resource and the images of the mean servings, with the option to inform whether the serving con‑ sumed was an equal, larger, or smaller portion, was attractive both to the participants and to the work teams, making the instrument pleasant and facilitating its use, by allowing it to be self‑administered, answered to in a short period and immediately available for data anal‑ ysis. Considering the positive experience, the use of this same strategy for other research groups is recommended in Brazil, adapting it to diferent contexts and situations.
1. Willett WC. Nutritional epidemiology issues in chronic disease at the turn of the century. Epidemiol Rev 2000; 22(1): 82‑6.
2. Willett W. Foreword. The validity of dietary assessment methods for use in epidemiologic studies. Br J Nutr 2009; 102 Suppl 1: S1‑2.
3. Thompson FE, Byers T. Dietary assessment resource manual. J Nutr 1994; 124(11 Suppl): 2245S‑317S.
4. Winter J, Boushey CJ. Work shop 1: Use of technolog y in dietary assessment. Eur J Clin Nutr 2009: 63 Suppl 1: S75‑7.
5. Long JD, Littleield LA, Estep G, Martin H, Rogers TJ, Boswell C, et al. Evidence review of technology and dietary assessment. Worldviews Evid Based Nurs 2010; 7(4): 191‑204.
6. Falomir Z, Arregui M, Madueno F, Corella D, Coltell O. Automation of Food Questionnaires in Medical Studies: A state‑of‑the‑art review and future prospects. Comput Biol Med 2012; 42(10): 964‑74.
7. Ngo J, Engelen A, Molag M, Roesle J, Garcia‑Segovia P, Serra‑Majem L. A review of the use of information and communication technologies for dietary assessment. Br J Nutr 2009;101 Suppl 2:S102‑12.
8. Illner AK, Freisling H, Boeing H, Huybrechts I, Crispim SP, Slimani N. Review and evaluation of innovative technologies for measuring diet in nutritional epidemiology. Int J Epidemiol 2012; 41(4): 1187‑203.
9. Barros FC, Victora CG, Horta BL, Gigante DP. Methodology of the Pelotas birth cohort study from 1982 to 2004‑5, Southern Brazil. Rev Saúde Pública 2008; 42 Suppl 2: 7‑15.
10. Victora CG, Araujo CL, Menezes AM, Hallal PC, Vieira Mde F, Neutzling MB, et al. Methodological aspects of the 1993 Pelotas (Brazil) Birth Cohort Study. Rev Saúde Pública 2006; 40(1): 39‑46.
11. Victora CG, Barros FC. Cohort proile: the 1982 Pelotas (Brazil) birth cohort study. Int J Epidemiol 2006; 35(2): 237‑42.
12. Victora CG, Hallal PC, Araujo CL, Menezes AM, Wells JC, Barros FC. Cohort proile: the 1993 Pelotas (Brazil) birth cohort study. Int J Epidemiol 2008; 37(4): 704‑9.
13. Araujo CL, Menezes AM, Vieira Mde F, Neutzling MB, Goncalves H, Anselmi L, et al. The 11‑year follow‑up of the 1993 Pelotas (Brazil) birth cohort study: methods. Cad Saúde Pública 2010; 26(10): 1875‑86.
14. Sichieri R, Everhart JE. Validity of a Brazilian food frequency questionnaire against dietary recalls and estimated energy intake. Nutr Res 1998; 18: 1649‑59.
15. Gigante DP, Reichert FF, Hallal PC, Souza RV, Neutzling MB, Vieira Mde F, et al. Dietary assessment in the 1993 Pelotas (Brazil) birth cohort study: comparing energy intake with energy expenditure. Cad Saude Publica 2010; 26(11): 2080‑9.
16. Pinheiro ABV. Tabela para avaliação do consumo alimentar em medidas caseiras. 5ª ed. Rio de Janeiro: Atheneu; 2004.
17. Universidade Estadual de Campinas (UNICAMP). Tabela Brasileira de Composição de Alimentos ‑ TACO. Versão 2. 2ª ed. Campinas: UNICAMP; 2006.
18. United States Department of Agriculture ‑ USDA. Nutrient Database for Standard Reference ‑ SR14. Washington DC: United States Department of Agriculture; 2011. Disponível em: < http://ndb.nal.usda.gov/ndb/foods>. (Acessado em 08 de janeiro de 2016).
19. Li TY, Brennan AM, Wedick NM, Mantzoros C, Rifai N, Hu FB. Regular consumption of nuts is associated with a lower risk of cardiovascular disease in women with type 2 diabetes. J Nutr 2009; 139(7): 1333‑8.
21. Faggiano F, Vineis P, Cravanzola D, Pisani P, Xompero G, Riboli E, et al. Validation of a method for the estimation of food portion size. Epidemiology (Cambridge, Mass) 1992; 3(4): 379‑82.
22. Guthrie HA. Selection and quantiication of typical food portions by young adults. J Am Diet Assoc 1984; 84(12): 1440‑4.
23. Pietinen P, Hartman AM, Haapa E, Rasanen L, Haapakoski J, Palmgren J, et al. Reproducibility and validity of dietary assessment instruments. I. A self‑administered food use questionnaire with a portion size picture booklet. Am J Epidemiol 1988; 128(3): 655‑66.
24. Cade J, Thompson R, Burley V, Warm D. Development, validation and utilisation of food‑frequency questionnaires ‑ a review. Public Health Nutr 2002; 5(4): 567‑87.
25. Cade JE, Burley VJ, Warm DL, Thompson RL, Margetts BM. Food‑frequency questionnaires: a review of their design, validation and utilisation. Nutr Res Rev 2004; 17(1): 5‑22.
26. Kipnis V, Midthune D, Freedman LS, Bingham S, Schatzkin A, Subar A, et al. Empirical evidence of correlated biases in dietary assessment instruments and its implications. Am J Epidemiol 2001; 153(4): 394‑403.
27. Garcia‑Segovia P, Gonzalez‑Car r ascosa R, Martinez‑Monzo J, Ngo J, Serra‑Majem L. New technologies applied to food frequency questionnaires: a current perspective. Nutr Hosp 2011; 26(4): 803‑6.
Received on: 06/10/2014