DOI: http://dx.doi.org/10.5007/1980-0037.2017v19n3p261
Validation of the Subjective Vitality Scale and
study of the vitality of elderly people according
to their physical activity
Validação da Subjective Vitality Scale e estudo da
vitalidade nos idosos em função da sua atividade física
Nuno Couto1
Raul Antunes1
Diogo Monteiro1,3
João Moutão1,3
Daniel Marinho2,3
Luís Cid1,3
Abstract – he main aim of the study was to validate the Portuguese version of the Subjec-tive Vitality Scale - SVS for the Portuguese elderly population through of conirmatory factorial analysis. he existence of diferences in the perception of subjective vitality among suiciently active and insuiciently active older adults was also analyzed. A total of 309 Portuguese elderly (242 females, 67 males) aged 60-90 years (M = 68.59, SD = 6.60) participated in this study. Of the total sample, 256 are suiciently active, while 53 are insuiciently active. he results show that the model was adjusted to data in a satisfactory way (χ² = 28.95; df = 9; CFI = .97; TLI = .94; SRMR = .04; RMSEA = .08; RMSEA 90% CI = .05 - .12), and show a concurrent validity with the Portuguese version of the Satisfaction with Life Scale. he data obtained allow us concluding that the Portuguese version of the Subjective Vitality Scale can be used as a measure of subjective vitality in the Portuguese elderly population. It was also veriied that the subjective perception of vitality is greater among individuals suiciently active compared with their peers that do not reach the amount of practice of recommended physical activity.
Key words: Elderly; Factor analysis; Motor activity; Quality of Life.
Resumo – O objetivo do estudo foi validar a versão portuguesa da Subjetive Vitality Scale - SVS para a população idosa portuguesa com recurso a uma análise fatorial conirmatória. Foi ainda analisada a existência de diferenças na perceção de vitalidade subjetiva entre idosos suicientemente ativos e insuicientemente ativos. Participaram neste estudo 309 idosos (242 sexo feminino, 67 sexo masculino) de nacionalidade portuguesa, com idades compreendidas entre os 60 e os 90 anos (M= 68.59; DP = 6.60). Do total da amostra, 256 são suicientemente ativos e 53 são insuicientemente ativos. Os resultados alcançados revelam que o modelo apresenta valores
satisfatórios de ajustamento aos dados (χ² = 28.95; df = 9; CFI = .97; TLI = .94; SRMR = .04;
RMSEA = .08; RMSEA 90% CI = .05 - .12). Foi, também, obtida validade concorrente com a versão portuguesa da Escala de Satisfação com a Vida. Os dados obtidos permitem concluir que a versão portuguesa da SVS pode ser utilizada como medida de avaliação de vitalidade subjetiva na população idosa portuguesa. Veriicou-se ainda, que a percepção subjetiva de vitalidade é maior entre os idosos suicientemente ativos comparados com seus pares que não atingem a quantidade
1 Sport Science School of Rio Maior (ESDRM-IPSantarém). Portugal.
2 University of Beira Interior (UBI). Portugal.
3 Research Center in Sport, Health and Human Development (CIDESD). Portugal.
Validation of Subjective Vitality Scale in elderly Couto et al.
INTRODUCTION
An increase in the elderly population has been recently veriied, and by 2050, this population is expected to reach triple the number of people
compared to 20101. In this context, well-being has been an important area
of study2, since people, in addition to prefer to live longer, also want to do
it with more quality of life3.
hus, subjective vitality, deined as a conscious experience of energy and
vivacity4, is considered as part of the eudaimonic perspective of well-being,
since the sensations of possession of energy and vitality are characteristics
of perfect health5, relecting an organismic state, as it can be afected by
psychological and somatic factors4.
herefore, pathological conditions that may deplete personal energy
are conducive to diminishing subjective vitality4, in which the maintenance
of physical capacity and social activity can delay the natural physical and
cognitive decline associated with advancing age6. In fact, in an investigation
on well-being in an elderly population, Kasser and Ryan7 conirmed the
existence of negative and signiicant correlations between vitality, anxiety and depression and, on the other hand, positive and signiicant correlations between this and the perception of health and general well-being.
hus, the practice of physical activity seems to be fundamental for this population, since individuals associated with regular physical activity programs can live longer and with higher quality of life, being important in the maintenance of their daily activities, as well as in the prevention of
diseases that occur with aging3. his corroborate the indings in literature,
where, in general, there seems to be a positive relation between physical
ac-tivity and the great majority of well-being components, including vitality9.
Subjective vitality has been assessed through the Subjective
Vital-ity Scale (SVS)4. Initially, this instrument was composed of 19 items;
however, after an exploratory analysis, the authors eliminated 3 items, being reduced to 16 items. Still in the exploratory phase, the items were grouped in two factors: objectives / life purpose and vitality. Taking into account the initial aim of the study, assessing subjective vitality, Ryan and
Frederick4 considered that only the 7 items associated with vitality factor
as inal version of the scale.
In order to verify the psychometric qualities of the scale through a
conirmatory factor analysis, Bostic et al.10 demonstrated that there was
adjustment of the SVS model (i.e., 1 factor / 7 items); however, this would improve if item 2 was eliminated. his item is constructed with a negative semantic structure (I don’t feel very energetic) and obtained a very poor factorial weight (.14), reason why the authors suggest that the scale with a 6-item structure should be used.
he SVS reduced version (i.e., 1 factor / 6 items) has been the most
commonly used self-report measure for assessing subjective vitality11 in
all age groups: youngsters11, adults12, and in the elderly2; and in several
of Portuguese adults practicing physical exercise, and a very satisfactory adjustment of the model to data was veriied. In this study, an excellent
internal consistency of the scale (α =, 91), as well as concurrent validity
between subjective vitality and another dimension of well-being (satisfac-tion with life) was also veriied.
hus, in order to guarantee the validity and reliability of the Portuguese version of the SVS, when used in an elderly population, we propose as a main aim of this study to evaluate the scale measurement model through a conirmatory factor analysis in a sample of elderly people. Even if adapted to Portuguese through a sample where Portuguese elderly people were already included, the mean age of the sample of 32.70 ± 12.29 years gives us the indication of a reduced number of elderly subjects, so it becomes pertinent validation with a sample consisting exclusively of older adults.
Nevertheless, we intend to analyze for this population, in what way subjective vitality is diferentiated as a function of individuals being or not suiciently active.
METHODOLOGICAL PROCEDURES
Participants
A total of 309 Portuguese elderly subjects (242 female, 67 male) enrolled in senior universities and day centers (none of them were institutional-ized), living in Ribatejo and western Portugal, with ages between 60 and 90 years (M = 68.59, SD = 6.60). Of the total sample, 256 individuals are suiciently active and 53 are insuiciently active.
Instruments
Portuguese version of the Subjective Vitality Scale (SVS)14 - his
ques-tionnaire consists of 6 items that are answered on a seven-point Likert scale ranging from 1 “strongly disagree” to 7 “strongly agree.” he value is calculated through the average response of the subjects that determines a total value, and the higher the value obtained, the greater the perception of subjective vitality.
Portuguese version of the Satisfaction with Life Scale (SWLS)16 -
his questionnaire consists of 5 items that are answered on a seven-point Likert scale, ranging from 1 “strongly disagree” to 7 “strongly agree.” he value is calculated through the mean response of subjects that determines a total value, and the higher the value obtained, the higher the perception of satisfaction with life.
International Physical Activity Questionnaire (IPAQ )17 - his
self-report measure allows calculating the weekly energy expenditure of physi-cal activities related to work, transportation, household obligations and leisure activities carried out for at least 10 continuous minutes. According
Validation of Subjective Vitality Scale in elderly Couto et al.
consider suiciently active all those who perform moderate or vigorous physical activity for at least 150 minutes a week. All elderly people who have moderate or vigorous practice values of less than 150 minutes per week are considered to be insuiciently active.
Procedures
After the formal contacts with institutions, data were always collected in places and conditions similar to all the elements that participated in the study, being guaranteed the conditions so that they could be concentrated during the illing of the questionnaire. All participants agreed to be part of the study on a voluntary basis and informed consent was obtained, guar-anteeing the conidentiality and anonymity of data collected. his study is part of a study that was approved by the Ethics Committee of the Regional Health Administration of Lisbon and Vale do Tejo (ARSLVT), of the General Health Department (DGS), and a favorable opinion to conduct the study was issued: Protocol 129 / CES / INV / 2013 of the Ethics Committee.
Statistical analysis
Statistical analysis was performed according to recommendations of
sev-eral authors (Byrne18, Kline19, Kahn20, Hair et al.21), and the maximum
likelihood estimation (ML) method was used using the chi-square test
(χ²), degrees of freedom (df) and signiicance level (p). In addition, the
following adjustment quality indexes were used: Standardized Root Mean Square Residual (SRMR), Comparative Fit Index (CFI), Tucker-Lewis Index (TLI), Root Mean Square Error of Approximation (RMSEA). In the present study, for the above indexes, the cutof values suggested by Hu
and Bentler22 were used: SRMR ≤ .08, CFI and TLI ≥ .95; RMSEA ≤ .06
and the respective conidence interval (90% CI), although in the case of the incremental indexes (CFI and TLI), it is not necessary to generalize the cutof values of Hu and Bentler, and it is also advisable to weigh values
equal to or greater than .9023.
he theory underlying the ML estimation method (maximum
likeli-hood) assumes that data have normal multivariate distribution19, and it
is necessary to analyze data normality through the Mardia coeicient.
According to Byrne18, normalized Mardia coeicient higher than .50 is
indicative that data do not have normal multivariate distribution, a situa-tion that occurs with our sample (multivariate kurtosis: Mardia = 28.62, normalized Mardia = 25.76). For such situations, it is recommended to
use a ratio of 15:1 in order to be able to use the ML estimation method21.
he convergent validity was also analyzed (to verify if the items are related to the respective factor), by calculating the average variance extracted (AVE)
considering AEV ≥ 5021 and composite reliability (CF), In order to evaluate
the internal consistency of the factor, adopting as cutof values CF ≥ .7021.
Finally, in order to analyze the possible diferences in subjective vitality between active and sedentary subjects of our sample, the t-Student test was used, which allows studying how the means of two populations are
signiicantly diferent25. he analysis was performed using the IBM SPSS
AMOS 21 software21.
RESULTS
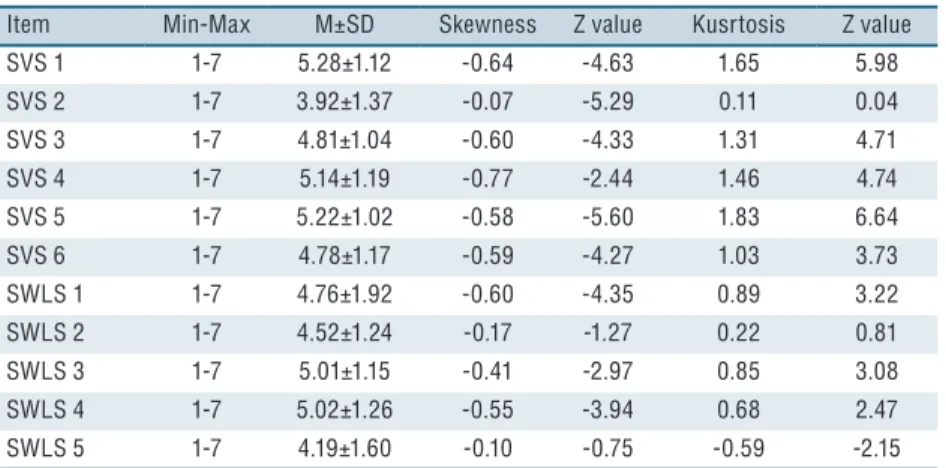
In relation to SVS (Table 1), it was veriied that all levels of response were used and it was veriied that item 1 (I feel “alive” and vital) obtained the highest mean response value 5.28. On the other hand, item 2 (Sometimes I am so alive I just want to burst) was the item with the lowest average response value 3.92. Regarding SWLS, it was also veriied that all response levels were used, observing that item 4 (So far I have gotten the important things I want in life) was the one that obtained the highest average response value (5.02). On the other hand, item 5 (If I could live my life over, I would change almost nothing) was the least valued among subjects, with an average response value of 4.19. hese mean response values in both scales are conirmed by the univariate non-normal distribution, which present a bias to the left, that is, subjects used the highest response levels for both scales, which is normal in questionnaires of this nature.
Table 1. Descriptive Analysis of Responses to Items SVS and SWLS
Item Min-Max M±SD Skewness Z value Kusrtosis Z value
SVS 1 1-7 5.28±1.12 -0.64 -4.63 1.65 5.98
SVS 2 1-7 3.92±1.37 -0.07 -5.29 0.11 0.04
SVS 3 1-7 4.81±1.04 -0.60 -4.33 1.31 4.71
SVS 4 1-7 5.14±1.19 -0.77 -2.44 1.46 4.74
SVS 5 1-7 5.22±1.02 -0.58 -5.60 1.83 6.64
SVS 6 1-7 4.78±1.17 -0.59 -4.27 1.03 3.73
SWLS 1 1-7 4.76±1.92 -0.60 -4.35 0.89 3.22
SWLS 2 1-7 4.52±1.24 -0.17 -1.27 0.22 0.81
SWLS 3 1-7 5.01±1.15 -0.41 -2.97 0.85 3.08
SWLS 4 1-7 5.02±1.26 -0.55 -3.94 0.68 2.47
SWLS 5 1-7 4.19±1.60 -0.10 -0.75 -0.59 -2.15
Note: Min-Max (Minimum and Maximum); M (Mean); SD (Standard Deviation); SVS (Subjective Vitality Scale); SWLS (Satisfaction With Life Scale).
Analysis of construct validity
By the analysis of table 2, it can be veriied that the SVS measurement model was adjusted to data according to cutof values adopted in the methodology,
being very close to values found by Moutão et al.14.
Validation of Subjective Vitality Scale in elderly Couto et al.
Table 2. Adjustment indices of the models tested.
Models χ² df CFI TLI SRMR RMSEA 90% CI
SVS* 34.93 9 .97 .96 ** .07 .05 - .10
1 28.95 9 .97 .94 .04 .08 .05 - .12
* Model SVS Moutão et al.,14; S-B χ² (Chi-square with Satorra-Bentler correction) ** (value not
reported by the authors); χ² (Chi-Square) df (degrees of freedom); SRMR (Standardized Root Mean Square Residual); TLI (Tucker-Lewis Index); CFI (Comparative Fit Index); Root Mean Squared Error of Approximation (RMSEA); 90% CI (Confidence Interval RMSEA)
Regarding internal consistency, the composite reliability value of .80
is higher than the cutof value of .70 suggested by Hair et al.21.
Figure 1. Standardized individual parameters of the initial SVS model
With regard to convergent validity, we have sought through AVE to conirm its existence. However, the value obtained for this indicator, as can be seen in table 3, is below the cutof value of .50, thus indicating limitations of convergent validity of the Portuguese version of the SVS for this population. Regarding the concurrent validity (table 3), its existence is veriied, since there was a positive and signiicant correlation (r = .46) among the well-being indicators studied.
Table 3. Composite reliability, convergent and concurrent validity
Items Min-Max M±SD CR AVE CV*
Vitality 1-7 23.52±5.14 .80 .40 .46**
Note: Min-Max (Minimum and Maximum); M (Mean); CR (Composite Reliability); AVE (Average Variance Extracted; CV (Concurrent Validity); * (Correlation with satisfaction factor with life); ** (Significant correlation p <.01)
df t p
M±SD M±SD
Subjective Vitality 4.91±.77 4.60±.89 307 2.85 .003*
Note: M (Mean); SD (Standard Deviation); df (Degrees of Freedom); t (test statistic); p (p-value); *(Significant p ≤ .01).
DISCUSSION
Taking into account the main purpose of the present study, to adapt and validate the Portuguese version of the SVS for the Portuguese elderly population, the model was adjusted to data, although not all cutof values
adopted in the methodology were achieved22, especially in the index
incre-mental TLI and in the absolute RMSEA index. However, some authors
(e.g., Byrne18, Hair et al.21 and Marsh et al.23) suggest that the cut-of
values of Hu and Bentler22 should not be generalized, under the risk of
failing to reject good models, thus suggesting acceptable values from 90 in the incremental indexes (i.e. CFI and TLI) and between 05 and 08 for absolute indexes (i.e. SRMR and RMSEA). It is also noteworthy that
these values are very close to the version of Moutão et al.14, from which
this instrument was adapted, evidencing, therefore, its psychometric ro-bustness in this age group.
As far as internal consistency is concerned, it was found that the com-posite reliability value obtained (.80) is higher than the suggested cutof value (.70), thus giving good evidence of the SVS reliability for this popu-lation. Similar results were found in studies of the original version of Bostic
et al.10, as well as of later validations14,15, demonstrating that the subjective
vitality factor measures the theoretical construct that it intends to measure. Concerning the convergent validity, there are slight problems, since the AVE value (.40) was lower than the value adopted in the methodology (i.e., AVE ≥ .50). However, all factorial weights are greater than or equal to .50
and signiicant in factor, which according to Hair et al.21, is indicative of
convergent validity. Moreover, by analyzing the modiication indexes, none of the items showed too high residual values, and this is also an indicator
of convergent validity18.
With respect to concurrent validity, it was found that the scale of subjective vitality correlated positively and signiicantly with another cognitive dimension of well-being, more precisely with satisfaction with
life, thus evidencing this type of validity. Kasser and Ryan7, in a study with
elderly people living in nursing homes also veriied this type of correlation between the two constructs, being also veriied in other contexts, such as
physical exercise14,15.
Validation of Subjective Vitality Scale in elderly Couto et al.
meeting the minimum recommendations for the practice of physical activity can efectively contribute to a greater perception of subjective vitality in
this population. his is corroborated in the work of Strijk et al.9, where the
authors concluded that physical activity can be used as a tool to increase the vitality of subjects.
In short, levels of subjective vitality are dependent on psychological
factors and physical function that is negatively inluenced by aging26.
In this sense, the practice of physical activity, as already veriied, plays
a fundamental role as it is seen as a means of promoting health27, being
fundamental in the maintenance of the daily activities of older adults3.
CONCLUSION
Based on the results found in the present study, it was concluded that the Portuguese version of the SVS (six items) presents satisfactory psychomet-ric qualities for the evaluation of subjective vitality in Portuguese seniors. he results of the factorial analysis conirm the it of the model with good internal consistency values, which are consistent with results reported by
Moutão et al 14. Finally, it is suggested the implementation of initiatives
and programs to promote physical activities to improve the perception of subjective vitality, since, suiciently active elderly present a better percep-tion of this variable, which is related to physical and mental well-being and consequently to health and quality of life.
REFERENCES
1. NIA. Global Health and Aging. Baltimore, MD: National Institute on Aging, U.S. Washington D.C: Department of Health & Human Services; 2011. 2. Visser P, Hirsch J, Brown K, Ryan R, Moynihan J. Components of sleep quality
as mediators of the relation between mindfulness and subjective vitality among older adults. Mindfulness 2014; 6(4): 723-731.
3. Rejeski W, Mihalko L. Physical Activity and Quality of Life in Older Adults. J Gerontol A Biol Sci Med Sci 2001; 56(2): 23-5.
4. Ryan R, Frederick C. (1997). On energy, personality, and health: Subjective vitality as a dynamic relection of well-being. J Pers 1997; 65(3): 529-65.
5. Ryan R, Deci E. From ego-depletion to vitality: heory and indings concern-ing the facilitation of energy available to the self. Soc Personal Psychol Compass 2008; 2(2): 702-717.
6. Hertzog C, Kramer A, Wilson R, Lindenberger U. Enrichment Efects on Adult Cognitive Development. Psychol Sci Public Interest 2008; 9(1): 1-65.
7. Kasser V, Ryan R.he relation of psychological needs for autonomy and related-ness to vitality, well-being, and mortality in a nursing home. J Appl Soc Psychol 1999; 29(5): 935-54.
8. Ekkekakis P, Backhouse H. Exercise and Psychological Well-Being. In: Maughan R. he Olympic textbook of science in sport. West Sussex: Wiley-Blackwell; 2009. 9. Strijk J, Proper K, Klaver L, Beek A, Mechelen W. Associations between VO2max
and vitality in older workers: a cross-sectional study. BMC Public Health 2010; 10, 684.
10. Bostic T, Rubio D, Mood M. A validation of the subjective vitality scale using structural equation modeling. Soc Indic Res 2000; 52(3): 313-24.
CORRESPONDING AUTHOR
Nuno Rafael Pedro do Couto Escola Superior de Desporto de Rio Maior
Instituto Politécnico de Santarém Av. Dr. Mário Soares 2040-413, Rio Maior, Portugal
E-mail: [email protected]
13. Taylor I, Lonsdale C. Cultural diferences in the relationships among autonomy support, psychological need satisfaction, subjective vitality, and efort in British and Chinese physical education. J Sport Exerc Psychol 2010; 32(5): 655-73. 14. Moutão J, Alves S, Cid L. Traducción y validación de la Subjetive Vitality scale en
una muestra de praticantes de ejercício portugueses. Rev Latinoam Psicol 2013; 45(2): 223-30.
15. Vlachopoulos S, Karavani E. Psychological needs and subjective vitality in exercise: a cross gender situational test of the needs universality hypothesis. Hell J Psychol 2009; 6(2): 207-22.
16. Neto F. he Satisfaction With Life Scale: Psychometrics properties in an adolescent sample. J Youth Adolesc 1993; 22(2): 125–134.
17. Mazo G, Benedetti T. Adaptação do questionário internacional de atividade física para idosos. Rev Bras Cineantropom Desempenho Hum 2010; 12(6): 480-4. 18. Byrne B. Structural Equation Modeling with AMOS. Basic Concepts,
Applica-tions, and Programming (2º ed.). New York: Taylor & Francis Group; 2010. 19. Kline R. Principles and practice of structural equation modeling (3º ed.). New
York: he Guilford Pres; 2011.
20. Kahn J. Factor analysis in counseling psychology. Research, trainning, and prac-tice: principles, advances and applications. Couns Psychol 2006; 34(5): 684-718. 21. Hair J, Black W, Babin B, Anderson R. Multivariate Data Analysis (7º ed.). New
Jersey: Pearson Educational Inc; 2014.
22. Hu L, Bentler P. Cut of criteria for it indexes in covariance structure analysis: conventional criteria versus new alternatives. Struct Equ Modeling 1999; 6(1): 1-55. 23. Marsh H, Hau, K, Wen Z. In search of golden rules: Comment on
hypothesistest-ing approaches to setthypothesistest-ing cutof values for it indexes and dangers in overgeneral-izing Hu and Bentler’s (1999) indings. Struct Equ Modeling 2004; 11(3): 320-41. 24. Gouveia V, Milfont T, Gouveia R, Medeiros E, Vione C, Soares A. Escala de
Vitalidade Subjetiva – ESV: Evidências da sua Adequação Psicométrica. Psic: Teor Pesq 2012; 28(1): 5-13.
25. Ho R. Handbook of univariate and multivariate data analysis with IBM SPSS. (2º ed.). New York: CRC Press; 2014.
26. Manini T, Pahor M. Physical activity and maintaining physical function in older adults. Br J Sports Med 2009; 43(1): 28-31.