© Institute of Chartered Foresters, 2011. All rights reserved. For Permissions, please email: journals.permissions@oup.com Forestry, Vol. 84, No. 2, 2011. doi:10.1093/forestry/cpr006
Advance Access publication date: 22 March 2011
Forestry
An International Journal of Forest Research
Introduction
Post-fire mortality has been studied using a variety of methods (e.g. Fowler and Sieg 2004; Sieg et al., 2006) that may be classified into two main groups. The first includes indirect approaches for prediction of tree mortality based on fire behaviour parameters. The second includes direct approaches based on the measurements of tree tissue injury (Keyser et al., 2006; Sieg et al., 2006). Indirect approaches require the use of fire behaviour simulators (e.g. Finney, 1998, 2006) which include models to calculate fire rate of spread (Rothermel, 1972; Albini, 1976; Rothermel and Rinehart 1983), fire shape (Anderson, 1983; Alexander, 1985), spot fire distance (Albini 1979, 1983) and crown fire spread rate (Van Wagner, 1977; Rothermel, 1991). However, these systems are seldom implemented in stand level simulators because information about weather
condi-tions in a specific fire ignition day, fuel moisture (e.g. 1- and 10-h fuel moisture contents) and fuel accumulation (e.g. shrubs growth, deadwood) are necessary and hard to pre-dict over long planning periods, e.g. 60 years (Rothermel, 1991; Finney, 1999; He and Mladenoff, 1999; González et al., 2007). On the other hand, direct approaches require measurements of tree tissue injury and fire intensity. These methods can be used for a variety of situations, e.g. setting acceptable upper and lower fuel moistures for con-ducting prescribed burns, determining number of hectares that may be burned on a given day and developing timber salvage guidelines following fire (Reinhardt, 1997). Yet direct methods are hardly practical in a forest management planning context as they require input data that are not available to forest managers when developing forest plans.
The usefulness of post-fire models in forest planning depends on the information these models may provide
A three-step approach to post-fire
mortality modelling in maritime pine
(Pinus pinaster Ait) stands for enhanced
forest planning in Portugal
J. GARCIA-GONZALO
1*, S. MARQUES
1, J. G. BORGES
1, B. BOTEQUIM
1,
M. M. OLIVEIRA
2, J. TOMÉ
1 andM. TOMÉ
11 Centro de Estudos Florestais, Instituto Superior de Agronomia, Universidade Técnica de Lisboa, Lisboa, Portugal 2 Centro de Investigação Matemática e Aplicações, Universidade de Évora, Évora, Portugal
*Corresponding author. E-mail: jordigarcia@isa.utl.pt
Summary
Maritime pine (Pinus pinaster Ait) is a very important timber-producing species in Portugal with a yield of ~67.1 million m3 year21. It covers ~22.6 per cent of the forest area (710.6 × 10³ ha). Fire is the most significant threat to maritime pine plantations. This paper discusses research aiming at the development of post-fire mortality models for P. pinaster Ait stands in Portugal that can be used for enhanced integration of forest and fire management planning activities. Post-fire mortality was modelled using biometric and fire data from 2005/2006 National Forest Inventory plots and other sample plots within 2006–2008 fire perimeters. A three-step modelling strategy based on logistic regression methods was used. Firstly, the probability of mortality to occur after a wildfire in a stand is predicted and secondly, the degree of mortality caused by a wildfire on stands where mortality occurs is quantified. Thirdly, mortality is distributed among trees. The models are based on easily measurable tree characteristics so that forest managers may predict post-fire mortality based on forest structure. The models show that relative mortality decreases when average d.b.h. increases, while slope and tree size diversity increase the mortality.
about the impact on mortality of variables whose future value may be estimated with reasonable accuracy and are under the control of forest managers through management (e.g. forest stand density, species composition, mean diam-eter). Many studies demonstrate the relationships between these variables and post-fire mortality (Pollet and Omi, 2002; Hély et al., 2003; McHugh and Kolb, 2003). Stand struc-ture is related to fire intensity (Fernandes, 2009), fire severity (Fernandes et al., 2010) and with damage/mortality (Agee and Skinner, 2005; González et al., 2007). The amount of shrubs biomass may further increase fire severity. However, information about the evolution of forest fuels and/or shrubs over planning periods longer than 5–10 years is limited.
Stand-level prescriptions provide the biological frame-work for fire activity and damage (Weaver, 1943; Agee and Skinner, 2005; Peterson et al., 2005; González et al., 2005, 2007). Management may thus effectively modify stand con-ditions to control expected levels of fire damage (Pollet and Omi, 2002; González et al., 2007; Fernandes et al., 2010). Thus, the use of post-fire models oriented to forest planning, i.e. using predictor variables controllable by the manager, may help anticipate the outcomes of different management alternatives, thus reducing uncertainty (Gadow, 2000). It also helps to identify management alternatives that reduce the expected losses due to fire.
Many studies have addressed fire effects on maritime pine (Pinus pinaster Ait) stands. Some of them concentrated on fire ecology (e.g. Fernandes and Rigolot, 2007) and fire behaviour (Fernandes et al., 2004). Other analysed the in-fluence of fire severity on the recruitment of maritime pine (e.g. Martínez et al., 2002; Fernández et al., 2008). Further studies have been focused on competition-induced mortality or drought-induced mortality (Martínez-Vilalta and Piñol, 2002). Botelho et al. (1996) and Botelho et al. (1998) pre-sented a mortality model for prescribed fires in maritime pine stands in Portugal. Basically, the existing mortality models have been mostly developed to serve as guidelines for timber salvage following fire or to be used for prescribed fires or to make post-fire management decisions (Botelho et al., 1996; Reinhardt, 1997; Rigolot, 2004; Sieg et al., 2006). Never-theless, the development and/or use of a post-fire mortality model in forest planning have not attracted much atten-tion. Few studies have used or developed post-fire mortality models in forest planning (Peterson and Ryan, 1986; Ryan and Reinhardt, 1988; Reinhardt et al., 1997; Reinhardt and Crookston, 2003; González et al., 2007; Hyytiäinen and Haight, 2009). González et al. (2007) further considered its application within a forest planning context without using tissue injury indicators neither direct fire behaviour param-eters. Yet no such models have been developed for maritime pine stands in Portugal, even though maritime pine covers ~22.6 per cent of the forest cover, totalling 710.6 × 10³ ha with a yield of ~67.1 million m3 year21 (DGRF, 2006) and that 48 per cent of the forested area in Portugal that burned in the 1990s consisted of pure maritime pine stands (Pereira and Santos, 2003).
In this context, this study aims at developing post-fire mortality models for maritime pine that may be used for generating optimal management plans taking into account
fire. The occurrence of tree death in a sample plot over a given period of time is a binomial outcome that may be modelled by logistic regression (Hosmer and Lemeshow, 2000). Logistic regression methods have been previously used to predict the probability of a single tree to survive or die due to different causes (Regelbrugge and Conard, 1993; Botelho et al., 1996; Rigolot, 2004; Keyser et al., 2006; Eisenbies et al., 2007; González et al., 2007).
In this research, a three-step modelling strategy was used to develop the post-fire stand damage and tree mortality models (Woollons, 1998; Fridman and Stahl, 2001; Álvarez González et al., 2004). The three-step approach consists of (1) estimating whether mortality occurs in a stand after wildfire, (2) quantifying the degree of damage in terms of proportion of dead trees in the stand and (3) estimating the probability of mortality of a tree after a wildfire which serves to distribute the mortality among individual trees. Logistic regression was used in all three steps. Data from over 124 plots and 1174 trees were used for modelling purposes. Models with good ecological behaviour were preferred over models with purely good statistical fit. Materials and methods
Materials
The fire data used in this study consisted of perimeters of 2006–2008 wildfires in Portugal that were larger than 5 ha. Burned area mapping in 2006–2008 was obtained by automated classification of high-resolution remote sensing data (i.e. Landsat Thematic Mapper (TM) and Landsat Enhanced TM+). In this period, ~125 000 ha burned in 3436 fire events. Data acquisition further encompassed the collection of the 2006 National Forest Inventory (NFI) plots. By the overlay of NFI plots and fire perimeters using GIS tools (ArcGIS 9.2), it was possible to identity plots that had been measured before the wildfire occurrence. This analysis showed that 18 maritime pine plots of the 12 237 NFI plots were burned between 2006 and 2008. In the same period, 106 additional maritime pine burned plots were considered. These plots were measured in areas where the fire perimeter was known and trees had not been harvested. They were located all over the country and were inventoried (after the fire) at the same time as the burned NFI plots. In total, data acquisition encompassed the post-fire inventory of 124 plots from 2007 to 2009. In all these plots, no trees had been harvested after the wildfire.
The post-fire inventory involved, in the case of all 124 plots, both the measurement of biometric variables for trees with diameter larger than 7.5 cm (e.g. height, diam-eter at breast height, bole char height, crown killed height) and the characterization of the plot (e.g. elevation, aspect, slope, presence of soil erosion, shrubs species). However, because the objective of the model was to predict fire mor-tality if a fire occurs over long planning horizons (i.e. over 60 years), biometric variables tested for the model were limited to easily measurable tree and stand characteristics, which permit the forest manager to predict the effect of
stand structure and species composition on the expected mortality (Table 1).
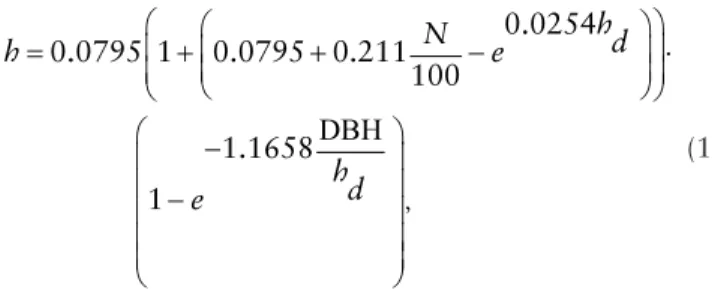
In the case of plots that had not been measured before the wildfire occurrence, regression models were used to reconstruct the forest before the fire. Pre-fire d.b.h. of standing burned trees was assumed to be unaffected by fire and pre-fire height was estimated using an equation devel-oped by Tomé et al. (2007) for maritime pine (equation 1).
DBH ⎛ ⎛ ⎞⎞ ⎜ ⎜⎜ ⎟⎟⎟ ⎜ ⎝ ⎠⎟ ⎝ ⎠ ⎛ ⎞ ⎜ ⎟ ⎜ ⎟ ⎜ ⎟ ⎜ ⎟ ⎜ ⎟ ⎝ ⎠ = + + − ⋅ − − , 0.0254 0.0795 1 0.0795 0.211 100 1.1658 1 h N d h e hd e (1)
where d.b.h. is the tree diameter at breast height (centime-tre), N is the stand density (number of trees per hectare) and hd is the dominant height (metre).
Methods
Modelling mortality with logistic regression (general approach)
The occurrence of stem death in a sample plot over a given period of time is a binomial outcome that may be mod-elled by logistic regression (Hosmer and Lemeshow, 2000). Moreover, the logistic function is mathematically flexible, easy to use and has a meaningful interpretation (Hosmer and Lemeshow, 2000). The logistic model predicts a prob-ability of an occurrence ranging continuously between 0 and 1. The dependent variable is dichotomous (e.g. death or no death). The logistic regression model may be pre-sented as: = − β + β + + β + 0 1 1 , 1 ( ... ) 1 p p Y x x e (2)
where Y is the dependent variable (dichotomous), x1 to xp are independent variables, β0 is the intercept and β1 to βp,
are parameters.
Table 1: Descriptive statistics for variables tested as model predictors at stand level
Stand level
Stands without dead trees = 31 Stands with dead trees = 93
Variable Max Min Average SD Max Min Average SD Altitude (m) 931 0 324.80 298.75 940 0 344.98 193.62 Slope (°) 27 0.60 12.64 6.10 32 0 13.13 7.71 avgDBH (cm) 34 5.36 17.31 7.70 29.33 4.6 13.55 5.94 N (tree/ha) 578 20 142.83 135.27 1539 20 278.06 295.82 G (m2 ha21) 21.36 0.08 4.73 5.84 38.15 0.08 7.03 8.35 Dg (cm) 37.14 7 18.40 7.92 32.69 7 16.34 6.91 Avgh (m) 19 5.30 11.77 4.06 25.75 3.47 12.82 5.88 sd (cm) 17.26 0 5.094 4.69 17.67 0 4.70 3.86 sh (m) 6.20 0 1.70 1.63 8.41 0 1.85 1.56 G/Dg 0.84 0.02 0.22 0.23 1.73 0.02 0.38 0.38 Sd/Dg 0.64 0.01 0.25 0.18 0.69 0.01 0.26 0.14 Pd (%) 0 0 0 0 0.99 0.05 0.82 0.31 Ndead (tree/ha) 0 0 0 0 1537 6 213.34 259.91 Tree level
Live trees = 234 Dead trees = 940
Variable Max Min Avg SD Max Min Avg SD
DBH (cm) 45.50 7 19.30 8.66 43.50 7.00 14.71 7.56 h (m) 28.10 3.44 13.98 4.71 23.60 3.80 11.30 4.12 g (m2 ha21) 0.16 0.00 0.04 0.03 0.15 0.00 0.02 0.02 BAL (m2 ha21) 5.17 0.00 1.20 1.15 5.40 0.00 1.35 1.27 Dg (cm) 207.03 4.90 44.73 41.18 189.23 4.90 27.36 29.01 DBH/Dg 2.21 0.24 1.03 0.33 2.22 0.33 0.94 0.27 g/G 0.01 0.00 0.01 0.01 0.11 0.00 0.01 0.01
G is stand basal area; Dg is the quadratic mean diameter; N, number of trees per ha; Pd, proportion of dead trees in the stand; Ndead, number of dead trees per ha; avgDBH, mean tree diameter of the stand; avgh is the average tree height; SD, standard deviation of tree diameters and Sh, standard deviation of tree heights of the trees in the stand; G/Dg is a density measure related to the number of trees per hectare. The predictor Sd/Dg expresses the relative variability of tree diameters. Altitude is measured in metres and slope is measured in degrees; DBH is the tree diameter at breast height; h is the tree height; g is basal area of the tree; BAL is the basal area of the trees higher than the studied tree, DBH/Dg and g/G are competition indexes. Max, maximum; min, minimum; Avg, average.
Models to predict stand-level damage and tree-mortal-ity caused by wildfires were developed using the logistic procedure of SAS 9.1 (SAS Institute, Cary, NC). This pro-cedure estimates the parameters of the logistic equation with maximum likelihood methods.
An analysis of the relationships between each individual independent variable and response variables was performed for a preliminary assessment of the relative importance of each variable on post-fire damage and tree mortality. The final multivariate model was obtained by testing all pos-sible combinations of variables. If the resulting mortality model is not biologically correct, it cannot be expected to perform well outside the data range (Hamilton, 1986; Crecente-campo et al., 2009). Thus, model building con-sidered ecological consistency of predictors (i.e. signs of coefficients), importance of the variable in terms of for-est inventory and management as well as its simplicity and its statistical performance and significance (e.g. 0.05 sig-nificance level, receiver operations characteristic (ROC) parameters, index of concordance and correct classification rate (CCR)). Collinearity was assessed by adding new variables in the model and observing the effect to the slope coefficients and estimated standard errors (Hosmer and Lemeshow, 2000).
Standard tests and statistics for logistic regression, namely the likelihood ratio test and Wald’s test, were used. Hosmer—Lemeshow goodness-of-fit statistics and ROCcurve analysis from the logistic model were also used (Hosmer and Lemeshow, 2000). The ROC curve plots the probability of detecting true signal (sensitivity) and false signal (specificity) over all possible cut-points. To evaluate the discriminatory ability of a cut-point, it is com-mon to summarize the information of the ROC curve into a single global value or index (e.g. area under the ROC curve). Models with area under ROC curve values higher than 0.7 are considered to provide an acceptable discrim-ination between wildfire occurrence and non-occurrence (Hosmer and Lemeshow, 2000). The concordance ana-lysis procedure was further used to help interpret results (Kleinbaum, 1994; Hosmer and Lemeshow, 2000).
A way to summarize the results of a fitted logistic regres-sion model is to use a classification table. This is a result of cross-classifying the outcome variable (e.g. death occurrence) with a dichotomous variable whose values are derived from the estimated logistic probabilities (Hosmer and Lemeshow, 2000). The logistic model predicts a prob-ability of an occurrence ranging continuously between 0 and 1. Thus to obtain this dichotomous variable (e.g. death or no death), a cut-point must be defined and compared to each estimated probability (Hosmer and Lemeshow, 2000). Different selection criteria have been proposed, e.g. the average observed survival rate of the dataset and the value that maximizes the sum of sensitivity and specificity (Monserud and Sterba, 1999; Crecente-Campo et al., 2009).
In this study, three different criteria were used to define the cut-point: (1) the value that maximizes the CCR (e.g. Ryan, 1997), (2) the value where the sensitivity curve and the spe-cificity curve cross each other (Hosmer and Lemeshow, 2000)
and (3) the average observed percentage of event occurrence in the original data (Monserud and Sterba, 1999). Tables with classification error rates associated with different cri-teria to define cut-points were constructed to help select the best cut-point value. Due to the relatively small number of plots, no specific dataset was set aside for evaluation. Thus, evaluation of the model was done calculating ROC curves and classification tables for the fitting dataset. Modelling whether mortality will occur in a stand after a wildfire
In order to predict whether mortality will occur in a stand if a wildfire occurs, a stand-level binary variable was cre-ated. This variable takes the value ‘1’ if mortality occurs within the stand (mortality of trees bigger than 7.5 cm) and the value ‘0’ if no death occurs. Thus, this model would filter the stands where some mortality would occur from those where all the trees survive. A number of stand-level features (e.g. site conditions, biometric variables) were tested (Table 1). The dataset showed that mortality had occurred in 75 per cent of burned stands (93 of 124 stands). Estimating stand-level mortality caused by a wildfire In stands where mortality did occur (93 over 124 stands), two stand-level variables were created; the number of trees that died after fire (i.e. number of events) and the total number of trees in the stand (i.e. number of trials). Then SAS logistic procedure used these numbers to fit the lo-gistic regression. This model would quantify mortality caused by a wildfire in terms of proportion of dead trees in the stand. The average proportion of dead trees in stands where mortality occurred was 80 per cent (940 dead trees of 1174) (Table 1). A number of stand-level variables re-lated to topography, biometric variables and structure were tested (Table 1).
Estimating post-fire individual tree mortality
The predicted variable was the probability of a tree to die. For modelling purposes, a tree-level binary categorical variable was created. This variable takes the value ‘1’ if death occurs, and a ‘0’ if the tree survives.
As this is a two-stage model, a variable indicating the proportion of dead trees in the stand (Pd) predicted with the stand-level model (estimating stand-level mortality caused by a wildfire) was tested as a predictor. For this reason, only trees present in stands where mortality was predicted were used to fit the tree mortality model (i.e. 940 trees). Further predictors were selected by testing whether they improved the model (Table 1).
Results
The logistic model to predict the probability of mortality occurring in a stand if fire occurs is
StandMort Dg avgDBH = + − + − 1 1 e 2 1231 2 3943 0 1134 G ( . . ) . ), (3)
where StandMort is the probability of tree death to occur in the stand (i.e. it differentiates the stands where all the trees survive from the stands where some or all the trees die), G is the basal area (square metre per hectare) and Dg is the quadratic mean diameter (centimetre) of trees. The predictor G/Dg is a density measure and avgDBH is the average diameter at breast height (centimetre). Higher densities contribute to a higher probability of death to occur in a stand, whereas this probability decreases with higher average diameter at breast height (see equation 3 and Table 2). The model was successful in predicting whether mortality did occur after the wildfire in 73.8 per cent of stands (i.e. percentage of concordant pairs). The area under the ROC curve (0.74) indicated good discrim-ination (Hosmer and Lemeshow, 2000).
The model to quantify stand-level mortality caused by wildfires where mortality did occur has the following form:
Pd= Alt Slope avgDBH
+ − + + − +
1
1 e ( .0 7065 0 00491. 0 1158. 0 1649. 00 1456. Sh), (4)
where Pd stands for the proportion of dead trees in the stand, Alt is altitude (metres), Slope is measured in degrees, avgDBH is the average diameter at breast height (centime-tre) and Sh is the standard deviation of the height of trees (metre). The relative mortality at stand-level caused by a wildfire (equation 4) decreases with higher average diam-eter at breast height (Table 3). Conversely, higher vari-ability in tree heights (Figure 1) and steep slopes increase the stand-level mortality. The model showed a percentage of concordant pairs of 80 per cent) and the area under the ROC curve (0.846) indicated excellent discrimination (Hosmer and Lemeshow, 2000).
The tree-level mortality model that best predicted the probability of an individual maritime pine tree to die if a forest fire occurs was:
( 3.1958 0.0244 DBH 0.2601BAL 6.3382 Pd )
1
Ptd
,
1
− − − ⋅ + ⋅ + ⋅=
+
e
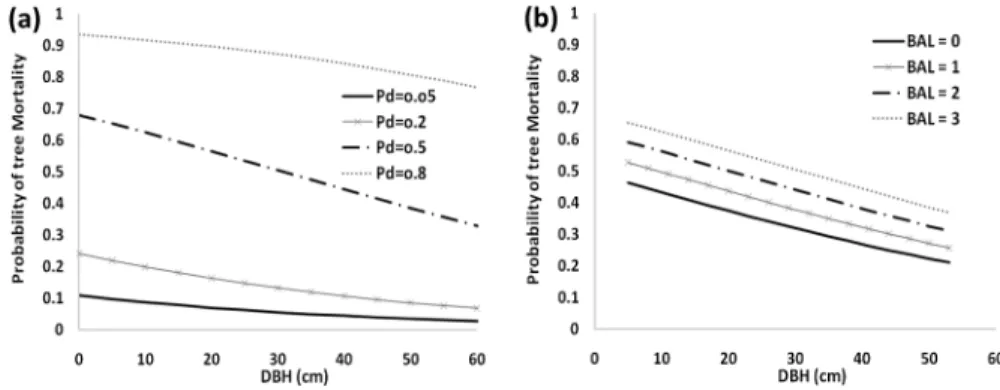
(5)where Ptd is the probability of an individual tree to die, DBH is the tree diameter at breast height (centimetre), BAL is the basal area of trees higher than the studied tree (square metre per hectare) and Pd is the propor-tion of dead trees in the stand. The model indicates that trees with large DBH are less prone to die due to a wild-fire (Figure 2 and Table 4). Conversely, trees suppressed (high BAL) and located in stands with higher expected stand damage (Pd) have higher mortality probability (equation 5). The model was successful in predicting whether mortality did occur after the wildfire in 86 per cent of trees (i.e. percentage of concordant pairs). The area under the ROC curve (0.85) indicated excellent dis-crimination (Hosmer and Lemeshow, 2000). The model shows a CCR of 85.1.
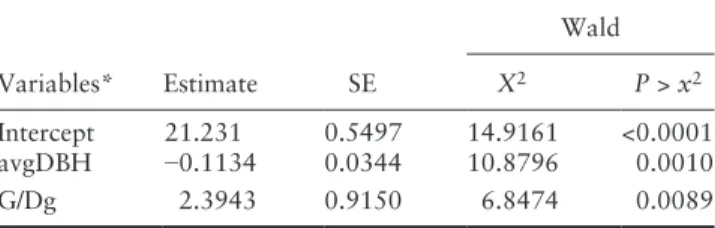
Table 2: Parameter estimates, standard errors (SE), Wald X2 statistics and P-values for the model predicting whether
mortality will occur in a stand (equation 3)
Variables* Estimate SE Wald X2 P > x2 Intercept 21.231 0.5497 14.9161 <0.0001 avgDBH −0.1134 0.0344 10.8796 0.0010 G/Dg 2.3943 0.9150 6.8474 0.0089 *For the parameter definitions see Table 1.
The most appropriate cut-points were calculated for the model predicting whether mortality will occur in a stand (Table 5). If the value that maximizes the CCR (75.8 per cent) was used as criteria to choose the cut-point, its value would be 0.36 (Table 5). According to this value, mortality would occur in 96 per cent of the plots (classified as dead), while inventories after wildfire events showed that mortality did occur only in 75 per cent (93 plots over 124). Around 24 per cent of the predictions were false positives (i.e. stands that did not have any dead trees but were classified as if mor-tality had occurred) and 40 per cent were false nega-tives (i.e. stands that had dead trees but were classified as if mortality had not occurred). The cut-point at which
Table 3: Parameter estimates, standard errors (SE), Wald X2
statistics and P-values for the model predicting degree of damage caused by a wildfire equation 4 (i.e. proportion of dead trees in the stand) Variables* Estimate SE Wald X2 P > x2 Intercept 0.7065 0.0687 105.8 <0.0001 Altitude 0.00491 0.000106 21.5592 <0.0001 Slope 0.1158 0.00272 18.0577 <0.0001 avgDBH −0.1649 0.00426 14.9658 <0.0001 sh 0.1456 0.0177 67.5690 <0.0001 *For the parameter definitions see Table 1.
Figure 1. Effect of average diameter (avgDBH, centimetre) and
standard deviation of height (sh, metre) on the proportion of dead trees according to equation 4 for a stand located at 500 m above sea level with a slope of 20°.
the sensitivity and specificity curves crossed was ~0.76. Using this value led to a CCR of 66.9 per cent and the percentage of stands classified as having mortality was 58.1 per cent (classified as dead). Using this cut-point, in 41.9 per cent of the stands classified as not having mortality (classified as alive), some trees had actually died (i.e. false negative). On the other hand, when the average observed percentage of event occurrence (Monserud and Sterba, 1999) was used, a cut-point of 0.70 would be chosen. This cut-point classified 26.6 per cent of stands as stands where no mortality did occur (classified as alive); this value was very close to the real observed rate which is 25.5 per cent (i.e. 31 plots over 124). However, in this case, the number of false negatives was 54.5 per cent and the CCR was 72.6 per cent. Analysing these different options and having in mind that a compromise has to be found between classification of dead trees and good prediction of mortality and survival rates, a cut-point value of 0.7 is recommended as the predicted stands with mortality is the closest with the observed in the inventoried data.
Discussion and conclusions
Post-fire mortality has been studied using a variety of direct and indirect methods (e.g. Fowler and Sieg, 2004; Sieg et al., 2006). However, they need information that is seldom available to forest managers beforehand (e.g. tissue
Table 4: Parameter estimates, standard errors (SE), Wald
X2 statistics and P-values for the tree-model predicting the
probability of a tree to die due to a forest fire (equation 5)
Variables* Estimate SE Wald X2 P > x2 Intercept −3.1958 0.4237 56.9008 <0.0001 DBH −0.0244 0.0109 5.0261 0.0250 BAL 0.2601 0.0754 11.8973 0.0006 Pd 6.3382 0.4276 219.7140 <0.0001 *For the parameter definitions see Table 1.
Figure 2. Effect of diameter at breast height (d.b.h., centimetre), stand-level mortality (Pd) and BAL (m2 ha−1) on the probability
of tree mortality using equation 5 for a BAL of 3 m2 ha−1 (a) and a Pd of 0.5 (b).
damage, fire intensity). Fire simulators may provide infor-mation about tissue damage or fire intensity; however, they need information about specific weather conditions and fuel accumulation at the time of fire that are hard to predict over long planning horizons (Rothermel, 1991; Finney, 1999; He and Mladenoff, 1999; González et al., 2007). The unavail-ability of this information constrains the applicunavail-ability of these methods in long-term forest management planning. Thus, both approaches are hardly practical for forest planning.
The proposed logistic modelling approach to post-fire mortality for enhanced forest planning has been used earlier for predicting tree-mortality as a consequence of wind dam-age (Lohmander and Helles, 1987; Jalkanen and Mattila, 2000), prescribed fire (Botelho et al., 1996) and wild-fire (Regelbrugge and Conard, 1993; McHugh and Kolb, 2003; Rigolot, 2004; González et al., 2007). This approach has been also used to model natural tree mortality (Fridman and Stahl, 2001; Álvarez-González et al., 2004). Our re-search confirmed the potential of the proposed approach to develop mortality models that may be used in forest plan-ning (Reinhardt and Crookston, 2003; González et al., 2007; Hyytiäinen and Haight, 2009).
The proposed approach was tested using a dataset encompassing 1174 trees in 124 plots located in 26 fire perimeters in Portugal. Results suggest that the models may predict accurately post-fire mortality in maritime pine stands in Portugal. An advantage of the three-step meth-odology used in this study compared to other traditional approaches is the possibility of detecting stands where no mortality occurs.
Otherwise, traditional models always generate some mortality for all plots (Fridman and Stahl, 2001). This is especially important in species that have demonstrated a good fire resistance as the case of maritime pine (Ryan et al., 1994; Fernandes et al. 2008).
Prediction and classification do not follow the same pattern, so a compromise must be reached between good classification of dead trees and good prediction of mortality and survival rates when choosing a cut-point (Crecente-Campo et al., 2009). In our study, a cut-point of 0.7 for the model predicting whether mortality occur in a stand (equation 3) was selected. To determine this cut-point, the
observed percentage of stands with mortality was used as suggested by Monserud and Sterba (1999). After a wild-fire, the number of stands where at least some mortality occurs is usually much greater than the number of stands where no mortality occurs, so errors that result in under-estimating the number of stands where mortality occurs could have more impact. Thus, cut-point of 0.7 presented the best compromise between underestimating the number of stand where mortality occurs (the case of cut-point = 0.76) and overestimating mortality that occurs if cut-point that maximizes the number of CCR is used (0.36).
In the framework of forest management planning, equa-tion 3 may be used to predict whether mortality may occur in a stand after a wildfire. As these models are developed to support management planning, equation 4 estimates the number of trees that will die in the stand (i.e. percentage of trees) after a wildfire (if mortality indeed occurs). Equation 5 may then be used to distribute that mortality among trees. Thus, equation 5 may be used to predict the probability of mortality of each tree in the stand and to build a list of all trees in the stand ordered according to this probability (trees with higher probability of mortality are ranked first in the list). The management planning model may then select the trees that will be assumed to die for planning purposes by going down the list and stopping when it reaches the number of trees that are estimated to die (from equation 4). For this reason, no cut-point is needed to transform the estimated probability into a dichotomous variable (e.g. death or no death). Equation 5 is especially important when the growth and yield simulation uses an
individual tree model (which means that every tree may have different characteristics). As suggested by González et al. (2007), the tree mortality equations can be used to generate mortality variation if a stochastic component corresponding to the residual variation of the stand-level mortality model is added to the prediction.
Our models are developed to predict mortality if a fire occurs in a forest management planning context. Thus, unlike former models for post-fire tree mortality that were developed to assess mortality after a wildfire occurrence, our models do not use tissue damage or fire severity as predictors. This is in concordance with the approach pre-sented by González et al. (2007). However, some of the variables included in our models have a clear correlation with fire behaviour. This is the case of slope as steeper slopes increase the expected mortality. Biometric variables that impacted post-fire mortality included tree diameter (average d.b.h. of the stand and d.b.h. of the tree), vari-ation of heights (Sh) and indicators of density such as basal area (G) and competition index (BAL). Other significant variables were related to fire behaviour (i.e. slope) and stand location (i.e. altitude). This agrees with findings of Fernandes et al. (2008), who stated that the level of injury and mortality for a given species is a combined outcome of fire behaviour, tree size and stand structure. In addition, Fernandes (2009) presented a study where combined for-est structure data and fuel modelling to classify fire hazard in Portugal. He concluded that forest structure is highly related to fire intensity. Based in previous studies and accord-ing to the purpose of this model, no direct measurements
Table 5: Prediction parameters depending on the cut-points used to transform a continuous probability into a 0–1 dichotomous value
predicting whether there is mortality in a stand or not
Cut-point CCR (%) Sensitivity (%) Specificity (%) positive* (%)False negativeFalse † (%) Classified as dead (%) as alive (%)Classified
0.36 75.8 97.8 9.7 23.5 40.0 96.0 4.0 0.38 75.8 96.8 12.9 23.1 42.9 94.4 5.6 0.40 75.8 96.8 12.9 23.1 42.9 94.4 5.6 0.42 75.0 94.6 16.1 22.8 50.0 91.9 8.1 0.44 75.0 94.6 16.1 22.8 50.0 91.9 8.1 0.46 75.0 94.6 16.1 22.8 50.0 91.9 8.1 0.48 75.0 94.6 16.1 22.8 50.0 91.9 8.1 0.50 74.2 93.5 16.1 23.0 54.5 91.1 8.9 0.52 75.0 93.5 19.4 22.3 50.0 90.3 9.7 0.54 75.0 93.5 19.4 22.3 50.0 90.3 9.7 0.56 73.4 90.3 22.6 22.2 56.3 87.1 12.9 0.58 73.4 90.3 22.6 22.2 56.3 87.1 12.9 0.60 74.2 89.2 29.0 21.0 52.6 84.7 15.3 0.62 74.2 88.2 32.3 20.4 52.4 83.1 16.9 0.64 74.2 86.0 38.7 19.2 52.0 79.8 20.2 0.66 72.6 83.9 38.7 19.6 55.6 78.2 21.8 0.68 71.8 82.8 38.7 19.8 57.1 77.4 22.6 0.70 72.6 80.6 48.4 17.6 54.5 73.4 26.6 0.72 71.0 77.4 51.6 17.2 56.8 70.2 29.8 0.74 69.4 74.2 54.8 16.9 58.5 66.9 33.1 0.76 66.9 66.7 67.7 13.9 59.6 58.1 41.9 0.78 63.7 62.4 67.7 14.7 62.5 54.8 45.2
The percentage of observed plots where occurred tree mortality was 75%.
* Stands that did not have any dead trees but were classified as if mortality had occurred.
† Stands that had dead trees but were classified as if mortality had not occurred.
of fire behaviour were included in the model. This is be-cause the purpose of this model is to predict mortality for long-term planning horizons (i.e. over 60 years planning periods), where data needed to use fire behaviour models is limited or even not possible to calculate for small scale areas located in Portugal (e.g. bush development, 1–10 h fuel moisture content, specific weather conditions in a specific day for long periods). However, dataset of fire oc-currences which cover many different fire events was used, in addition, indirect variables that may be related to fire behaviour as can be the slope or the vertical structure of the stands were included in the analysis.
The need for an individual-tree mortality model for long-term planning is justified by the fact that growth simulation may be done with individual tree-growth models. Thus, in-dividual tree-mortality models even in long-term planning periods help to distribute stand mortality over trees with different tree sizes.
In concordance with other studies, in our stand-level mortality model, steeper slopes increase the expected pro-portion of dead trees in the stand; this may be explained by an easier transfer of heat uphill (Agee, 1993; González et al., 2007; Hyytiäinen and Haight, 2009). In our case, altitude correlates positively with the degree of mortality in burned areas because most of the burned stands were located in high altitudes.
The coefficients of biometric variables in stand-level mor-tality models indicate that even-aged stands with higher tree diameters have lower stand mortality than irregular stands with trees with smaller dimensions. Moreover, in stands with higher densities and smaller diameters, stand mortality is expected to be higher than in stands with lower densities. This is in concordance with studies in North-American conifer dry forests (Pollet and Omi, 2002; Agee and Skinner, 2005; Ritchie et al., 2007) which indicate that fire severity is lower in open stands, especially when thinning is concurrent with surface fuel treatment. Also in Portugal Fernandes et al. (2005, 2010) and in southern Spain Gallegos et al. (2003) indicated that dense maritime pine stands have higher crown fire potential and tend to experience higher fire severity which results in higher post-fire tree mortality. They indicate that high densities favour death of the lower canopy branches which are retained, establishing continuity with the live crown and, conse-quently, implying high crowning potential. In our case, variability of tree heights (Sh) is highly related to vertical continuity of fuels and thus with high crowning potential and higher mortality.
At tree level, tree diameter (d.b.h.) was found to be nega-tively related with tree mortality. This is in concordance with other studies (Ryan and Reinhardt, 1988; Hély et al., 2003; González et al., 2007). Moreover, a competition index (BAL) was found to be positively related with tree mortality; the more suppressed is the tree (i.e. higher BAL) the more probability of death. This is in concordance with findings by González et al. (2007) and Van Mantgem et al. (2003), who concluded that a suppressed tree is more prone to die than dominant trees due to both, the fire dam-age and the stress before the fire event.
When no pre-fire inventory was available, reverse engineering (i.e. regression models) was needed to re-construct the stand. Thus, the quality of the models is dependent on the quality of the equations used for that purpose. Stands where burned trees had been harvested were not used in the model fitting process. Further, this research considered mortality within a period extending between 1 and 2 years after the wildfire, a time period between fire and the inventory that has been already used by other authors (Botelho et al., 1998; Fernandes et al., 2008). In some cases, this may lead to an underestima-tion of mortality caused by the wildfire. Nevertheless, the development of the first maritime pine post-fire mortality models in Portugal took into account all available data and information.
Validation of the models was done through studies of the performance of the functions. No specific validation data sets were set-aside and later used for that purpose. This was for two main reasons. Firstly, the relatively small number of observations in the stand dataset. Secondly, the best pos-sible parameter estimates were of greater interest. There are advantages and disadvantages of splitting the dataset for model validation purposes as discussed by Kozak and Kozak (2003). They concluded that that cross validation by data splitting and double cross validation provide little, if any, additional information in the process of evaluating regression models. Other authors have the same opinion, for instance, Picard and Cook (1984).
Post-fire mortality models are a valuable forest man-agement planning tool (González et al., 2007). Their use-fulness in forest planning depends on the information they may provide about the impact on mortality of varia-bles whose future value may be estimated with reasonable accuracy. This research encompassed the development of maritime pine post-fire stand and tree mortality models for enhanced forest planning in Portugal. These models are based on variables that are under the control of forest managers (e.g. forest density, mean diameter) and pro-vide information about the impact of forest fires under alternative forest conditions. Thus, these models are in-strumental to designing silvicultural strategies that may decrease mortality caused by wildfires and that they can be used to effectively integrate fire risk into forest man-agement planning.
Funding
This research was supported by Project PTDC/AGR-CFL/64146/ 2006 “Decision support tools for integrating fire and forest man-agement planning” funded by the Portuguese Science Foundation and MOTIVE (Models for Adaptive Forest Management) funded by 7th EU FP.
Acknowledgements
The authors wish to acknowledge the Portuguese Forest Service for providing the perimeters of wildfires in 2006, 2007 and 2008. Authors would like to thank the Portuguese Science Foundation for funding the PhD of Susete Marques ‘SFRH/BD/62847/2009’
and Brigite Roxo Botequim ‘SFRH/BD/44830/2008’. The authors also wish to thank Mss Andreia Silva for helping with the data-base and Dr. João Freire for his advice using software. The authors thank the two unknown reviewers and Dr. Ane Zubizarreta Gerendiain for their relevant remarks and suggestions.
References
Agee, J.K. 1993 Fire Ecology of Pacific Northwest Forests. Island Press, Washington, DC. 493 p.
Agee, J.K. and Skinner, C.N. 2005 Basic principles of forest fuel reduction treatments. For. Ecol. and Manage. 211, 83–96. Albini, F.A. 1976 Estimating Wild Fire Behaviour and Effects.
USDA Forest Service General Technical Report INT-30, Ogden, Utah, USA.
Albini, F.A. 1979 Spot Fire Distance from Burning Trees—A
Predictive Model. USDA Forest Service General Technical
Report. INT-56.
Albini, F.A. 1983 Potential Spotting Distance from Wind-Driven
Surface Fires. USDA For. Serv. Res. Pap. INT-309.
Alexander, M.E. 1985 Estimating the length-to-breadth ratio of
elliptical forest fire patterns. In Proceedings of 8th Conference Fire and Forest Meteorology. Michigan, Society of Amercian
Foresters, Detroit. pp.287–304.
Álvarez González, J.G., Castedo Dorado, F., Ruiz González, A.D., Lóptez Sánchez, C.A. and Von Gadow, K. 2004 A two-step mortality model for even-aged stands of Pinus radiate D. Don in Galicia (Northwestern Spain). Ann. For. Sci. 61, 439–448. Anderson, H.E. 1983 Predicting Wind-Driven Wildland Fire Size
and Shape. USDA Forest Service Research Paper. INT-305.
Botelho, H.S., Fernandes, P.M. and Ruas, L.L.S. 1996 Modeling
Pinus pinaster Induced by up-slope Wind Driven Prescribed Fires in Northern Portugal. In Proceedings of the 13th Confer-ence on Fire and Forest Meteorology, Lorne, Australia.
Inter-national Association of Wildland Fire. pp. 473–476.
Botelho, H.S., Rego, F.C. and Ryan, K.C. 1998 Tree mortality models for Pinus pinaster of Northern Portugal. In
Proceed-ings of the 13th Conference on Fire and Forest Meteorology, Lorne, Australia. International Association of Wildland Fire,
pp. 235–240.
Crecente-Campo, F., Marshall, P. and Rodríguez-Soalleiro, R. 2009 Modeling non-catastrophic individual-tree mortality for
Pinus radiata plantations in northwestern Spain. For. Ecol. Manage. 257, 1542–1550.
DGRF. 2006 Resultados do Inventário Florestal Nacional
2005/2006, 5a Revisão. Direcção-Geral dos Recursos Florestais,
Lisboa, Portugal, p. 70.
Eisenbies, M.H., Davinson, C., Hohnson, J., Amateis, R. and Gottschalk, K. 2007 Tree mortality in mixed pine-hardwood stands defoliated by the European Gypsy moth (Lymantria
dis-par L.). For. Sci. 53, 683–691.
Fernandes, P.M. 2009 Combining forest structure data and fuel mod-elling to classify fire hazard in Portugal. Ann. For. Sci. 66, 415. Fernandes, P.M., Loureiro, C. and Botelho, H.S. 2004 Fire
behav-iour and severity in a maritime pine stand under differing fuel conditions. Ann. For. Sci. 61, 537–544.
Fernandes, P.M., Loureiro, C. and Botelho, H. 2005 Alteracões estruturais num pinhal bravo de regeneracã natural sub-metido a desbaste térmico. In Actas das Comunicações do 5°
Congresso Florestal Nacional. R. Silva and F. e Páscoa (eds).
Instituto Politécnico, Viseu.
Fernandes, P.M. and Rigolot, E. 2007 The fire ecology and management of maritime pine (Pinus pinaster Ait.). For. Ecol.
Manage. 241, 1–13.
Fernandes, P.M., Vega, J.A., Jimenez, E. and Rigolot, E. 2008 Fire resistance of European pines. For. Ecol. Manage. 256, 246–255. Fernandes, P., Luz, A. and Loureiro, C. 2010 Changes in wildfire
severity from maritime pine woodland to contiguous forest types in the mountains of northwestern Portugal. For. Ecol.
Manage. 260, 883–892.
Fernández, C., Vega, J.A., Fonturbel, T., Pérez-Gorostiaga, P., Jiménez, E. and Madrigal, J. 2008 Effects of wildfire, salvage logging and slash treatments on soil degradation. Land Degrad.
Dev. For. Ecol. Manage. 255, 1294–1304.
Finney, M.A. 1998 FARSITE: Fire Area Simulator—Model
Development and Evaluation. USDA Forest Service Research
Paper. RMRS-RP-4, Ogden, UT. 47p.
Finney, M.A. 1999 Mechanistic modeling of landscape fire patterns. In Spatial Modeling of Forest Landscape Change: approaches
and applications. D.J. Mladenoff and W.L. Baker (eds).
Cambridge University Press, Cambridge, UK, pp. 186–209. Finney, M.A. 2006 An Overview of FlamMap Fire Modeling
Capabilities. In Fuels Management—How to Measure Success: Conference Proceedings. 28–30 March, Portland, OR. Pro-ceedings RMRS-P-41. Andrews, Patricia L., Butler, Bret W.,
comps. U.S. Department of Agriculture, Forest Service, Rocky Mountain Research Station, Fort Collins, CO. pp. 213–220. Fowler, J.F. and Sieg, C.H. 2004 Postfire Mortality of Ponderosa
Pine and Douglas-fir: A Review of Methods to Predict Tree Death. Gen. Tech. Rep. RMRS-GTR-132. U.S. Department of
Agriculture, Forest Service, Rocky Mountain Research Station, Fort Collins, CO, p. 25.
Fridman, J. and Stahl, G. 2001 A three-step approach for mod-elling tree mortality in Swedish forests. Scand. J. For. Res. 16, 455–466.
Gadow, K.V. 2000 Evaluating risk in forest planning models.
Silva Fennica. 32, 181–191.
Gallegos, V., Navarro, R., Ferna´ndez, P. and Valle, G. 2003 Post-fire regeneration in Pinus pinea L. and Pinus pinaster Aiton in Andalucia (Spain). Environ. Manage. 31, 86–99.
González, J.R., Palahí, M. and Pukkala, T. 2005 Integrating fire risk considerations in forest management planning in Spain—a landscape level perspective. Landscape Ecology. 20, 957–970. González, J.R., Trasobares, A., Palahí, M. and Pukkala, T. 2007
Predicting stand damage and tree survival in burned forests in Catalonia (North-East Spain). Ann. For. Sci. 64, 733–742. Hamilton, D.A. 1986 A logistic model of mortality in thinned and
unthinned mixed conifer stands of northern Idaho. For. Sci. 32, 989–1000.
He, H.S. and Mladenoff, D.J. 1999 Spatially explicit and stochastic simulation of forest landscape fire disturbance and succession.
Ecology. 80, 81–99.
Hély, C., Flannigan, M. and Bergeron, Y. 2003 Modeling tree mortality following wildfire in the Southeastern Canadian Mixed-Wood Boreal Forest. For. Sci. 49, 566–576.
Hosmer, D.W. and Lemeshow, S. 2000 Applied Logistic
Regres-sion. 2nd edn. Wiley Series in Probability and Mathematical
Statistics, New York, p. 307.
Hyytiäinen, K. and Haight, R.G. 2009 Evaluation of forest manage-ment systems under risk of wildfire. Eur. J. For. Res. 129, 909–919. Jalkanen, A. and Mattila, U. 2000 Logistic regression models for
wind and snow damage in northern Finland based on the Na-tional Forest Inventory data. For. Ecol. Manage. 135, 315–330. Keyser, T., Smith, F.W., Lentile, L.B. and Shepperd, W.D. 2006
Modeling postfire mortality of Ponderosa Pine following a mixed-severity in Black Hills: the role of tree morphology and direct fire effects. For. Sci. 52, 530–539.
Kleinbaum, D.G. 1994 Logistic regression: a self- learning text.
Stat. Methods Med. Res. 1996, 103–104.
Kozak, A. and Kozak, R. 2003 Does cross validation provide additional information in the evaluation of regression models?
Can. J. For. Res. 33, 976–987.
Lohmander, P. and Helles, F. 1987 Windthrow probability as a function of stand characteristics and shelter. Scand. J. For. Res.
2, 227–238.
Martínez, E., Madrigal, J., Hernando, C., Guijarro, M., Vega, J.A. and Pérez-Gorostiaga, P. et al. 2002 Effect of fire intensity on seed dispersal and early regeneration in a Pinus pinaster forest. In Proceedings of the IV International Conference
on Forest Fire Research & 2002 Wildland Fire Safety Summit.
D.X. Viegas (ed). Millpress Science Publishers, Rotterdam, The Netherlands.
Martínez-Vilalta, J. and Piñol, J. 2002 Drought-induced mor-tality and hydraulic architecture in pine populations of the NE Iberian Peninsula. For. Ecol. Manage. 161, 247–256.
McHugh, C.W. and Kolb, T.E. 2003 Ponderosa pine mortality following fire in northern Arizona. Int. J. Wildland Fire. 12, 7–22.
Monserud, R.A. and Sterba, H. 1999 Modeling individual tree mor-tality for Austrian forest species. For. Ecol. Manage. 113, 109–123. Pereira, J.M.C. and Santos, T.N. 2003 Fire Risk and Burned Area
Mapping in Portugal. Direcção Geral das Florestas, Lisboa,
Portugal.
Peterson, D.L., Johnson, M.C., Agee, J.K., Jain, T.B., McKenzie, D. and Reinhardt, E.D. 2005 Forest structure and fire hazard in dry forests of the Western United States, Portland, OR, USDA Forest Service, Pacific Northwest Research Station, General Technical Report PNW-GTR-628. U.S. Department of Agriculture, Forest Service, Pacific Northwest Research Station, Portland, OR, p. 30. Peterson, D.L. and Ryan, K.C. 1986 Modeling postfire conifer
mor-tality for long-range planning. Environ. Manage. 10, 797–808. Picard, R.R. and Cook, R.D. 1984 Cross-validation of regression
models. J. Am. Stat. Assoc. 79, 575–583.
Pollet, J. and Omi, P.N. 2002 Effect of thinning and prescribed burning on crown fire severity in ponderosa pine forests. Int. J.
Wildland Fire. 11, 1–10.
Regelbrugge, J.C. and Conard, S.G. 1993 Modeling tree mortality following wildfire in Pinus ponderosa Forests in the Central Sierra Nevada of California. Int. J. Wildland Fire. 3, 139–148. Reinhardt, E.D. 1997 Using FOFEM 5.0 to Estimate Tree
Mor-tality, Fuel Consumption, Smoke Production and Soil Heating from Wildland Fire. USDA Forest Service, Missoula Fire
Sci-ences Lab, Missoula, MT.
Reinhardt, E.D. and Crookston, N.L. 2003 The Fire and
Fuels Extension to the Forest Vegetation Simulator. RMRS-GTR-116. USDA Forest Service, Rocky Mountain Research
Station, Ogden, UT, p. 209.
Reinhardt, E.D., Keane, R.E. and Brown, J.K. 1997 First Order
Fire Effects Model: FOFEM 4.0, User’s Guide. Forest Service
General Technical Report. INT-GTR-344. U.S. Department of Agriculture, Forest Service, Intermountain Research Station, Ogden, UT, 65 pp.
Rigolot, E. 2004 Predicting postfire mortality of Pinus halepensis Mill. And Pinus pinea L. Plant Ecol. 171, 139–151.
Ritchie, M.W., Skinner, C.N. and Hamilton, T.A. 2007 Prob-ability of tree survival after wildfire in an interior pine forest of northern California: effects of thinning and prescribed fire. For.
Ecol. Manage. 247, 200–208.
Rothermel, R.C. 1972 A Mathematical Model for Predicting Fire
Spread in Wildland Fuels. Res. Pap. INT-115. U.S. Department
of Agriculture, Forest Service, Intermountain Forest and Range Experiment Station, Ogden, UT, p. 40.
Rothermel, R.C. 1991 Predicting Behavior and Size of Crown
Fires in the Northern Rocky Mountains. USDA Forest Service,
Ogden, UT. Research Paper INT-483.
Rothermel, R.C. and Rinehart, G.C. 1983 Field Procedures for
Verification and Adjustment of Fire Behavior Predictions. U.S.
Forest Service General Technical Report INT-142.
Ryan, T.P. 1997 Modern Regression Methods. John Wiley & Sons, New York, 515 pp.
Ryan, K.C. and Reinhardt, E.D. 1988 Predicting postfire mortality of seven western conifers. Can. J. For. Res. 18, 1291–1297. Ryan, K.C., Rigolot, E. and Botelho, H. 1994 Comparative
analysis of fire resistance and survival of Mediterranean and North-American conifers. In Proceedings 12th Conference on
Fire and Forest Meteorology, October 26–28, Bethesda, MD.,
Jekyll Island, GA, Society of American Foresters, pp. 701–708. SAS Institute Inc. SAS/STAT User’s Guide, Version 8 Edition. SAS
Institute Inc, Cary, NC. 2000.
Sieg, C.H., McMillin, J.D., Fowler, J.F., Allen, K.K., Negron, J.F. and Wadleigh, L.L. et al. 2006 Best predictors for postfire mortality of ponderosa pine trees in the Intermountain West.
For. Sci. 52, 718–728.
Tomé, M., Meyer, A., Ramos, T., Barreiro, S., Faias, S.P. and Cortiçada, A. 2007 Relações hipsométricas e equações de
diâmetro da copa desenvolvidas no âmbito do tratamento dos dados do Inventário Florestal Nacional 2005-2006. Publicações GIMREF. RT 3/2007. Universidade Técnica de Lisboa. Instituto Superior de Agronomia. Centro de Estudos Florestais,
Lisboa, Portugal.
Van Mantgem, P.J., Stephenson, N.L., Mutch, L.S., Johnson, V.G., Esperanza, A.M. and Parsons, D.J. 2003 Growth rate predicts mortality of Abies concolor in both burned and un-burned stands. Can. J. For. Res. 33, 1029–1038.
Van Wagner, C.E. 1977 Conditions for the start and spread of a crown fire. Can. J. For. Res. 7, 23–24.
Wang, M., Borders, B. and Zhao, D. 2007 Parameter estimation of base-age invariant site index models: which data structure to use? For. Sci. 53, 541–551.
Weaver, H. 1943 Fire as an ecological and silvicultural factor in the ponderosa pine region of the Pacific slope. J. For. 41, 7–15. Woollons, R.C. 1998 Even-aged stand mortality estimation
throught a two-step regression process. For. Ecol. Manage.
105, 189–195.
Received 17 August 2010