U
NIVERSIDADE DE
L
ISBOA
Faculdade de Ciˆencias
Departamento de Inform´atica
SECURE MONITORING FOR A SECURE SMART
GRID
Rodrigo Bar˜ao de Medeiros
Dissertac¸˜ao orientada pelo Prof. Doutor Fernando Manuel Valente Ramos
e co-orientada pelo Prof. Doutor Nuno Fuentecilla Maia Ferreira Neves
DISSERTAC
¸ ˜
AO
MESTRADO EM ENGENHARIA INFORM ´ATICA
Especializac¸˜ao em Arquitectura, Sistemas e Redes de Computadores
2015
Acknowledgments
I am very grateful to many for the support, insights, and influence that have led to this completed work.
To my colleagues and administrators in the Informatics Department here at The Uni-versity of Lisbon: thank you for your support and flexibility as I completed my cour-sework, and then researched and wrote this thesis. I couldn’t have done it without you behind me.
To my instructors in this work: thank you for helping to form my thinking throughout the program as I approached this capstone research project; and thank you especially to Dr. Fernando V. Ramos and Dr. Nuno Neves, for your time and willingness to guide me, for your knowledge, and for your valuable insights that helped me fulfil this work.
To my friend and colleague Ricardo Fonseca, thank you for your knowledge as well for the full support on the way of this work.
To my classmates in the program, Radu and Andre: I truly believe that learning happens in community, and your presence in the classroom with me as we attempted to progress was essential. Thank you.
To my colleagues in this masters, Bernardo, Miguel, Tiago, Faneca, thank you for the great and productive discussions and for the amazing time we spent together.
To my family: I wouldn’t be the scholar I am today without your encouragement; thank you for giving me the confidence to pursue what fulfils me and for always making my work feel worthwhile.
And, to Soraia: thank you for being my reason for sitting down at the computer and cranking this work out.
Funding This work was partially supported by the EC through project FP7 SEGRID (607109), by national funds of Fundac¸˜ao para a Ciˆencia e a Tecnologia (FCT) through project UID/CEC/00408/2013 (LaSIGE).
Resumo
O crescimento das redes e a necessidade de responder `a procura exigida pelo maior n´umero de aplicac¸˜oes e a concomitante utilizac¸˜ao de dados, levam a que a monitorizac¸˜ao desempenhe um papel fundamental n˜ao s´o para os sistemas de redes actuais mas tamb´em na resposta a um crescimento futuro. O sistema de monitorizac¸˜ao ´e uma componente crucial numa rede, suportando muitas func¸˜oes essenciais como engenharia de tr´afego, detecc¸˜ao de anomalias e diagn´ostico de desempenho. Um dos requisitos principais para estas soluc¸˜oes avanc¸adas na gest˜ao da rede ´e a necessidade de precis˜ao na monitorizac¸˜ao. Contudo, as t´ecnicas tradicionais de monitorizac¸˜ao n˜ao est˜ao preparadas para responder a estas necessidades. Um exemplo disso ´e o SNMP, o protocolo de gest˜ao e monitorizac¸˜ao da rede mais usado. O SNMP permite que pedidos sejam feitos aos switches para obter contadores por porto e por interface, e obter estat´ısticas gerais dos n´os da rede. O pro-blema ´e que muitos dos switches est˜ao limitados aos contadores que agregam o tr´afego para todo o switch e para as suas interfaces. Por consequˆencia o SNMP n˜ao permite obter estat´ısticas a uma granularidade maior, por flow, um requisito de muitas aplicac¸˜oes moder-nas, al´em de ter problemas de escalabilidade. Protocolos mais recentes, como o Netflow, resolvem o problema de escalabilidade mas as t´ecnicas de amostragem utilizadas trazem consigo outras limitac¸˜oes.
As redes definidas por software (Software Defined Networks) tˆem sido propostas como soluc¸˜ao para alguns destes problemas. Numa SDN, o plano de controlo ´e sepa-rado do plano de encaminhamento, centralizando-se a l´ogica de controlo da rede num controlador que corre num (cluster de) servidor(es). Para tal ser poss´ıvel, ´e necess´ario adicionar-se uma camada de comunicac¸˜ao entre o controlador e os dispositivos, algo feito tradicionalmente atrav´es do protocolo OpenFlow. Este protocolo de comunicac¸˜ao permite ao controlador acesso remoto para gest˜ao das tabelas de encaminhamentos dos dispositivos de rede. Este desacoplamento possibilita a centralizac¸˜ao l´ogica do controlo, oferecendo ao controlador uma vis˜ao global da rede. Com este novo paradigma de re-des surgiu um conjunto avanc¸ado de primitivas de monitorizac¸˜ao mais sofisticadas, que respondem aos requisitos impostos pelas redes de hoje. Os switches OpenFlow mantˆem estat´ısticas de tr´afego que podem ser recolhidas pelo controlador SDN a pedido. O con-trolador pode ainda injectar pacotes na rede, tornando assim poss´ıvel empregar t´ecnicas de monitorizac¸˜ao activa e passiva.
Apesar da sua importˆancia como elemento fundamental da infra-estrutura SDN, ne-nhuma das soluc¸˜oes at´e agora propostas inclui a seguranc¸a como requisito, o que as torna vulner´aveis a um conjunto extenso de ataques, inclusive pouco sofisticados. Acredi-tamos que tais primitivas devem ser resilientes de ra´ız, assegurando que as medic¸˜oes permanec¸am correctas mesmo sob ataque.
Esta tese centraliza-se na inclus˜ao da seguranc¸a na construc¸˜ao de novas ferramentas de monitorizac¸˜ao da rede. Para demonstrar tal necessidade, e justificar a preocupac¸˜ao, realizamos uma avaliac¸˜ao das limitac¸˜oes das t´ecnicas de monitorizac¸˜ao comuns demons-trando experimentalmente que elas s˜ao vulner´aveis a ataques. Para tal, utilizamos o Open-NetMon, um monitor SDN open-source, como alvo principal dos ataques. Apesar de ter-mos usado o OpenNetMon, alguns ataques s˜ao mais gen´ericos, sendo portanto extens´ıveis a outras plataformas SDN de monitorizac¸˜ao.
O foco dos ataques foi sobre as duas m´etricas de uso mais comum para operac¸˜ao e gest˜ao da rede: atraso na rede e taxa de transmiss˜ao. Estes ataques foram realizados numa plataforma f´ısica e numa virtual. Para os testes na plataforma virtual foi utilizado o emulador Mininet. Para os testes f´ısicos cri´amos uma testbed composta por switches em hardware da Pica8, com suporte Openflow, e m´ultiplas maquinas (para o controlador SDN e para os m´ultiplos hosts).
Finalmente, discutimos o impacto que estes ataques podem ter em sistemas cr´ıticos. Mais precisamente, us´amos uma Smart Grid como estudo de caso. As Smart Grids distinguem-se dos sistemas el´ectricos actuais pela sua capacidade muito mais sofisticada na monitorizac¸˜ao e controlo da rede. Dado a Smart Grid ser um sistema cr´ıtico, discuti-mos algumas soluc¸˜oes de monitorizac¸˜ao segura para este tipo de infraestrutura.
Palavras-chave:Rede, Monitorizac¸˜ao, Ataques, Smart Grid, Seguranc¸a em SDN viii
Abstract
Monitoring plays a fundamental role in current network deployments, supporting diverse activities such as traffic engineering, anomaly detection, and performance diag-nosis. The Software Defined Networks - a new paradigm in networking - has become an enabler for precise monitoring. In SDN the control plane is separated from the for-warding plane, leading to the logical centralization of the network control in a controller that runs in a (cluster of) server(s). For this purpose, a layer of communication is added between the controller and devices, something traditionally done through the OpenFlow protocol. This communication protocol allows the controller to have remote access to the forwarding tables of network switches. With the advent of SDN an array of advanced monitoring primitives has emerged, exploring the centralized vantage point offered by the controller. Such primitives should be resilient from the ground-up, ensuring a correct view under attack. In this work we intend to demonstrate that security should be a first class citizen when building SDN network monitoring frameworks. To justify this need, we perform a threat assessment on common monitoring techniques and demonstrate ex-perimentally that they are vulnerable to attacks, including relatively unsophisticated ones. This indicates that further work is needed in this area and, with that aim, we include an initial discussion on possible solutions for secure monitoring. We discuss the impact of these attacks on physical systems, more precisely we use a Smart Grid as a study case. Smart Grids differ from the traditional electric system by having an intelligent monitoring capability and network control. As a Smart Grid is a critical system, we discuss several solutions to make the monitoring system secure.
Keywords:Network, Monitoring, Attacks, Smart Grid, SDN security xi
Contents
List of Figures xviii
List of Tables xxi
1 Introduction 1
1.1 From the Power Grid to a Smart Grid . . . 2
1.2 From a conventional network to a Software Defined Network . . . 3
1.3 Motivation . . . 4
1.4 Contributions . . . 5
1.5 Planning . . . 5
1.6 Document structure . . . 6
2 Background and related work 9 2.1 Software Defined Networking . . . 9
2.1.1 OpenFlow . . . 10 2.1.2 SDN controllers . . . 12 2.1.2.1 NOX . . . 13 2.1.2.2 Beacon . . . 13 2.1.2.3 Floodlight . . . 13 2.2 Network Monitoring . . . 14
2.3 SDN-based monitoring frameworks . . . 15
2.4 SDN-based monitors . . . 17
2.4.1 A more detailed view on OpenNetMon . . . 18
2.5 Networking tools . . . 19 xiii
2.5.1 Mininet . . . 19
2.5.2 Ettercap . . . 20
2.5.3 Scapy . . . 20
3 Network monitoring under attack 23 3.1 Threat model . . . 24 3.2 Implementation . . . 25 3.2.1 A1 plugins . . . 26 3.2.1.1 Delay attack . . . 26 3.2.1.2 Throughput attack . . . 26 3.2.2 A2 and A3 plugins . . . 27 3.2.2.1 Delay attack . . . 27 3.2.2.2 Throughput attack . . . 28
3.3 Attacking the monitor . . . 28
3.3.1 Testing environment . . . 28
3.3.2 Attacking delay measurements . . . 29
3.3.2.1 Injection . . . 31
3.3.2.2 Eavesdropping and Injection . . . 32
3.3.3 Attacking throughput measurements . . . 33
3.3.3.1 Decreasing throughput . . . 34
3.3.3.2 Increasing throughput . . . 37
4 Discussion: securing the network monitor 39 4.1 Strategies to secure the network monitor . . . 39
4.2 Traditional security techniques . . . 40
4.2.1 Path delay probing techniques . . . 40
4.2.2 DoS attacks . . . 42
4.3 Using SDN holistic view . . . 43
4.3.1 Correlating switch counters . . . 43
4.3.2 Correlating sampled packets . . . 44
4.4 Enhancing switch design . . . 46 xiv
5 Conclusion 49
Bibliography 54
List of Figures
1.1 Traditional networking versus Software-Defined Networking (SDN). With SDN, management becomes simpler and middle boxes services can be
de-livered as SDN controller applications [21]. . . 4
1.2 Initial work plan. . . 6
2.1 Simplified view of an SDN architecture [21]. . . 10
2.2 OpenFlow-enabled SDN devices. . . 11
2.3 SDN basic architecture. . . 12
2.4 Structure of a probe packet . . . 18
3.1 Overview of network and attackers. . . 24
3.2 Adversary A1 injecting fake traffic. . . 26
3.3 Scapy plugin architecture. . . 27
3.4 Adversary A2 and (optional) A3 modifying traffic. . . 27
3.5 Testbed used in the experiments. . . 29
3.6 Delay measurement. . . 30
3.7 Increasing delay with probe injection (Mininet). . . 31
3.8 Increasing delay with probe injection (Testbed). . . 31
3.9 Increasing delay with probe modification (Mininet). . . 32
3.10 Increasing delay with probe modification (Testbed). . . 33
3.11 Decreasing delay with probe modification (Mininet). . . 33
3.12 Decreasing delay with probe modification (Testbed). . . 34
3.13 Structure of a probe packet . . . 35
3.14 Decreased throughput (Mininet). . . 36
3.15 Decreased throughput (Testbed). . . 36 xvii
3.16 Increasing throughput (Testbed). . . 37
4.1 Attack by probe modification. . . 41
4.2 Attack by replicating probe. . . 41
4.3 A2 adversary attacking the switch-to-controller link. . . 42
4.4 A2 adversary, attacking counters. . . 43
4.5 SDN network simple sampling. . . 44
4.6 Man-in-the-middle attack. . . 45
List of Tables
2.1 Simplified example of a flow table in OpenFlow switches. . . 11
Chapter 1
Introduction
Nowadays, huge demands are placed on data networks due to the large abundance of high bandwidth usage applications. The challenge is substantial, as current networks are difficult to expand and hard to manage. To meet the level of service requirements, network operators have traditionally opted for overprovisioning. Unsatisfied with such inefficient solution, companies like Google [18] and Microsoft [17] are leveraging on the SDN paradigm [21] to increase the efficiency of their networks, achieving significant cost savings. One of the key requirements for these advanced management solutions is the need for accurate network monitoring. Google’s B4 [18], for instance, requires traffic demand to be continuously measured, in order for its traffic engineering application to enforce the necessary bandwidth limits at the edge. For similar purposes, Microsoft’s SWAN [17] system includes network agents that collect and report information about traffic at a flow-level granularity.
Today’s electrical grid, alike data networks, seems unfit to deal with the increasing demands. The complex challenges faced by this infrastructure are driving the evolution of smart grid technologies. These smart grids have as core enabler an advanced commu-nication network, in which traffic engineering and monitoring are essential.
These use cases are paradigmatic examples of the need for a measurement infrastruc-ture that is agile to cope with the dynamics of networks and its traffic requirements. They are also demonstrative of the finer monitoring granularity these new wide-area and data center applications require [23]. Unfortunately, traditional monitoring techniques are not fit for this challenge. SNMP, the most common protocol for network monitoring, is too coarse-grained. NetFlow is more fine-grained, allowing measurement at the flow level, and scales better by using sampling approaches. The drawback is that this solution is
Chapter 1. Introduction 2 pensive by requiring dedicated hardware and specialized algorithms. In addition, sampled information may lead to inaccuracies – for instance, Netflow has been shown to be insuffi-cient for anomaly detection [24]. More recent work [22] proposes to instrument switches with hash-based primitives to increase measurement accuracy, but these methods require hardware modifications that may not be available in regular switches soon.
The fine-grain visibility of network traffic offered by SDN is seen as an enabler for the development of sophisticated network monitoring techniques, which fulfill the requirements of today’s network environments. The interfaces offered by OpenFlow-based switches are an important facilitator for this task. OpenFlow switches maintain traffic statistics that can be collected by the SDN controller by simple querying. The controller can also inject packets into the network, making it possible to employ both active and passive monitoring techniques.
With the take-up of SDN by the industry [31], the networking community has indeed started to explore the use of this technology for advanced network monitoring. Several tools rooted in SDN principles have been proposed recently (see Chapter 2). These in-clude frameworks to reduce monitoring latency (e.g., Planck [32]) and to improve SDN-based monitoring (e.g., OpenSketch [41]), and also network monitors such as OpenNet-Mon [37] and SLAM [39].
Despite their importance as a core element of the infrastructure, none of the net-work monitoring solutions proposed thus far considers security in their design. They are therefore vulnerable to an array of attacks, including relatively unsophisticated ones.
1.1
From the Power Grid to a Smart Grid
The power grid is a centralized unidirectional system of electric power transmission, elec-tricity distribution, and demand-driven control. The current architecture of the power grid poses problems by not allowing a significant portion of our energy needs to be generated through renewable sources. Having been designed for predictable power sources such as coal, natural gas, and nuclear power plants, it is not able to accommodate the high pene-tration of intermittent sources, such as renewable, without losing stability. The maximum amount of intermittent sources that can be utilized is estimated to be about 20% to 25% of the total demand using established control methods [14]. This poses a fundamental chal-lenge to the integration and penetration of renewable sources in the future. Furthermore, the distribution system is designed for one-way power flow (from central power plants
Chapter 1. Introduction 3 to distributed loads). The introduction of a large number of distributed sources, such as photovoltaic cells on residential roofs, is not easily manageable and increases stability liabilities in the operation of the grid.
In order to respond to these needs, developments are required on intelligent mon-itoring and network control, to make the electrical grid cope with the challenge. The resulting energy system is usually known as Smart Grid. A smart grid can repair itself, ensures a consistent and premium-quality power supply that resists to power leakages and can be operated more efficiently. This grid enables the decentralization of power genera-tion, allowing the individual user to generate on-site power by employing any appropriate method. The main enabler for a smart grid is the inclusion of advanced communication networks in the electric network. In this context, a strong enabler is Software Defined Networks with their advanced monitoring platforms.
1.2
From a conventional network to a Software Defined
Network
Smart grids bring modern communication technology to electrical networks, but tradi-tional networks are not without its problems. In current networks the control and forward-ing planes are bundled together in the network devices, as seen in the top of Figure 1.1. This makes management difficult, with each device having to be manually configured and managed using low-level tools. The wide variety of protocols leads to very complex networks, a complexity that could complicate the management of the smart grid.
An interesting solution to this problem are software defined networks (SDN). SDN separates both planes as shown in the bottom part of Figure 1.1, placing control plane functionality in a logically centralized SDN controller. The SDN controller is a (clus-ter of) server(s), running software that monitors and controls the network behaviour. This allows network administrators to manage network devices (routers or switches) using soft-ware that runs as an application on the SDN controller. SDN enables networks to become programmable [31]. To enable this separation the main method used for communication between these layers is Openflow [26] [1].
Chapter 1. Introduction 4
VERSION 2.01 5
Network Infrastructure
Forwarding Devices Open southbound API
Network Opera,ng System (SDN controllers) Network Abstrac,ons (e.g., topology abstrac,on)
Open northbound API
Net App 1 Net App 2 Net App n
Global network view Abstract network views
C o n tr o l p la n e D ata Pl an e
Fig. 4. SDN architecture and its fundamental abstractions.
The distribution abstraction should shield SDN applications from the vagaries of distributed state, making the distributed control problem a logically centralized one. Its realization requires a common distribution layer, which in SDN resides in the NOS. This layer has two essential functions. First, it is responsible for installing the control commands on the forwarding devices. Second, it collects status information about the forwarding layer (network devices and links), to offer a global network view to network applications.
The last abstraction is specification, which should allow a network application to express the desired network behavior without being responsible for implementing that behavior itself. This can be achieved through virtualization solutions, as well as network programming languages. These approaches map the abstract configurations that the applications express based on a simplified, abstract model of the network, into a physical configuration for the global network view exposed by the SDN controller. Figure 4depicts the SDN architecture, concepts and building blocks.
As previously mentioned, the strong coupling between control and data planes has made it difficult to add new functionality to traditional networks, a fact illustrated in Figure 5. The coupling of the control and data planes (and its physical embedding in the network elements) makes the development and deployment of new networking features (e.g., routing algorithms) very hard since it would imply a modification of the control plane of all network devices – through the installation of new firmware and, in some cases, hardware upgrades. Hence, the new networking features are commonly introduced via expensive, specialized and hard-to-configure equipment (aka middleboxes) such as load balancers, intrusion detection systems (IDS), and firewalls, among others. These middleboxes need to be placed strategically in the network, making it even harder to later change the network topology, configuration, and functionality.
In contrast, SDN decouples the control plane from the network devices and becomes an external entity: the network
SDN controller Network Applica2ons
MAC
Learning Algorithms Rou2ng
Intrusion Detec2on System Load Balancer So ftw ar e-D efi n ed N etw o rk in g C o n ve n ti o n al N etw o rk in g
Fig. 5. Traditional networking versus Software-Defined Networking (SDN). With SDN, management becomes simpler and middleboxes services can be delivered as SDN controller applications.
operating system or SDN controller. This approach has several advantages:
• It becomes easier to program these applications since the
abstractions provided by the control platform and/or the network programming languages can be shared.
• All applications can take advantage of the same network
information (the global network view), leading (arguably) to more consistent and effective policy decisions while re-using control plane software modules.
• These applications can take actions (i.e., reconfigure
forwarding devices) from any part of the network. There is therefore no need to devise a precise strategy about the location of the new functionality.
• The integration of different applications becomes more
straightforward [29]. For instance, load balancing and routing applications can be combined sequentially, with load balancing decisions having precedence over routing policies.
A. Terminology
To identify the different elements of an SDN as unequiv-ocally as possible, we now present the essential terminology used throughout this work.
Forwarding Devices (FD): Hardware- or software-based data plane devices that perform a set of elementary operations. The forwarding devices have well-defined instruction sets (e.g., flow rules) used to take actions on the incoming packets (e.g., forward to specific ports, drop, forward to the controller, rewrite some header). These instructions are defined by south-bound interfaces (e.g., OpenFlow [9], ForCES [30], Protocol-Oblivious Forwarding (POF) [31]) and are installed in the
Figure 1.1: Traditional networking versus Software-Defined Networking (SDN). With SDN, management becomes simpler and middle boxes services can be delivered as SDN controller applications [21].
1.3
Motivation
Today’s networks can be overwhelming in their complexity. The challenge of knowing the complexity and structure of a network and being able to accommodate the information on how all the individual elements are performing at a certain time (with accurate and correct measurements)is huge, but is also a key factor in maintaining the performance and integrity of the network as a whole.
Monitoring plays a fundamental role in current network deployments, to face this challenge. Software Defined Networks are an exception to this rule. The problem to this rule is that monitoring solutions are not secure. This problem is particularly acute in critical systems as Smart Grids. This thesis addresses this problem, taking the Smart Grid as a use case.
Chapter 1. Introduction 5
1.4
Contributions
The main contributions of our work are:
1. We demonstrate a series of vulnerabilities in SDN-based monitoring solutions. 2. We evaluate all the attacks using both an emulated and a physical platform.
3. Since this work was developed in the context of a critical infrastructure – the smart grid –, we discuss several solutions to secure the network monitor of a smart grid. We used OpenNetMon [37] as target for the attacks we demonstrate in this thesis. We have chosen this platform for two main reasons. First, because it monitors several metrics at per-flow granularity – throughput, packet loss, and delay – whereas other proposals focus on a single metric. Second, because it is available open-source. Although we have used OpenNetMon, several attacks are generic and will succeed against recent proposals. For instance, recently proposed SLAM [39] is an example of a system that uses the same techniques as OpenNetMon for measuring particular network metrics.
1.5
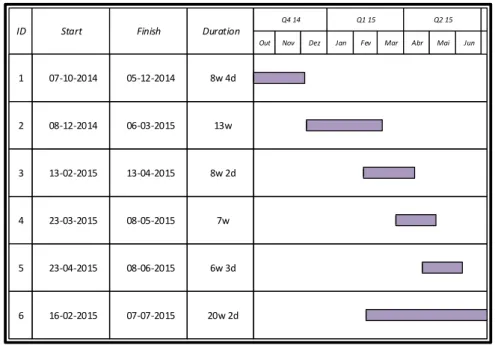
Planning
In the beginning of this work we have devised the following work plan, with six phases: 1. Study of the state of the art regarding smart grids and SDN.
2. Definition of the methodology and evaluation plan. This include setting up Open vSwitch in a smart grid aggregator (or a feasible alternative) and controlling it using an SDN controller (e.g., by testing a simple firewall application).
3. Devise algorithms to prevent Denial of Service attacks to the smart grid. 4. Implementation of the algorithms as an application in the SDN controller. 5. System evaluation.
Chapter 1. Introduction 6
ID Start Finish Duration
Q1 15 Q2 15 Q4 14
Mar
Jan Jun
Dez Mai
Nov Fev Abr Out 1 07-10-2014 05-12-2014 8w 4d 8w 2d 13-04-2015 13-02-2015 2 08-12-2014 06-03-2015 13w 4 23-03-2015 08-05-2015 7w 5 23-04-2015 08-06-2015 6w 3d 6 16-02-2015 07-07-2015 20w 2d 3
Figure 1.2: Initial work plan.
Our workplan has changed from the initial idea. The work we present in this thesis is part of an European project - SEGRID: security for smart grids - and a redefinition of the FCUL tasks in this project led to a significant change. Namely, FCUL was unable to buy the smart grid aggregator because these are only sold to electrical companies. Without this component, our original idea could not be implemented.
As such, we decided to focus our attention in the fundamental component that is part of the resilient communications infrastructure that FCUL will develop during the course of this project: a secure monitoring system.
As such, We performed a threat assessment on common monitoring techniques. We devised software plugins to perform the attacks, implemented them and experimentally demonstrated the attacks. Finally, after an evaluation of existing solutions, we devised some more secure and accurate techniques to overcome the noticed vulnerabilities.
1.6
Document structure
This dissertation is structured in the following way: • Chapter 2:Scientific background and related work.
de-Chapter 1. Introduction 7 scribes the attack model. This is followed by a description of the implementation for performing the attacks. Finally, we demonstrate the attacks that cause the mon-itoring platform to report invalid measurement data. We concentrate on the two metrics most used in practice today: path delay and link throughput.
• Chapter 4: This chapter presents a discussion on how to secure an SDN-based monitoring platform.
Chapter 2
Background and related work
This chapter presents background on the subject under study. We address SDN, Open-Flow and network monitoring with an emphasis on SDN-based monitoring frameworks. Finally, we describe some useful networking tools - Mininet, Ettercap and Scapy - that were used in this work.
2.1
Software Defined Networking
Software-Defined Networking (SDN) is an emerging networking paradigm [21]. This paradigm aims to change the limitations of the current network infrastructure. The fun-damental property of an SDN is the separation of the control and the data plane. Network control is logically centralized in a controller (SDN-controller) that has a global network view and control on the behaviour of the network devices (Figure 2.1). Logical central-ization does not imply that the control plane is centralized. It should be physically dis-tributed, to achieve responsiveness, reliability, and scalability goals. SDN allows network administrators to flexibly manage network devices (routers or switches) using software running on servers.
The main advantage of SDN is allowing programming the network through soft-ware applications development, using high level abstractions offered by the controller. Network-state oriented applications (e.g., routing and load-balancing) use these abstrac-tions to achieve the desired network behaviour without needing knowledge of the detailed physical configuration. It is the controller responsibility to install the network application logic in the switches, thus relieving the programmer from concerns regarding low level details.
Chapter 2. Background and related work 10
Network Infrastructure
Open southbound API
Controller Pla9orm Network Applica<on(s)
Open northbound API
Figure 2.1: Simplified view of an SDN architecture [21].
2.1.1
OpenFlow
OpenFlow is an open standard supporting the communication interface between the con-trol and forwarding planes of an SDN architecture. The main idea of OpenFlow is to give access to and facilitate manipulation of the forwarding plane of network devices and as such is the main enabler of an SDN. It provides an open interface to control how data packets are forwarded through the network, and a set of management abstractions used to control topology changes and packet filtering. The OpenFlow protocol specifies a set of instructions that can be used by an external application to program the forwarding plane of network devices.
OpenFlow consists of three parts (Figure 2.2):
1. Flow Tables installed on switches. The switch is informed how to process network flows by means of an action associated with each flow entry.
2. A Controller, which uses the OpenFlow protocol to communicate with switches to impose policies on flows. The OpenFlow protocol provides an open and standard way for the controller to communicate with switches and allows entries in the flow table to be defined externally.
Chapter 2. Background and related work 11
Flow
Table
OpenFlow Client HW SWOpenFlow Protocol
Secure Channel
(SSL)
SDN ControllerFigure 2.2: OpenFlow-enabled SDN devices.
3. A channel that connects the remote controller (remote control process) to switches and allows communication between them. The SSL protocol may be used to se-curely send commands and packets from the controller to switches using the Open-Flow protocol. Alternatively, this channel can also be based on TCP.
Priority IngressPort MACSrc MACDest Proto VlanID SrcIP DestIP SourcePort DestPort Actions
10000 * * * TCP * * 10.1.1.34/32 * * Forward to Port 1
1000 3 * * * * * 10.1.1.0/24 * * Forward to Port 2
100 * * * * 2500 * * * * Send to Controller
0 * * * * * * * * * OF Normal
Table 2.1: Simplified example of a flow table in OpenFlow switches.
Table 2.1 shows a simple example of an OpenFlow table present in OpenFlow switches. This table has the function to associate specific traffic to a (some) specific action(s). It is used by the controller to define the forwarding rules for each packet. A flow does not have to use strictly the packet headers as its match fields, since it can match a flow per Inport. Different priorities are defined to set the match order of a flow table.
Chapter 2. Background and related work 12 flows, it is sent to the controller (or it is dropped). This action depends on the mode of operation of the SDN, which can be either reactive or proactive. In reactive mode the non-matching packets are forwarded to the controller. In response, the controller installs the respective flow rules, avoiding packets with the same header to be forwarded to the controller. Next in proactive mode, if the switch receives a non-matching packet it will drop that packet. In this mode the controller install the flows proactively, restricting the network traffic to the desired configurations. This can be seen as a drawback since it does not allow new traffic in the network but, on the other end, it may became secure as it may avoid DoS attacks and prevents undesired traffic to travel through the network. For more details on OpenFlow, please see [1].
2.1.2
SDN controllers
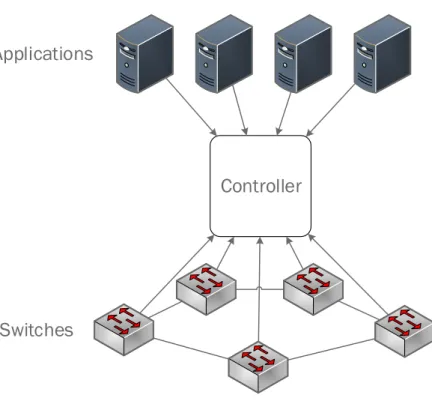
Controller
Applications
Switches
Figure 2.3: SDN basic architecture.
Since network control is moved to a logically centralized controller (Figure 2.3), this device is the core component of Software Defined Networks. It is located strategically in the SDN network, relaying information to the switches/routers “below” and the applica-tions and business logic “above”. This controller platform typically contains a collection of “pluggable” modules that can perform different network tasks. Some of the basic tasks include control on flow tables, keeping an inventory of what devices are within the
net-Chapter 2. Background and related work 13 work and the capabilities of each, and gathering network statistics. To make possible performing network-state abstractions and forwarding, a few SDN controllers have been proposed, including: NOX [15] [2], POX [2], Beacon [12], and FloodLight [3].
2.1.2.1 NOX
NOX [15] [2] was the first OpenFlow controller, so a significant amount of network ap-plications have been implemented on top of NOX. NOX allows developers to choose whether to build network applications with a developer-friendly language (Python), or high performance applications (using C++). NOX made three major contributions: a cen-tralized programming interface, a cencen-tralized policy based on a network filtering module, and explicit support for middleboxes. NOX supports a switch control abstraction where OpenFlow is the prevailing protocol. The NOX model is event-based allowing a pro-grammer to write an application by programming event handlers for the controller. On the other hand, NOX requires programmers to know and understand the semantics of low-level OpenFlow commands.
2.1.2.2 Beacon
Beacon [12] is a fast, cross-platform, modular, Java-based OpenFlow controller that sup-ports both event-based and threaded operation. Its applications are implemented as bun-dles, an abstraction of the OSGi framework [4]. These code bundles that can be started, stopped, refreshed, installed at runtime, without interrupting other non-dependent bun-dles. Unlike previous controllers that provided users and developers with either compilation-time modularity or start-compilation-time modularity, Beacon thus allows for run-compilation-time modularity. 2.1.2.3 Floodlight
Floodlight [3] is an open, free, Apache-licensed Java-based OpenFlow controller. Forked from Beacon, the Floodlight controller consists of a set of modules. Each module provides a service to the other modules and to the control logic application through either a simple Java API or a REST API. Unlike Beacon, OSGI support was removed for deployment and performance reasons.
Chapter 2. Background and related work 14
2.2
Network Monitoring
Network environments are growing more complex, but the need to provide a certain level of service stands. The exponential grow in data, the increasing number of devices, be-tween other factors, are the cause for the existing pressure placed on systems, networks and applications. A large slice of the work done nowadays by TI specialized teams is regular monitoring of systems and applications, granting a correct state to the organiza-tions and optimizing the resource usage. The monitoring systems thus represent a critical centerpiece of productivity.
The Simple Network Management Protocol (SNMP) [10] is the most commonly used protocol for network monitoring, but it is too coarse-grained. Among others, SNMP can be used to request per-interface port-counters and overall node statistics from a switch. Monitoring using SNMP is achieved by repeatedly polling the switch, which can cause switch performance degradation due to CPU overhead.
NetFlow [13] is more fine-grained, allowing measurements at the flow level, and scales better by using sampling approaches. It collects samples of network traffic and estimates overall flow statistics based on these samples. NetFlow assumes the collected packets to be representative of all traffic passing through the collector which may not be true. It uses a 1-out-of-n random sampling, meaning it only stores every n-th packet. Another drawback is that this solution is expensive by requiring dedicated hardware and specialized algorithms. Recent work [22] proposes to instrument switches with hash-based primitives to increase measurement accuracy, but these methods require hardware modifications that may not be available in regular switches soon.
SDN increases the flexibility of monitoring by offering a programmatic interface for fine-grained measurement. OpenFlow-based SDN switches expose a high level interface to the controller for per-flow and aggregate statistics collection. Network applications can use this interface to monitor network status and create a global view of the network. OpenFlow provides both pull- and push-based measurement techniques. The most typi-cal statistics collection mechanism is pull-based. Switches maintain per-port and per-flow rule counters that track the number of packets and bytes handled by each port and each flow rule, respectively. The controller can periodically query the switches about these statistics. The polling frequency determines the accuracy and overhead of the whole pro-cess. The push-based approach is based on packet-in and/or flow-remove Open-Flow messages. When a packet does not match any rule in the switch, the switch sends a packet-inmessage containing the packet header (and optionally part of the payload)
Chapter 2. Background and related work 15 to the controller. When the SDN is configured to work in reactive mode this allows moni-toring of all new flows. An alternative push-based approach is for the controller to request a switch to send a flow expiration message (flow-remove) whenever a flow expires.
Monitoring can also be done actively. On the control plane, the controller may peri-odically perform measurements of the network status. One example is through the trans-mission of probe packets to be forwarded by switches back to the controller. This implies injection of new traffic onto a network.
2.3
SDN-based monitoring frameworks
An already significative number of recent works have leveraged on SDN techniques to propose advanced network monitoring tools and mechanisms. A good amount of re-search has focused on the tradeoff between measurement accuracy and overhead/cost. As fine-grained monitoring is very challenging due to resource constraints (e.g., number of TCAM entries), several solutions have explored alternative hybrid designs.
iSTAMP [25] dynamically partitions the TCAM entries to allow both fine-grained and coarse-grained measurements. One partition aggregates measurements (helping the system scale), and another is used to provide accurate per-flow measurements for the most informative flows. iSTAMP then processes these aggregate and per-flow measurements to effectively estimate network flows using a variety of optimization techniques. An al-gorithm is proposed to intelligently select the most informative traffic flows.
Zhang [43] proposes an anomaly detector based on SDN principles (mainly the cen-tralized view of the network) that instructs a flow statistics collection module to provide fine-grained measurement data in case it is anticipating an attack, or to collect coarse-grained data otherwise.
Payless [11] provides a RESTful API for flow statistics collection at different ag-gregation levels. Payless presents techniques to compute throughput, both active and passive. It uses packet-in and flow-remove to get statistics passively, but it is adaptive since it uses an adaptive statistics collection algorithm that delivers highly accu-rate information in real-time without incurring significant network overhead. For instance flow-statistics-requestmessages are sent to the switches, but just if a flow is inserted for a longer time than a defined parameter. PayLess provides an abstract view of the network and a uniform way to request statistics about the resources. PayLess it-self is developed as a collection of pluggable components. Interaction between these
Chapter 2. Background and related work 16 components are abstracted by well-defined interfaces. Hence, one can develop custom components and plug into the PayLess framework.
DREAM [28] is a dynamic resource allocation measurement framework that bal-ances a user specified level of accuracy and resource usage for measurement tasks. Re-sources are dynamically deployed to achieve the desired level of accuracy. It ensures high accuracy for tasks, while taking network-wide resource constraints as well as traffic and task dynamics into account.
Conventional SDN techniques introduce delays that may be prohibitively high for particular network management tasks. To tackle this challenge, OpenSample [34] is a low-latency, sampling-based network measurement platform that leverages sFlow packet sampling to provide near–real-time measurements of both network load and individual flows. In order to deal with the sampling they use a collector. The rate of samples pro-duced by sFlow is not constant, it is equal to the packet rate on the port divided by the sampling rate. To overcome this limitation, the authors exploit the fact that each TCP packet carries a sequence number indicating the specific byte range the packet carries. Fortunately, when sFlow samples the header of TCP packets, this header also includes the TCP sequence numbers. So if two distinct packets from a given TCP flow are sampled, they can compute an accurate measure of the flow’s average rate during the sampling window by subtracting the two sequence numbers and dividing by the time between the samples. Exploiting TCP information drastically increases estimation accuracy for any given sampling rate. This TCP-aware sFlow analysis is the key innovation OpenSample incorporates compared to prior sFlow monitoring frameworks.
Planck [32] is a network measurement architecture that goes one step further, ex-tracting network information an order of magnitude faster than alternative approaches (including OpenSample). Planck leverages on the port mirroring capability that is present in commodity switches. Multiple ports are mirrored to the mirroring port that is then con-nected to a collector to aggregate information and send the required statistics to the SDN controller.
Other proposals aim to advance the measurement abstractions present in SDN-based systems. OpenSketch [41] proposes a flexible measurement API that, complementary to OpenFlow, separates the measurement control plane from the data plane. The objective is to provide flexibility for network measurement, and for that purpose it allows the op-erator to reprogram its measurement tasks. It adds a reconfigurable measurement logic to switches and exposes an interface to program it (in the same way OpenFlow allows for programming forwarding behavior). The main problem is the fact that it is based on a
Chapter 2. Background and related work 17 clean-slate redesign of portions of the switch hardware. It does entails the need to upgrade network nodes and to standardize this new protocol.
HONE [35] extends the scope of traffic management to the end-host networking stack, allowing joint host-network traffic management. It presents a uniform stack for a diverse collection of measurements in SDN-based systems.
2.4
SDN-based monitors
One of the first SDN-based monitors was OpenTM [36], an OpenFlow-based solution that estimates a traffic matrix by keeping track of statistics for each flow. OpenTM queries switches on regular intervals and stores the information needed to create the traffic matrix. More recently, OpenNetMon [37] was proposed as an open-source tool to measure throughput, packet loss, and delay. To measure delay, this platform installs rules in the entry and exit switches of a path to generate notifications (e.g., packet-in messages) to be sent to the controller. It then sends probes that match these monitoring rules, and from the received messages it infers path latency. In addition, OpenNetMon adapts the prob-ing frequency to the current estimated link utilization. In order to measure throughput, OpenNetMon uses an active approach and requests Per-flow statistics from the OpenFlow switches.
We selected OpenNetMon [37] as target for the attacks. Not only because it monitors three metrics at per-flow granularity – throughput, packet loss, and delay – whereas other proposals focus on a single metric, but also, because it is available open-source. We have used OpenNetMon, but several attacks are generic and will succeed against recent proposals.
SLAM [39] is a recent example of the generality of the techniques used by these platforms. It is another SDN-based framework dedicated to latency monitoring. The main method used is very similar to the one proposed by OpenNetMon for delay monitoring. SLAM improves over OpenNetMon by suggesting techniques to increase measurement accuracy. It also considers passive approaches that do not require the injection of “probes” but instead use unmatched application packets that are sent back to the controller for delay measurement.
Contrary to the previous approaches, FlowSense [40] is a passive technique used to estimate network performance. In FlowSense packet-in and flow-remove
mes-Chapter 2. Background and related work 18 sages are used to estimate per flow link utilization. The communication overhead is low, but the estimation is not as accurate as with the active approaches.
The novelty of this work we present in this thesis arises from the fact that none of the related research in this topic (including all work presented in this and the previous sections) has yet addressed security.
2.4.1
A more detailed view on OpenNetMon
OpenNetMon1 is an SDN application that runs on top of the Pox [2] controller and
per-forms adaptive monitoring of network path delay, flow throughput, and packet loss. It relies on a Pox service for link discovery, which provides knowledge about the network topology (e.g., switches and links between switches). OpenNetMon itself implements a learning service that discovers hosts and the switch ports they are connected to, along with a forwarding service that installs flow entries along the shortest paths between known source and destination hosts.
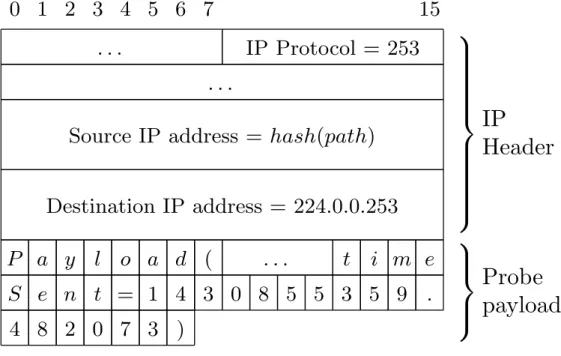
0 1 2 3 4 5 6 7
15
. . .
IP Protocol = 253
. . .
Source IP address = hash(path)
Destination IP address = 224.0.0.253
IP
Header
P a y l o a d (
. . .
t i m e
S e n t = 1 4 3 0 8 5 5 3 5 9 .
4 8 2 0 7 3 )
Probe
payload
Figure 1: Structure of a probe packet.
1
Figure 2.4: Structure of a probe packet.
When a data packet2 arrives at one of the switches and there is no match with the
installed flow rules, it is transmitted to the controller (as a Packet-In) where it is processed
1OpenNetMon is an open source SDN based monitoring solution. Available at:
https://github.com/TUDelftNAS/SDN-OpenNetMon
2For our purposes, we consider a data packet to be any Ethernet frame that is neither a LLDP or an ARP
Chapter 2. Background and related work 19 by OpenNetMon. OpenNetMon learns the packet source MAC (Media Access Control) address and maps it to the switch ingress port. In order to decide where to forward an unmatched packet (as a Packet-Out), OpenNetMon looks at its destination MAC address (MACdst) and performs one of two actions: 1) if MACdst has not been learned yet or
is a multicast address, it floods the packet through all ports of every connected switch except those ports that are part of inter-switch links to avoid loops; 2) if MACdst and
its respective port are known, OpenNetMon calculates the shortest inter-switch path that connects the entry and exit switches and installs a flow rule on every switch of the path. Then, it forwards the packet directly to the known port of the exit switch.
For the purpose of network monitoring, when installing a new data flow OpenNet-Mon adds additional monitoring rules on the switches along the path. Path delay is mea-sured periodically using an active probing strategy. A special probe packet 2.4 is trans-mitted to the ingress switch, which is then forwarded along the flow path until it reaches the egress switch where it is returned back to the controller by means of a packet-in message (using the a priori installed monitoring rules). This is the same technique used by other monitoring platforms, such as SLAM [39]. Flow throughput is obtained differently, using a query approach. The controller periodically requests counter values from the last switch of a given flow path. With each query, the controller receives the amount of bytes received and the duration of each flow, enabling it to calculate the effective throughput.
The frequency of measurement (in terms of probe transmission and query rate) varies accordingly to the combined throughput of all switches. The higher the throughput, the more frequent the values are collected.
2.5
Networking tools
In this work we used a few networking tools, which allowed us to create an emulated testbed, and perform the attacks on the monitoring system.
2.5.1
Mininet
Mininet [5] [16] is a realistic network emulator. Although Mininet virtualizations are created in software, they behave as the real hardware and have enabled the migration to hardware using unmodified code. In order to be able to emulate a full network it uses
Chapter 2. Background and related work 20 lightweight virtualization, which implies that the whole network can run in the same system. As a virtual platform it has advantages and disadvantages:
• It is fast to start a network as it uses container-based virtualization. Running a platform in a single system is convenient, but on the downside it can introduce resource limitations.
• It allows the creation of custom topologies to meet specific needs and it is possible to customize packet forwarding, since Mininet switches are programmable using the OpenFlow protocol. As disadvantage, it is based on a single Linux kernel for all virtual hosts, and as such it is impossible to run software for other OSes.
• As it is an emulator, Mininet runs real programs on the hosts, just as in a hardware platform, and so it makes it easy to port from the virtual environment to a physical deployment. But as Mininet is not a simulator, and it does not have a strong notion of time, which means that timing measurements may be skewed by external factors, so care needs to be taken.
2.5.2
Ettercap
Ettercap [6] is a free and open source security tool that allows man-in-the-middle attacks in LAN environments. It supports active and passive dissection of protocols (including encrypted / encapsulated) making it possible to listen to interfaces, intercept, change and even inject new packages. Ettercap allows running filters and plugins on the packets that pass through the interfaces. The language for programming filters and plugins in Ettercap is C.
Initially we implemented all the attacks in Ettercap, but we noticed that it inserted a high delay on the modified packets, which is a problem since the attacks should be precise. As alternative, we opted for Scapy, which not only performs much faster that Ettercap, but is actually simpler to use.
2.5.3
Scapy
Scapy [7] is a powerful interactive packet manipulation framework in Python that en-ables packet decoding, creation and modification. It supports a wide range of network protocols. Injected packets are created from scratch or can be modifications of received
Chapter 2. Background and related work 21 packets. Scapy can also handle and manipulate wireless communication packets, so there is not the restriction to work on wire.
After setting the context, in the next chapter we present attacks on SDN-based net-work monitors, in order to demonstrate the serious security vulnerabilities of these plat-forms.
Chapter 3
Network monitoring under attack
Network monitoring plays a fundamental role in many management tasks, as it collects and provides data about the current state of the network. Several network management applications act upon this information, namely: traffic engineering may reroute flows after an overload is observed in a link, to ensure that a previously agreed QoS level is maintained; a link is perceived as malfunctioning by a network diagnosis component after showing a high loss rate, and therefore is disconnected; a traffic shaper may throttle some flows if the associated counters indicate that they are consuming more than their share of the available bandwidth. These examples give evidence that, by manipulating the measurement data, an adversary can (indirectly) influence management decisions and consequently the behaviour of the network.
Based on this, we envision many attack scenarios where an adversary may gain some profit. Taking Eve as an example, and being eavesdropping the main goal, she could make several routes look overloaded (or loss) to force traffic to be forwarded over particular paths (or switches) she observes. She could also manipulate the contents of some packets if the associated flow is redirected to a previously compromised router. A black hole could remain undetected by silently dropping packets while ensuring the corresponding counters are maliciously updated. Alternatively, by falsely reporting some routers as lightly loaded, she could create an excess of packets to be directed towards a region of the network, with the consequence of packet drops (e.g., due to overflowed port queues).
Of course, in practice it will be challenging for an adversary to obtain the control needed to perform meaningful attacks, since measurement data is collected at different points. Moreover, the correlation of monitoring data can trigger an anomaly detector to indicate an attack is under way. However, even a localized attack can cause
Chapter 3. Network monitoring under attack 24 icant damage, and a stealthy attacker may remain unnoticed. We, therefore, argue that monitoring solutions need to be resilient from the ground-up to avoid being the target of compromising attacks.
In a network system, if routing decisions depend on the output of monitoring func-tions, and if they especially depend on the correctness of that output, then from a security point of view, the monitoring subsystem must be resilient to attacks. We posit that an adversary with few capabilities can successfully affect monitoring results and thus gain some measure of control over the network routing algorithms. The main idea is to report incorrect monitoring values to the controller, hence affecting possible reconfigurations of routing parameters on the data plane.
SDN
sender
receiver
Controller
A1
sender
receiver
…..
sw
1A1
A2
A3
…..
sw
nsw
2sw
iFigure 3.1: Overview of network and attackers.
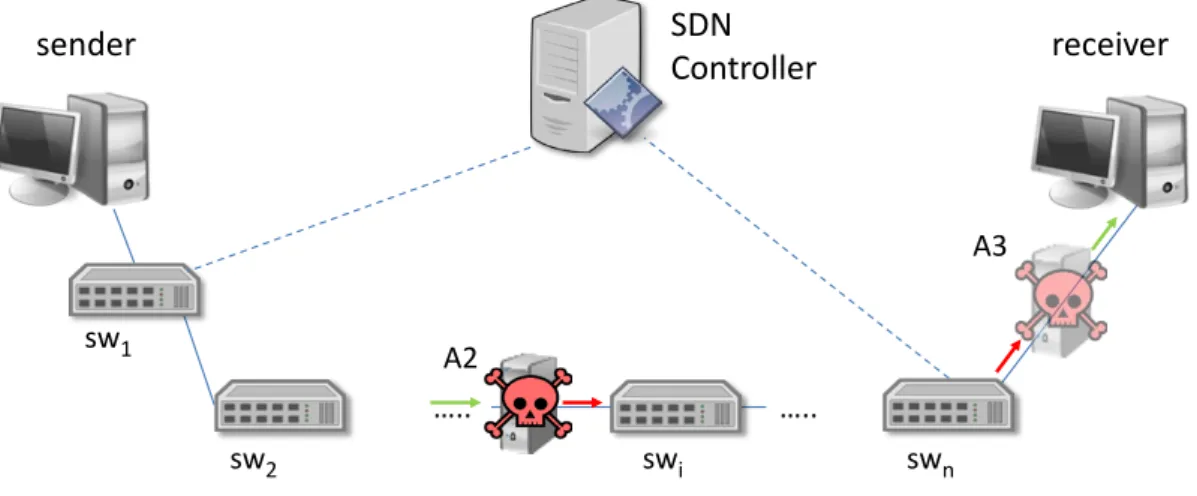
3.1
Threat model
We consider an adversary that wants to modify the measurement data retrieved on a net-work path between an ingress switch (sw1) and egress switch (swn), as depicted in
Fig-ure 3.1. We assume both switches support an SDN protocol (e.g., OpenFlow) and are therefore controlled remotely by an SDN controller. To form the end-to-end path these switches are connected by an arbitrary number of other components (e.g., routers and switches), that may or may not be SDN-capable. The monitoring application runs in the SDN controller, obtaining periodically from the SDN switches the counter values associ-ated with the flows.
A strong adversary can create a direct intrusion on a switch or the controller itself, and thus gain full control of the component, which simplifies the attack on the monitoring
Chapter 3. Network monitoring under attack 25 subsystem. Another strong attack could directly interfere with control plane communi-cations, but if we assume communication links between the controller and the switches are secure, and more importantly if they guarantee at least data integrity, then a weak adversary will not be able to use that avenue to attack.
We limit the adversary actions to the data plane, meaning that the links between the controller and the switches are considered secure (e.g., using SSL). Additionally, we as-sume the switches involved in the measurements (e.g., sw1and swn) operate accordingly
to their specification, i.e., they are not compromised by the adversary. This means that adversaries with further abilities may be able to expand the impact of our attacks.
Our adversary model includes attackers at multiple levels of sophistication, each one increasingly more powerful than the previous:
• A1: the adversary can insert arbitrary traffic in the target network, namely along the path we want to monitor;
• A2: the adversary can observe, insert, and modify the packets transmitted along the path;
• A3: this adversary is used together with A2, and she has the additional capability of dropping packets after swn.
In summary, we assume the attack surface to be solely the data plane of an SDN network. The attack vectors are the links between each pair of connected switches and the links between switches and connected hosts. Figure 3.1 illustrates these vectors.
3.2
Implementation
As stated, three types of adversary are considered in our attack model, with the ability of injecting, eavesdropping, modifying or dropping packets. In order to perform the attacker role, we implemented plugins for Scapy, a fast packet manipulation framework in Python. We have implemented several plugins during the course of our studies, but we will only focus on the ones that led to successful attacks. Each plugin was developed to a particular adversary, each with its different capabilities. The attacks are focused on the two most relevant metrics: path delay and link throughput. Here we present the generic implementation of the attacks. In Section 3.3 we go further in detail when needed.
Chapter 3. Network monitoring under attack 26
3.2.1
A1
plugins
The A1 adversary represented in Figure 3.2 has the sole capability of injecting arbitrary traffic into the network.
Attacking latency measuring
Probe injection attack
….. SDN Controller sw1 swn sender receiver sw2 swi ….. A1Figure 3.2: Adversary A1 injecting fake traffic. 3.2.1.1 Delay attack
This plugin injects packets similar to the probe used by the controller to actively measure delay between switches, but using a different (fake) timestamp in the payload (recall Figure 2.4). The major issue of this plugin is the need to guess the packet format (recall that this adversary does not have the capability to eavesdrop, but only inject packets). This is made easier if the controller is open source. With the capacity of eavesdropping the adversary A1 could easily create packets to inject, based on the network traffic he would observe.
3.2.1.2 Throughput attack
This plugin injects traffic that match a specific flow in order to artificially increase the throughput on that flow. Similar to the delay attack, the difficulty for the attacker is knowing the format of the flow in the network. With the capability to eavesdrop, it would be easy: it would merely be needed to inject duplicate packets.
Chapter 3. Network monitoring under attack 27
IPTABLES SCAPY - PLUGIN
ETH1 ETH0
Figure 3.3: Scapy plugin architecture.
3.2.2
A2
and A3 plugins
The A2 adversary represented in Figure 3.4 has higher capabilities, which allow him to inject, eavesdrop, modify or drop packets. This adversary needs two network interfaces and a bridge between them. As seen in Figure 3.3, in Scapy the packets that arrive at the interfaces of the attacker are sniffed, modified as needed by the plugin, and dropped by the IPTABLES (they are injected by Scapy in the correct interface avoiding duplicates).
Attacking throughput measuring
Traffic modification attack
….. SDN Controller sw1 swn sender receiver sw2 swi ….. A2 A3
Figure 3.4: Adversary A2 and (optional) A3 modifying traffic. 3.2.2.1 Delay attack
This plugin is the most powerful, allowing the modification of delay of the probe pack-ets. Special care is needed if this plugin is used to decrease the delay measured by the controller: the fake timestamp needs to be calculated in such a way to guarantee that the
Chapter 3. Network monitoring under attack 28 overall delay computed by the monitor does not have a negative value (as this would make the attack easy to spot). In our implementation, the inserted timestamp is based on the already existing one, plus a minimum calculated delay based on the passing traffic. 3.2.2.2 Throughput attack
This plugin has the same packet injection capability as adversary A1. It also allows to catch a packet and modify its fields, usually the source MAC address since it is not checked in most end-to-end applications. This modifications applies to each packet that goes through the attacker. A different MAC is used for each one, assuring each packet does not match in any of the switch flows. This modification causes the controller to install new flows per each modified packet.
As we can see in Figure 3.4, optionally a second attacker exists, removing the mod-ifications made by adversary A2 so that the receiver is completely oblivious to them. Adversary A3 employs a similar plugin as A2. This plugin has the option to modify or replace the correct state of the packet.
3.3
Attacking the monitor
This section presents a series of attacks that expose vulnerabilities of SDN-based monitor-ing platforms. We focus our attention in attacks that affect the measurement of path delay and throughput. We have chosen the recently proposed SDN-based monitoring applica-tion OpenNetMon [37], which is available open-source, to demonstrate the feasibility of the attacks. Most approaches used by this application are generic and have in fact been employed by other monitoring tools, such as SLAM [39].
3.3.1
Testing environment
We created two separate testing environments that share the simplified setup of Figure 3.1. As represented in Figure 3.5 the main modification was that only two switches were uti-lized, swentry and swexit. The three attackers were connected to swexit. In addition,
attacker A2 is connected to switch swentryand attacker A3 is connected to the receiver.
The first environment is based on the Mininet [16] emulator, allowing an evaluation based on software switches (namely, Open vSwitch [29]). The second environment is
Chapter 3. Network monitoring under attack 29
SDN
controller
A1
sender
receiver
A1
A2
A3
bridge
sw
entry
sw
exit
bridge
Figure 3.5: Testbed used in the experiments.
a real testbed platform with physical OpenFlow switches and separate machines for the controller, hosts and attackers. In both environments, we used Pox (version “eel”) because OpenNetMon is an application that runs on this controller. The communications between the controller and the switches were made using OpenFlow v1.0 (the version supported by Pox).
For the Mininet environment, we run the network and nodes as separate processes on a Dell R320 server. The experiments were performed with Mininet v2.2.1 and Open vSwitch v2.3.1. In the testbed environment, we deployed two Pica8 P3297 switches with 4K TCAM entries1 and 1 Gbps links. The controller, hosts and attackers were separate
Dell machines. Attackers A2 and A3 were implemented in dual homed machines and they used Ethernet bridging to forward the traffic between network boards. With bridging, the adversary gains the capability to intercept, modify and drop packets while staying “transparent” to the rest of the network, i.e., there is no advertising of MAC/IP addresses. We used iptables together with Scapy v2.2.0 [7] to eavesdrop and inject arbitrary packets.
3.3.2
Attacking delay measurements
Measuring inter-switch link delays is not an easy task because it is often hard to define arbitrary starting and ending points in the network. SDNs help overcome this problem: due to the separation of the control and data planes, it is possible by design to reach any switch in the network from a single central point (the controller). This allows for
Chapter 3. Network monitoring under attack 30 an accurate representation of inter-switch links when starting a new delay measurement. Estimating the total path delay of a given flow in an OpenFlow network, for example, comes down to the controller tracking a packet that traverses, in order, the set of switches composing the flow path.
Probing for latency measurements
Controller
Switch 1
Switch 2
PACKET_OUT probe PACKET_IN probe forward probeFigure 3.6: Delay measurement.
Active monitoring is the predominant approach for measuring the path delay in SDN-based monitoring solutions. The controller installs forwarding rules in the switches, and then inserts a probe in the data plane directed back to itself, while keeping track of the departure and arrival instants. The delay is calculated by subtracting the two instants. To improve the accuracy of the measurement, the controller might also get an estimate of transmission time between itself and the entry/exit switches and perform the appropriate correction on the delay. OpenNetMon operates exactly in this manner, storing the depar-ture timestamp inside the probe (as seen in Figure 2.4). In this manner, when the probe returns, OpenNetMon gets a new timestamp and uses it to determine the flow path delay. This solution is relatively simple and recovers easily from packet drops – a lost probe is a single measurement sample that goes missing.
In this attack, the adversary objective is to force an incorrect calculation of the path delay, either by increasing or decreasing the calculated time interval. For this purpose, our
Chapter 3. Network monitoring under attack 31 attacker either inserts a fake probe or modifies the original. We consider two scenarios, presented in increasing order by attacker strength.
3.3.2.1 Injection
Adversary A1 generates and sends a malicious probe to one of the switches, causing an erroneous delay to be calculated on its arrival at the controller. To forge the probe, she fills the header fields exactly as OpenNetMon: (a) in the Ethernet header, the MAC addresses are the MACs of the sender and receiver hosts; (b) in the IP header, the source is an hash of the identifiers of all switches in the path. This hash is employed by the monitoring rules (pre-installed by OpenNetMon) to decide how the probe should be forwarded.
15
35
55
75
95
115
0
20
40
60
80
de
la
y
(m
s)
time (s)
Figure 3.7: Increasing delay with probe injection (Mininet).

![Figure 2.1: Simplified view of an SDN architecture [21].](https://thumb-eu.123doks.com/thumbv2/123dok_br/15493052.1042450/32.892.247.619.218.479/figure-simplified-view-sdn-architecture.webp)