Multi-pumping flow system for the determination of
dissolved orthophosphate and dissolved organic
phosphorus in wastewater samples
Carmen Pons
a, Ildik´o V. T´oth
b, Ant´onio O.S.S. Rangel
b,
Rafael Forteza
a, V´ıctor Cerd`a
a,∗aDepartment of Chemistry, University of the Balearic Islands, Carretera de Valldemossa Km.7.5, E-07122 Palma de Mallorca, Spain bEscola Superior de Biotecnologia, Universidade Cat´olica Portuguesa, Rua Dr. Ant´onio Bernardino de Almeida, 4200-072 Porto, Portugal
Abstract
A multi-pumping flow system (MPFS) for the spectrophotometric determination of dissolved orthophosphate and dissolved organic phosphorus in wastewater samples is proposed. The determination of orthophosphate is based on the vanadomolybdate method. In-line ultraviolet photo-oxidation is employed to mineralise organic phosphorus to orthophosphate prior to detection. A solenoid valve allows the deviation of the flow towards the UV-lamp to carry out the determination of organic phosphorus.
Calibration was found to be linear up to 20 mg P L−1, with a detection limit (3sb/S) of 0.08 mg P L−1, an injection throughput of 75 injections h−1and a repeatability (R.S.D.) of 0.6% for the direct determination of orthophosphate. On the other hand, calibration graphs were linear up to 40 mg P L−1, with a detection limit (3sb/S) of 0.5 mg P L−1, an injection throughput of 11 injections h−1 and a repeatability (R.S.D.) inferior to 2.3% for the procedures involving UV photo-oxidation.
Keywords: Multi-pumping flow system; Orthophosphate; Organic phosphorus; UV photo-oxidation
Introduction
The determination of phosphorus is a subject of great interest in the environmental field. This element is an essential nutrient for the growth of plants and animals and it plays a major role in the process of eutrophication[1,2].
In water samples, phosphorus can be found in particulate and dissolved forms and in several organic and inorganic forms. Total dissolved phosphorus (TDP), dissolved reactive phospho-rus (DRP), dissolved organic phosphophospho-rus (DOP) and dissolved acid-hydrolyzable phosphorus (DAHP) are the fractions com-monly used to characterize dissolved phosphorus.
Batch methods for the determination of phosphorus species involve tedious and time-consuming steps. By contrast, flow techniques provide precise, accurate and rapid phosphorus deter-mination with a minimal sample handling. Thus, several
meth-∗Corresponding author. Tel.: +34 971 173261; fax: +34 971 173426. E-mail address:[email protected](V. Cerd`a).
ods based on flow injection analysis (FIA) have been reported for the determination of phosphorus. In these applications, various digestion methods such as UV photo-oxidation[3–5]
or microwave digestion [6,7] have been successfully imple-mented. However, one of the main shortcomings of FIA is its high reagent consumption with regard to multicommuted flow techniques such as multicommuted flow injection analy-sis (MCFIA)[8], multi-syringe flow injection analysis (MSFIA)
[9]and multi-pumping flow systems (MPFS)[10]. Taking into account that multicommuted flow techniques allow to reduce reagent consumption and the generation of toxic wastes, they can be regarded as an environmentally friendly alternative to conventional FIA[11]. Therefore, the green analytical proce-dure based on MSFIA for the determination of total phosphorus developed by Almeida et al.[12]should be pointed out. MPFS is the youngest multicommuted technique. In MPFS, a series of individual solenoid micro-pumps act as liquid-propelling units. These micro-pumps provide a non-metallic, inert, fluid path, therefore ideal for dispensing high-purity or aggressive fluids.
Fig. 1. Experimental MPFS set-up proposed for the determination of orthophosphate and organic phosphorus. S: sample; C: Carrier; R: Chromogenic reagent; P: Persulphate solution; DB: Debubbler; W: Waste; D: Detector; M1–M4: micro-pumps V1: commutation valve; C1–C3: cross-junctions.
A single device is responsible for both sample–reagent introduc-tion and for manifold commutaintroduc-tion. Other advantages of MPFS are the simplicity of the manifold and the possibility to develop fully automated systems. Furthermore, MPFS is more versa-tile than MSFIA since there is no need for an injection coil or periodic unloading of the liquid driver. However, only a few applications of MPFS are found in the literature.
On the other hand, spectrophotometry is by far the most com-mon detection technique used in flow analysis since the required instrumentation is simple, robust and can be easily adapted to perform the analysis in situ. Spectrophotometric methods for the determination of phosphate usually involve the reaction between orthophosphate ions with molybdate in acidic conditions in order to form a heteropolyacid. In this sense, the vanadomolybdate, the malachite green and the Molybdenum Blue methods should be highlighted[12]. Though the sensitivity given by the vanado-molybdate method is generally less than that for the malachite green or the Molybdenum Blue methods, it is quite tolerant of interfering ions and no precipitates are formed during the reac-tion or in storage. For this reason, the vanadomolybdate method is especially suitable to carry out the determination of phosphate in wastewater samples[13]. Moreover, the long reagent lifetime of this method makes it very appropriate for on-line monitoring applications[14,15].
In this paper, a novel combination of MPFS technique with a UV reactor for the spectrophotometric determination of DRP and DOP using the vanadomolybdate method is described. This methodology was applied to wastewater samples.
Experimental
Reagents
All chemicals were of analytical reagent grade. For prepara-tion of all soluprepara-tions Millipore-purified water was used.
Stock standard solution of orthophosphate (1000 mg P L−1) was prepared from potassium dihydrogen phosphate (Sigma).
Working standards were prepared daily by diluting the stock solution.
The vanadomolybdate reagent was prepared by dissolv-ing ammonium molybdate ((NH4)6Mo7O24·4H2O, Panreac)
and ammonium vanadate (NH4VO3, Merck) in 0.5 mol L−1
hydrochloric acid (Panreac). The final concentration of ammo-nium molybdate and ammoammo-nium vanadate in the chromogenic reagent was 0.05 and 0.00375 mol L−1, respectively. The carrier was 0.2 mol L−1hydrochloric acid (Panreac).
A range of phosphorus compounds was analysed in order to test the efficiency of UV photo-oxidation. Standard solutions of model phosphorus compounds were prepared by dilution of stock solutions (250 mg P L−1) of␣-d-glucose-1-phosphate, disodium phenylphosphate dihydrate, glycerol-2-phosphate dis-odium salt, phosphonoformic acid, sdis-odium triphosphate hexahy-drate and disodium pyrophosphate (Sigma).
The oxidant agent used to carry out UV photo-oxidation was prepared by dissolving potassium peroxydisulfate (25 g L−1) (Sigma) in 0.3 mol L−1sulphuric acid (Panreac).
Instrumentation and ”ow manifold
The MPFS system used for the determination of orthophos-phate and organic phosphorus is shown inFig. 1.
The system is constituted by four solenoid micro-pumps (M1–M4) (Bio-Chem Valve Inc., Boonton, NJ, USA)[16]and a solenoid valve (V) (Takasago Electric Inc, Nagoya, Japan)[17]. Solenoid micro-pumps and valves are controlled in the same way. For this purpose, an I/O digital card, which has eight opto-coupled digital input channels and eight digital relay output channels, is used. This card is connected to a personal computer through an RS485/RS232 interface. This system can indepen-dently regulate the function of up to eight solenoid micro-pumps and/or valves. These devices are set on a motherboard connected to a protection interface, which is connected to the relay out-puts. An additional power source of 12 V is required to activate the solenoid devices. The power source, the RS serial
inter-Table 1
Results of the re-calibrations of the micro-pumps
Micro-pump Mean stroke volume (L) n R.S.D. (%)
M1 20.9 8 2.5
M2 30.1 9 2.3
M3 8.7 7 7.0
M4 28.8 8 3.1
R.S.D.: relative standard deviation; n: number of re-calibrations. Re-calibrations were performed once a week as it is described elsewhere[18].
face and the I/O cards have been integrated into a module1 (Sciware, Palma de Mallorca, Spain). When valves are used, a solenoid protection system (Sciware, Palma de Mallorca, Spain) is required in order to minimize heat generation and prolong the lifetime of the valves.
The indicated stroke volume for micro-pump M1 is of 20L (Ref. 120SP12-20), for M2 and M4 is of 25L (Ref. 120SP12-25) and for M3 is of 8L (Ref. 090SP12-8). The need to re-calculate the stroke volume indicated by the micro-pumps has been pointed out elsewhere[18]. The re-calculated stroke vol-umes and the results of consecutive re-calibrations are shown in
Table 1. From the results obtained it can be concluded that the dispensing precision of the larger pumps is better.
For instrumental control, data acquisition and processing, the software package AutoAnalysis2developed for flow techniques was used[19].
The photo-oxidation reactor consists of a 8-W mercury lamp (λmax= 254 nm) with a 300 cm length Teflon tube (0.8 mm i.d.) wound directly around it. The reactor was placed in a laboratory-made fan ventilated box in order to prevent operator exposure to UV radiation.
Bubbles formed during photo-oxidation are removed from the flow system using a Trace-trap debubbler (Trace Analytics, Germany)[20]with a 1.5 mm width PTFE membrane.
The optical part of the system consists of a deuterium-halogen light source (Mikropack, Germany) [21]. The light from the lamp is brought into a glass flow cell (18L inner volume and 1 cm optical path; Hellma, M¨ullheim, Germany) through a optical fiber with a bundle diameter of 400m (Ocean Optics, Dunedin, FL, USA). The transmitted radiation is carried to the detector through another optical fiber with a bundle diameter of 400m. As detector, a USB 2000 miniature fiber optic spec-trometer (Ocean Optics, Dunedin, FL, USA) was used [22]. Dual-wavelength spectrophotometry (420 and 700 nm) is used to minimize Schlieren effect.
The manifold was constructed with 1.5 mm i.d. (used for connecting the reagents with the inlet of the micro-pumps) and 0.8 mm i.d. (used for the rest of the system) poly(tetrafluoroethylene) (PTFE) tubes.
Procedure
In the system four solenoid micro-pumps (M1–M4) and a solenoid valve (V1) were used. These micro-pumps (M1–M4)
1 May be requested athttp://www.sciware-sl.com;[email protected]. 2 See footnote 1.
were responsible for the insertion of the sample, the carrier, the chromogenic reagent and the oxidant agent, respectively.
Two procedures were proposed. One procedure was used for the direct determination of DRP and the other one was used for the determination of DOP + DRP.
The procedure for the direct determination of DRP is shown inFig. 2. Thus, the sample is inserted into the system, it is mixed with the chromogenic reagent in the knotted reactor and delivered to the detector.
For the determination of DOP (Fig. 3), the UV photo-oxidation of organic phosphorus into orthophosphate prior to analysis is required. For this purpose, valve V1 is in the On position which allows to direct the flow to the UV-lamp and the oxidant stream contained by micro-pump M4 is inserted into the system. The oxidant agent and the sample are mixed in the photo-oxidation reactor. Then, the flow is stopped for 4 min. Afterwards, the mineralised sample is mixed with the chro-mogenic reagent and propelled to the detector. The concentration of orthophosphate in the mineralised sample (i.e. DOP + DRP) can be calculated from the peak height absorbance at 420 nm. DOP is obtained by subtracting DRP (calculated directly,Fig. 2) from DOP + DRP.
Sample conditioning
The wastewater samples were filtered through a membrane filter of 0.45m pore size prior to analysis so that only the soluble fraction was analysed.
Results and Discussion
Optimisation of experimental parameters
The influence of several physical and chemical parameters was evaluated following the univariate method.
The effect of sample volume on peak height absorbance was investigated in the range of 0.1–0.4 mL. Analytical signal increased with increasing sample volume up to 0.3 mL, above which it remained constant. A sample volume of 0.3 mL was chosen as providing both good repeatability and a high analyti-cal signal.
Different volumes of chromogenic reagent within the range 0.1–0.4 mL were tried in order to investigate their effect on sig-nal response. A chromogenic reagent volume of 0.3 mL was selected for subsequent experiments since it provided the best repeatability.
The effect of the length of the reaction coil was evaluated from 25 to 150 cm using coiled and knotted reactors. Analytical signal increased when knotted reactors were used. In this sense, the advantages of the use of knotted reactors over coiled reac-tors are noteworthy[23]. The peak height absorbance increased with increasing reactor length up to 100 cm. Above this length, analytical signal slightly decreased. Thus, a 100 cm length reac-tor was chosen for subsequent experiments since it provided the highest analytical signal together with a good repeatability.
The influence of the concentration of ammonium molyb-date and ammonium vanamolyb-date in the chromogenic reagent
Fig. 2. Flow diagram for the determination of orthophosphate.
was evaluated within the ranges 0.01–0.1 mol L−1 and 2.5× 10⁻⁴–0.01 mol L−1, respectively (Fig. 4). As the concen-tration of ammonium molybdate or ammonium vanadate was increased, analytical signal was increased. The optimum reagent concentrations were chosen as 0.05 mol L−1 molybdate and 3.75× 10⁻³mol L−1vanadate since it was observed that higher reagent concentrations provided high blank signals.
Flow-rates within the range 1–5 mL min−1 were tested for the insertion of the chromogenic reagent (its concentration was increased proportionally) in order to decrease the dilution of the
sample. As the flow rate decreased, an increase in peak height was found. A flow-rate of 2.5 mL min−1was selected since blank signal was increased above this flow-rate.
A solution of hydrochloric acid was used as carrier stream. Hydrochloric acid concentration was optimised in the range 0–0.8 mol L−1. A concentration of 0.2 mol L−1was chosen for subsequent experiments as it gave the best blank signal together with a good repeatability.
A study of the effect of irradiation time and oxidant agent concentration was carried out in order to evaluate the
Fig. 4. Effect of the concentration of ammonium molybdate and ammonium vanadate in the chromogenic reagent.
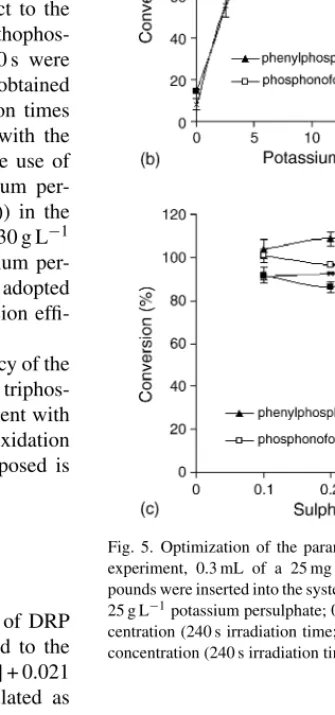
oxidation efficiency (Fig. 5). For this purpose, several phospho-rus model compounds were analysed. Conversion percentages of the model compounds were calculated with respect to the analytical signal given by an equivalent potassium orthophos-phate standard. Irradiation times between 0 and 240 s were tried (Fig. 5(a)). The best conversion efficiency was obtained within the range 200–240 s. However, these irradiation times cause the formation of air bubbles, which interfere with the spectrophotometric determination. For this reason, the use of a debubbler was required. Concentrations of potassium per-oxydisulfate (Fig. 5(b)) and sulphuric acid (Fig. 5(c)) in the oxidant stream were optimized within the ranges 0–30 g L−1 and 0.1–0.5 mol L−1, respectively. A 25 g L−1 potassium per-oxydisulfate solution in 0.3 mol L−1sulphuric acid was adopted as oxidant stream since it gave the maximum conversion effi-ciency.
However, at these conditions the conversion efficiency of the condensed phosphates tested (i.e. pyrophosphate and triphos-phate) did not exceed 5%. This fact is in good agreement with the results obtained in other works in which UV photo-oxidation was used [3,24]. In this sense, the methodology proposed is selective for DOP.
Analytical parameters Direct determination of DRP
The calibration graph for the direct determination of DRP was run in the range 0.08–20 mg L−1, and conformed to the equation peak height absorbance = 0.0296[P (mg L−1)] + 0.021
r2= 0.9996; n = 8. The detection limit (LOD), calculated as
3sb/S, where sbis the standard deviation for 10 measurements
of the blank and S is the slope of the calibration graph, is 0.08 mg L−1. The repeatability (R.S.D.) calculated from 10 successive injections of a 15 mg P L−1 standard solution of orthophosphate was 0.6%. An injection throughput of 75 injec-tions h−1was achieved.
Procedures involving UV photo-oxidation
Calibration graphs for organic phosphorus model compounds and orthophosphate in the concentration range of 0.5–40 mg L−1
Fig. 5. Optimization of the parameters involved in photo-oxidation. For this experiment, 0.3 mL of a 25 mg P L−1 solution of phosphorus model com-pounds were inserted into the system. Irradiation time (experimental conditions: 25 g L−1potassium persulphate; 0.4 mol L−1sulphuric acid); Persulphate con-centration (240 s irradiation time; 0.4 mol L−1sulphuric acid); Sulphuric acid concentration (240 s irradiation time, 25 g L−1potassium persulphate).
were run using UV photo-oxidation (Table 2). The detection limit (LOD), calculated as 3sb/S, where sbis the standard
devi-ation for 10 measurements of the blank and S is the slope of the calibration graph, is 0.5 mg L−1. An injection throughput of 11 injections h−1was achieved.
Interference studies
The effect of potential interferent ions on the determination of orthophosphate has been investigated at the 5% interference
Table 2
Analytical parameters obtained for phosphorus model compounds using UV photo-oxidation
Phosphorus compound Equation calibration graph n r2 Repeatability (expressed as R.S.D., %)a
Orthophosphate Absorbance = 0.0114[P (mg L−1)] + 0.0362 6 0.9999 2.2
Phenylphosphate Absorbance = 0.0112[P (mg L−1)] + 0.0314 6 0.9977 2.0
d-Glucose-1-phosphate Absorbance = 0.0102[P (mg L−1)] + 0.0362 6 0.9996 2.2 Phosphonoformic acid Absorbance = 0.0109[P (mg L−1)] + 0.033 6 0.9991 2.3 Glycerol-2-phosphate Absorbance = 0.0106[P (mg L−1)] + 0.0367 6 0.9997 1.9
aThe repeatability (R.S.D.) was calculated from 10 successive injections of a 25 mg L−1P standard solution.
Table 3
Tolerance level of several species in the determination of orthophosphate (15 mg L−1P)
Ion added Tolerated concentration (mg L−1)
Iron(II) 75 Iron(III) 200 Carbonate >500 Sodium >500 Potassium >500 Chloride >500 Sulphate >500 Nitrite >500 Nitrate >500
Silicate (expressed as Si) 8
level (Table 3). The ions tested are those commonly found in wastewater. For this study, 0.3 mL of a 15 mg P L−1 standard solution of orthophosphate was injected. The strongest interfer-ence corresponds to silicate, which also forms the well-known heteropolyacid with molybdate.
Analysis of samples
The accuracy of the proposed method was tested by the anal-ysis of several wastewater samples. Three replicates of each sample were analyzed.Table 4shows a comparison of results for the determination of DRP in wastewater by a conventional batch digestion method with those obtained by the proposed MPFS system. The Student’s t-test method indicates that there was no difference between the results obtained from both
pro-Table 4
Determination of DRP in wastewater samples (mg L−1) using the APHA–AWWA–WPCF reference method[25]and the proposed MPFS method
Sample Batch standard method Proposed method
Inlet 6.37± 0.08 6.7± 0.2
Primary outlet 10.0± 0.2 9.4± 0.3
Secondary outlet 3.82± 0.09 4.10± 0.16
Tertiary outlet 4.10± 0.13 4.38± 0.13
Results are expressed as the mean of three determinations± standard deviation.
cedures (at the 0.05% significance level and four degrees of freedom).
A batch reference method[25]was used for the determina-tion of total dissolved phosphorus. Studies on the hydrolysis of condensed phosphates in wastewater samples reveal that hydrol-ysis is complete or nearly so by the time the effluent reaches the wastewater treatment plant [26–28]. For this reason, the measurement of TDP in wastewater treatment plant effluents is practically equivalent to the amount of DRP + DOP. On the other hand, the Student’s t-test for mean comparison did not reveal any statistically significant difference at the 0.05 significance level between the results obtained in the determination of TDP and those obtained in the determination of DRP. Thus, phosphorus was only present as orthophosphate in the samples analyzed. To test the applicability of the developed system under different conditions, wastewater samples were spiked with organic phos-phorus compounds, according toTable 5. The obtained recovery percentages for the determination of DOP are also presented in the same table. Recoveries within the range 93–105% were observed for the organic phosphorus compounds tested.
Table 5
Results of the determination of DOP in spiked wastewater samplesa
Sample Added organic phosphorus standard (mg P L−1) DOP found Recovery (%)
Phen d-Gluc Phosph Glycer
Inlet 10 10.5± 0.2 105.3 Primary outlet 5 10 14.1± 0.6 94.1 Secondary outlet 2.5 2.5 4.7± 0.2 93.3 Secondary outlet 2.5 2.5 2.5 2.5 9.8± 0.4 97.5 Tertiary outlet 10 10 19.2± 0.8 96.3 Tertiary outlet 2.5 5 7.0± 0.2 94.0
Results are expressed as the mean of three determinations± standard deviation Phen: disodium phenylphosphate dihydrate; d-Gluc: ␣-d-glucose-1-phosphate; Phosph: phosphonoformic acid; glycer: glycerol-2-phosphate disodium salt.
Conclusions
A simple, low cost, robust and environmentally friendly method, which combines MPFS technique with a UV reac-tor has been developed. This method has been optimised and applied to the determination of DRP and DOP in wastewater samples.
In order to obtain a better LOD and injection throughput when only the determination of DRP is required, two different procedures were proposed (one for the direct determination of DRP and the other one for the determination of DRP + DOP).
A solenoid valve allows the deviation of the flow towards the UV reactor when the determination of DOP is required. In com-parison with batch reference methods, time-consuming steps are avoided by the use of MPFS. Moreover, a minimal reagent con-sumption is achieved since each micro-pump acts individually in the propulsion of the fluids and reagents are only inserted into the system when necessary.
Acknowledgements
The authors are grateful to the MCyT (Ministerio de Ciencia y Tecnolog´ıa) for supporting the project CTQ2004-01201, and to CRUP (Conselho de Reitores das Universidades Portugue-sas) through Acc¸˜ao Integrada Luso-Espanhola no. E-146/04. Carmen Pons thanks to MCyT for the allowance of a Ph.D. grant. Ildik´o T´oth thanks Fundac¸˜ao para a Ciˆencia e a Tec-nologia (FCT) and FSE (III Quadro Comunit´ario) for the grant SFRH/BPD/5631/2001. The authors are also grateful to EDAR-1 (Palma de Mallorca) for supplying the wastewater samples.
References
[1] L.M.L. Nollet, Handbook of Water Analysis, Marcel Dekker, New York, 1999, p. 273.
[2] J.M. Estela, V. Cerd`a, Talanta 66 (2005) 307.
[3] M.D. Ron Vaz, A.C. Edwards, C.A. Shand, M. Cresser, Talanta 39 (1992) 1479.
[4] R.L. Benson, I.D. McKelvie, B.T. Hart, Y.B. Truong, I.C. Hamilton, Anal. Chim. Acta 326 (1996) 29.
[5] T. P´erez-Ruiz, C. Mart´ınez-Lozano, V. Tom´as, J. Mart´ın, Anal. Chim. Acta 442 (2001) 147.
[6] K.E. Williams, S.J. Haswell, D.A. Barclay, G. Preston, Analyst 118 (1993) 245.
[7] R.L. Benson, I.D. McKelvie, B.T. Hart, I.C. Hamilton, Anal. Chim. Acta 291 (1994) 233.
[8] B.F. Reis, M.F. Gin´e, E.A.G. Zagatto, J.L.F.C. Lima, R.A. Lapa, Anal. Chim. Acta 293 (1994) 129.
[9] B. Horstkotte, O. Elsholz, V. Cerd`a, J. Flow Injection Anal. 22 (2005) 99.
[10] J.L.F.C. Lima, J.L.M. Santos, A.C.B. Dias, M.F.T. Ribeiro, E.A.G. Zagatto, Talanta 64 (2004) 1091.
[11] V. Cerd`a, C. Pons, Trends Anal. Chem. 25 (2006) 236.
[12] M.I.G.S. Almeida, M.A. Segundo, J.L.F.C. Lima, A.O.S.S. Rangel, Talanta 64 (2004) 1283.
[13] A. Mu˜noz, F. Mas-Torres, J.M. Estela, V. Cerd`a, Anal. Chim. Acta 350 (1997) 21.
[14] M. Bowden, M. Sequeira, J.P. Krog, P. Gravesen, D. Diamond, J. Env-iron. Monit. (2002) 767.
[15] M. Bowden, D. Diamond, Sens. Actuators B 90 (2003) 170. [16] http://www.bio-chemvalve.com/biochem-valve.html. [17] http://www.takasago-elec.co.jp/cgi-bin/en/index03.html.
[18] C. Pons, R. Forteza, V. Cerd`a, Anal. Chim. Acta 550 (2005) 33. [19] E. Becerra, A. Cladera, V. Cerd`a, Lab. Robot. Automat. 11 (1999) 131. [20] http://www.trace.de/en/onlinemessung/Blasenfalle.html.
[21] http://www.mikropack.de/e/tfm/. [22] http://www.oceanoptics.com/.
[23] Z. Fang, Flow Injection Separation and Preconcentration, VCH, Ger-many, 1993, p. 36.
[24] O. Tue-Ngeun, P. Ellis, I.D. McKelvie, P. Worsfold, J. Jakmunee, K. Grudpan, Talanta 66 (2005) 453.
[25] American Public Health Association, American Water Works Associa-tion and Water PolluAssocia-tion Control FederaAssocia-tion (APHA–AWWA–WPCF), Standard Methods for the Examination of Water and Wastewater, 20th ed., APHA–AWWA–WPCF, Washington, DC, 1998.
[26] D. Jolley, W. Maher, P. Cullen, Water Res. 32 (1998) 711. [27] B. Roig, C. Gonzalez, O. Thomas, Talanta 50 (1999) 751.
[28] D.J. Halliwell, I.D. McKelvie, B.T. Hart, R.H. Dunhill, Water Res. 35 (2001) 448.