Earthquake Mitigation in the Lisbon and Lower Tagus Valley area, Portugal
Carvalho, J., Dias, R., Pinto, C., Cunha, T., Leote, J., Laboratório Nacional de Energia e Geologia, Vilanova, S., Narciso, J., Instituto Superior Técnico, Borges, J., CGE/Univesity of Évora, Ghose, R., Delft University of Technology
Copyright 2013, SBGf - Sociedade Brasileira de Geofísica This paper was prepared for presentation during the 13th
International Congress of the Brazilian Geophysical Society held in Rio de Janeiro, Brazil, August 26-29, 2013. Contents of this paper were reviewed by the Technical Committee of the 13th
International Congress of the Brazilian Geophysical Society and do not necessarily represent any position of the SBGf, its officers or members. Electronic reproduction or storage of any part of this paper for commercial purposes without the written consent of the Brazilian Geophysical Society is prohibited.
____________________________________________________________________
Abstract
The capital city of Lisbon and the Lower Tagus Valley region of central Portugal mainland are located in the Eurasian plate about 350 Km from the approximately E-W oriented Eurasia-Africa plate boundary. It is characterized by low slip-rates (<0.4 mm/year) and a moderate seismicity, occasionally shaken by some important historical earthquakes causing significant damages and economical losses. The most well know damaging earthquakes occurred in 1344, 1531, 1755, 1909 and 1969. The seismic hazard evaluation and mitigation of the area is therefore of great importance to this densely populated area. This paper focuses the evaluation of P-wave and S-P-wave seismic velocities of the shallowest surface using seismic refraction data interpretation and in-situ lithostratigraphic studies to obtain geotechnical parameters such as Vp/Vs ratios and the Poisson coefficient, estimated to provide information for future site effect studies and preliminary VS30 and soil classification maps. The information will also be used to correct earthquake records since this information was also collected close to the location of seismological stations. The soil classification is based upon the European Code 8 for civil engineering which was carried out for land use planning and design of critical facilities. Hundreds of available boreholes drilled for engineering (with SPT data) and water supply were used to confirm layer thicknesses and lithologies at depth together with a detailed geological survey of each profile area. It is the first time VS30 maps and a soil classification based on geophysical and geotechnical parameters is attempted for this highly populated region.
Introduction
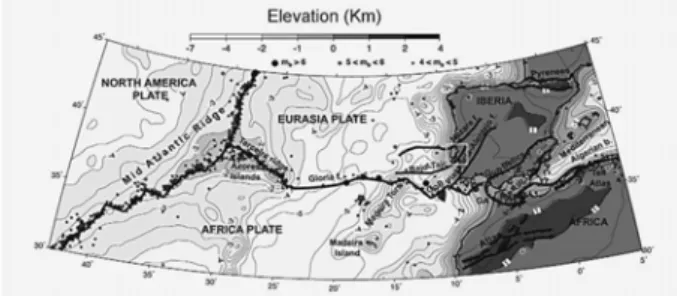
The study area (Fig. 1) is located in an intraplate region under the influence of the generally E-W trending Eurasia-Africa plate boundary. At the longitudes of the study area that locates between the Gorringe Bank (12ºW) and the Arc of Gibraltar (5ºW), the plate boundary becomes more diffuse and forms a wider area of deformation (e.g. Buforn et al., 1988; 2004; Sartori et al., 1994). Gutscher et al. (2002) have proposed an active subduction zone below the Gibraltar Arc, while Zitellini et
al. (2009) have postulated a transpressive limit - the SWIM Fault system - between the Gloria Fault and nortwestern Marocco where they meet the transpressive, seismogenic limit of the orogenic Rif-Tell system (Morel and Meghraouie, 1996).
Figure 1: Tectonic setting (modified from Jimenez-Munt and Negredo, 2003) and location of the study area, indicated by white square.
In this sector, the general stress pattern corresponds to an approximate NW-SE compression caused by the continental collision of Africa and Iberia (McKenzie, 1972; Grimson and Chen, 1986; Buforn et al., 1988; 1995; Zitellini et al., 2009). Here, the plate boundary corresponds to an E-W trending, dextral transpressive deformation zone associated with an oblique convergence of the plates at approximately 4 mm/yr in the NW-SE direction (DeMetz et al., 1994; Jimenez-Munt and Negredo, 2003). Slip rates in the study area are below 0.4 mm/year (Carvalho et al., 2006) but in the last 1000 years the Lower Tagus Valley region has been struck by several destructive earthquakes with estimated magnitudes above 6 (e.g. see Besana-Ostman et al., 2012, Cabral et al., 2011 and references therein).
The quest for these earthquakes sources is ongoing research (e.g. Carvalho et al., 2011; Besana-Ostman et al., 2012) but several authors have recognized the importance of the thick Cenozoic cover that covers part of the region (e.g, Carvalho et al., 2006;) and also of local site effects in the fabric of the seismic intensities observed during historical earthquakes (e.g. Teves-Costa and Batló, 2011).
It is well known the importance of site effect studies under the occurrence of an earthquake, for which the geodynamical characterization of the shallow layers is required. Near surface P-wave and S-wave seismic velocities provide valuable information for studies of
_________________________________________________________________________________________________________________________________________________________________________________________________________________________________________________________________________________________________________________________________________________________________________________________________________________________________________________________________________________________________________________________________________
2
ground motion behaviour, natural frequencies and the liquefaction potential under earthquake (e.g. Bauer et al., 2001; Fumal and Tinsley, 1985). If macroseismic data or earthquake records are not available, this information is even more important to obtain the microzoning data and to estimate site effects. Several methods for estimating shear waves can be used, such as borehole logging, seismic refraction profiles or surface wave inversion. The seismic refraction method is an expedite and economical method and capable of providing average values of shear wave velocities, which present a great lateral variability in the shallow layers (Ghose and Goudswaard, 2004).
The main objective of this work is to provide information about the geomechanical properties of the subsurface, using P and S wave velocities from refraction studies and geotechnical information. For each profile location careful geological and lithological studies were carried out and all available wells were analyzed, assuring a good control on the litho-stratigraphic column. The information was acquired beneath all seismological stations in southern Portugal, allowing the correction of earthquake records. VS30, Poisson’s coefficients and VP/VS ratios were determined and a soil classification based on the Eurocode 8 (Penelis, 1997) was estimated from shear wave velocity, layer thickness and SPT information. This soil classification can be used in engineering and the design of critical facilities while the other parameters provide important information for site effect studies in the region and earthquake mitigation.
Seismic refraction data acquisition and interpretation
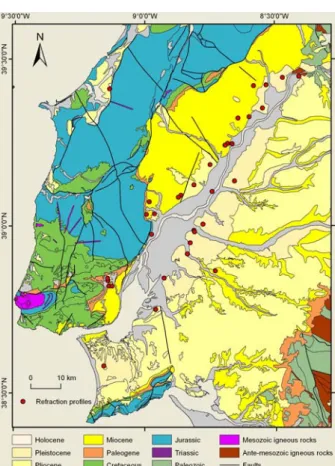
The location of the refraction profiles was selected according to logistics and the location of existing geotechnical soundings. All Neogene and Quaternary formations were sampled at least once. A total of 34 locations were selected (Fig. 2).
To reach an investigation depth of about 30 m required for VS30 estimation, a profile length of 84 m was used with 24 vertical and 24 horizontal receivers spaced 3.5 m. Two end shots and three inside layout shots were carried out to achieve a good control of the uppermost low velocity layer. The nearest source receiver offset was 1.75 m. The seismic wavefield was sampled at 0.12 ms. The sources used were hammer and plate for P-wave surveys and a 3 m wide wooden beam coupled by the wheels of a jeep.
In the S-wave records, strikes from the opposite side of the beam are usually summed with polarity reversal of one of the strikes, in order to eliminate P-wave contamination (Hasbrouck, 1991). For first arrival picking, strikes from both sides of the wooden beam were used and compared. SEG polarity convention is used, in which vertical impact produces a downswing in first arrivals for P wave surveys and for S wave profiles. The base of
horizontal geophones for transverse strikes was oriented in the crossline direction.
Figure 2: Location of the 34 shear wave refraction profiles over a simplified geological map (adapted from LNEG, 2010).
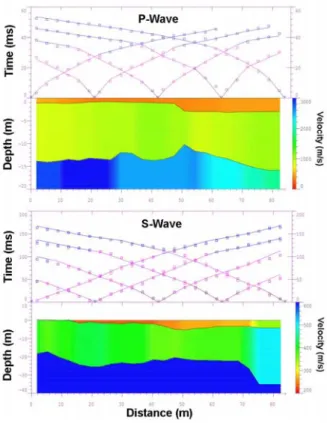
Interpretation of P and S wave refraction data was done with commercial software using the methods of the Generalised Reciprocal Method (GRM, Palmer, 1980) combined with the intercept-slope method. Figure 3 shows an example of a P-wave and an S-wave profile.
In the interpretation we used available nearby (< 1 km) wells and a detailed geological survey was carried out at all sites. Information of water table depth was also collected. Therefore, when the wells were located a few hundreds of meters from the profile location we avoided possible lateral lithological variations and ensured an adequate lithological control.
For the same purpose, each profile was interpreted taking into consideration the limitations of the refraction method such as velocity inversions or the hidden layer problem (e.g. Palmer, 1981). Using this methodology we are able to derive an appropriate relation between seismic
velocities and geological formation, lithology, age and depth of burial. Poisson ratios were determined using empirical formulas based on P-wave and S-wave seismic velocities.
Figure 3: Example of an interpreted P-wave and S-wave seismic profile, in Carregado (CAR7). Top images display time-distance curves with layer interpretation (color coded).
Standard penetration test (SPT) data
Thousands of wells were drilled in the study area for water supply and geotechnical studies, covering almost all the geological formations of the study area (Hydrogeology Department of LNEG). All this information was collected, geo-referenced and integrated in a GIS together with other geological and geophysical data.
SPT values were, when available, used to correlate with interpreted seismic refraction velocities and geological data or, when the basement was not detected with refraction data, to estimate bedrock thickness. Tests were usually performed every 1 or 2 m. Well data was also used, together with a detailed geological survey at each site, to identify the lithologies present beneath the profiles.
Analysis of the results
The measured seismic velocities varies from 150 m/s to 740 m/s and 490 m/s to 2280 m/s for the first and second layers, respectively, for P-waves. The shear wave velocities observed in the transverse receiver component range 84 m/s-690 m/s and 140-1160 ms/s for the shallowest and second layers, respectively. For the first layer, ratios exhibit a range from 0.60 to 6.07 while varies from negative values higher than 0.5.
We attribute the unrealistic values of VP/VS and of the first layer to the presence of air, organic matter and other materials. Velocity errors also possibly contribute at a smaller scale to these erroneous values. In the second layer, velocity and Poisson ratios range from 1.51 to 7.32 and from 0.12 to 0-49, respectively.
A good conformity between P-wave and S-wave models was found in some profiles but in others the depths of the interfaces of P and S models differ greatly. The presence of a shallow water table is, in some cases, the explanation for the observed discrepancy. When the water table is very shallow, the profiles present the highest VP/VS ratios and for both first and second layers.
For other profiles, the interfaces depth discrepancy can be attributed to the different properties that compressional and shear waves respond to. The determined values of VP/VS ratios and are consistent with those found in the literature for similar shallow sediments (e.g. Salem, 2000; Lankston, 1990).
The profiles VFX5, PAN46 and PSE49 e.g., all acquired over alluvium sediments where the water table is very shallow (1 m), present, for the second layer, higher values than those usually found for totally saturated shallow sediments (Salem, 2000; Lankston, 1990). Values of VP/VS ratios up to 9 however, have been several times reported in water-saturated, unconsolidated or clayish sediments (Salem, 2000).
Application to VS30 and soil classification
For the purpose of establishing a relationship between seismic velocities and lithologies and generalize the sparse seismic information to obtain VS30 and soil classification maps of the study region, the information of the surficial layer was discarded. The first layer is usually uncompacted, contains gas, roots and other material and is not representative of the geological formation/lithology. In some situations the surficial layer has several meters thickness and in this case the velocity was used. For the calculation of VS30 this layer was always taken into consideration, for which the formula of Borcherdt (1994) was used.
_________________________________________________________________________________________________________________________________________________________________________________________________________________________________________________________________________________________________________________________________________________________________________________________________________________________________________________________________________________________________________________________________________
4
The coarse seismic sampling was generalized using available digital geological cartography, in a GIS environment, and also from unpublished lithostratigraphic data of one of the authors at a finer scale. The geological cartography used ranged in scales from 1:50 000 to 1:500 000. However, the results are presented here at the 1: 1.000.000 scale.
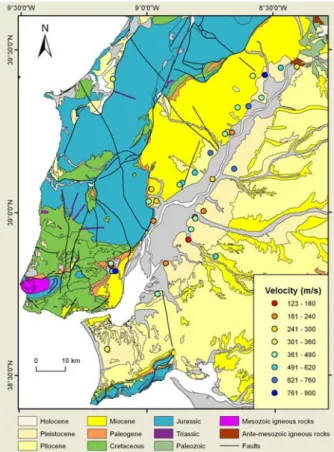
Figure 4: Color code plot of VS30 data points calculated with seismic refraction velocities. Data is overlaid to simplified geological map (adapted from LNEG, 2010).
Figure 4 shows the VS30 color coded data points produced using this approach overlaid to a geological map. This figure clearly demonstrates the complex task of producing a VS30 map using geological maps only. Due to lithological lateral variations inside a geological formation and thickness variations in lithologies and geological formations, each geological formations is often characterized by different VS30 velocity classes.
The variations in thickness also make difficult a generalization of a VS30 velocity to a particular lithology. Therefore, a great number of velocity measurements should be used to produce a detailed VS30 map of the study region. For the moment we opted for plotting data points with correspondent color coded value and not a gridded map that would lead to erroneous information.
However, a careful geological, lithostratigraphic and well data analysis (to address lateral lithological and thickness changes) will help to reduce the problem. This procedure will be undertaken for the study area together with the acquisition of more seismic profiles.
The central area of the study region that surrounds the Tagus river presents the lowest VS30 values that correspond to Holocene alluvium. Several cities are located in this region stressing the need to apply strict engineering rules. Other villages and cities located on Miocene terrains, such as district capital Santarém present some areas with relatively low VS30 values and should also be areas of concern.
Soil classifications determine the level of reinforcement of engineering structures and are a useful form to mitigate the effects of an earthquake (Penelis, 1997). In these engineering soil classifications soil conditions are traduced by shear-wave velocity and layer thickness. We attempt here to produce a classification based on eurocode 8. Due to problems in determining the bedrock in a few refraction profiles, SPT values were used, when available, to determine the presence of this unit and also to characterize the soil classes. SPT values are therefore included in our subsoil classification, but they were not included in the original classification presented by Penelis (1997). The criteria used in the classification are shown in Table 1.The great number of available wells also allow us to estimate the thickness of the different geological units in places where no refraction data was available.
CLASS CRITERIA 1 CRITERIA 2
Subsoil class A Rock or geologic formation characterized by Vs >= 800 m/s Compact deposits of sands, gravels or overconsolidated clays, several tens of meters thick (Vs >= 400 m/s at 10 m depth) Subsoil class B Deep deposits of medium dense sands, gravel or stiff clays with thickness from several tens to hundreds of meters (Vs >= 200 m/s at 10 m depth to Vs >= 350 m/s at 50m depth (SPT N~60) Subsoil class C Loose cohesionless deposits with or without soft cohesive layers (Vs < 200 m/s at depths <20m (SPT N<=10)
Deposits with soft-to-medium stiff cohesive soils (Vs < 200 m/s at depths <20m (SPT N<=10)
Table 1: Criteria used in the soil classification.
The soil classification is presented in figure 5. Similarly to the VS30 calculations, the soil classification attempted for
the region is highly affected by the geological complexity (lateral changes and thickness variations) and we also opted to plot color coded data points and not a gridded map until more data is collected.
However, the observation of the preliminary soil classification map of figure 5 confirms VS30 map analysis and points to the need of addressing engineering measures in the central region of the study area. The preliminary map also highlights the extreme geological complexity of the study region. Please note that some areas of Miocene age that were expected to have a low risk fall under soil class B and due to focusing and defocusing basin effects may present a serious hazard and seismic risk.
These preliminary maps stress the geological complexity of the study region, a higher risk than expected in several areas and therefore the need to acquire more velocity measurements in the region. For the moment it already provides extremely useful information to civil protection agencies in case of earthquake occurrence.
Figure 5: Color coded plot of soil classification data points based on the classification of Penelis (1997). Data is overlaid to simplified geological map (adapted from LNEG, 2010).
Conclusions
In the absence of macroseismic data or earthquake records, the seismic refraction technique and SPT data are traditional and solid approaches of acquiring information for site effects and microzoning studies. Other methods for obtaining S-wave velocities, such as borehole logging or multichannel analysis of surface wave can also be applied. While well data is localised and often not representative of the area, surface wave inversion methods present, if strong lateral velocity variations are present, inversion problems. Here, P-wave and S-wave velocities were obtained from seismic refraction profiles that together with geological and SPT data provided the mechanical characterization of the geological formations of the area. Well data and detailed geological surveys of each profile location allowed overcoming refraction interpretation limitations, such as velocity inversion and hidden layer problems.
This characterization was used not only to produce a subsoil classification in order to describe response spectra used to design seismic actions in earthquake engineering, but also to estimate VS30 and geomechanical parameters such as VP/VS ratios and Poisson coefficients, from which site effects and microzoning can be evaluated.
We conclude, at this first phase of the study that the highly complex geological nature of the study area where thickness and lateral lithological changes are constant, prevents a simple geographical generalization of the velocity and soil classification data points. The preliminary results presented here strongly advises the acquisitions of additional velocity measurements and a careful geological analysis of its results in order to produce detailed VS30 and soil classification maps.
Nevertheless, preliminary VS30 and the soil classification maps presented here highlight a region of great susceptibility to earthquake shaking and where several small cities and villages are located. This region is covered by Holocene alluvium but other areas located over older geological formations also show a relatively moderate-high risk.
The data presented here, used in conjunction with seismicity hazard data, such as peak ground accelerations and seismic intensities constitutes an important improvement in the seismic risk evaluation and mitigation in the study area and will provide important information in land use planning and civil protection management.
Acknowledgments
The authors are particularly grateful to the Portuguese Foundation for Science and Technology for funding projects NEFITAG (PTDC-CTE/GIX/102245/2008) and SCENE (PTDC-CTE/GIX/103032/2008), under which
_________________________________________________________________________________________________________________________________________________________________________________________________________________________________________________________________________________________________________________________________________________________________________________________________________________________________________________________________________________________________________________________________________
6
scope the refraction data was collected. The authors also acknowledge the field crew: J. Gomes and F. Caneiras.
References
Bauer, R. A., Kiefer, J., Hester, N., 2001, Soil amplification maps for estimating earthquake ground motions in the Central US: Engineering Geology, 62, 7-17.
Besana-Ostman, G. M., Vilanova, S. P., Nemser, E. S., Falcão-Flor, A., Heleno, S., Ferreira, H. and Fonseca, J. D., 2012, Large Holocene Earthquakes in the Lower Tagus Valley Fault Zone, Central Portugal: Seismological Research Letters, 83, 67-76.
Borcherdt, R. D., 1994, Estimates of site-dependent response spectra for design (methodology and justification): Earthquake Spectra, 10, 617–653.
Buforn, E., Bezzeghoud, M., Udias, A. and Pro, C., 2004, Seismic sources on the Iberia-African plate boundary and their tectonic implications: Pure and Applied Geophysics, 161, 623-646.
Buforn, E., Degaldeano, C. S. and Udias, A., 1995, Seismotectonics of the Ibero-Maghrebian region: Tectonophysics, 248, 247-261.
Buforn, E., Udías, A. and Colombás, M. A., 1988, Seismicity source mechanisms and tectonics of the Azores-Gibraltar plate boundary: Tectonophysics, 152, 89–118.
Cabral, J. Moniz, C., Batló, J., Figueiredo, P., Carvalho, J., Matias, L., Teves-Costa, P., Dias, R. and Simão, N., 2011 (online), The 1909 Benavente (Portugal) earthquake: search for the source: Natural Hazards. Carvalho, J., Rabeh, T., Bielik, M., Szlaiova, E., Torres, L., Silva, M., Carrilho, F., Matias, L. and Miranda, J. M., 2011, Geophysical study of the Ota- V.F. Xira-Lisboa-Sesimbra fault zone and of the Lower Tagus Cenozoic basin: Journal of Geophysics and Engineering, 8, 395-411.
Carvalho, J., Cabral, J., Gonçalves, R., Torres, L. and Mendes-Victor, L., 2006, Geophysical Methods Applied to Fault Characterization and Earthquake Potential Assessment in the Lower Tagus Valley, Portugal: Tectonophysics, 418, 277-297.
DeMets, C., Gordon, R. G., Argus, D. F. and Stein, S., 1994, Effect of recent revisions to the geomagnetic reversal time scale on estimates of current plate motions: Geophyis. Res. Lett., 21, 2191-2194.
Fumal, T. E. and Tinsley, J. C., 1985, Mapping shear wave velocities of near-surface geological materials. In: J.I. Ziony (Ed.), Predicting Areal Limits of Earthquake Induced Landsliding; In Evaluation of Earthquake Hazards in the Los Angeles Region — An Earth Science Perspective. US Geological Survey paper 1360, pp. 127– 150.
Ghose, R. and Goudswaard, J., 2004, Integrating S-wave seismic reflection data and 239 cone-penetration-test data using a multiangle multiscale approach: Geophysics, 69 (2), 240, 440–459.
Grimson, N. L., and Chen., W.-P., 1986, The Azores-Gibraltar plate boundary: Focal mechanisms, depths of earthquakes, and their tectonic implications: Journal of Geophysical Research, 91, 2029–2047.
Gutscher, M.A., Malod, J., Rehault, J. P., Contrucci, I., Klingelhoefer, F., Mendes-Victor, L. and Sparkman, W., 2002, Evidence for active subduction beneath Gibraltar: Geology, 30(2), 1071-1074.
Hasbrouck, W. P., 1991, Four shallow-depth, shear-wave feasibility studies: Geophysics, 56, 1875-1885.
Jimenez-Munt, I. and Negredo, A.M., 2003, Neotectonic modelling of the western part of the Africa-Eurasia plate boundary: from the Mid-Atlantic ridge to Algeria: Earth and Planetary Science Letters, 205, 257-271.
Lankston, R. W., 1989, The seismic refraction method: A viable tool for mapping shallow targets into the 1990s: Geophysics, 54, 1535-1542.
LNEG, 2010, Geological Map of Portugal scale 1: 1 000 000, Laboratório Nacional de Energia e Geologia.
McKenzie, D., 1972, Active Tectonics of the Mediterranean Region: Geophys. J. R. Astron. Soc. 30, 109–185.
Morel, J. L. and Meghraoui, M., 1996, Gorringe-Alboran-Tell tectonic zone; a transpression system along the Africa-Eurasia plate boundary: Geology, 24 (8), 755-758. Palmer, D., 1981, An introduction to the generalized reciprocal method of seismic refraction interpretation: Geophysics, 46, 1508-1518.
Penelis, G. G., 1997, Eurocode 8: Characterization of Seismic Action, Design Spectra, Future Trends. Proceedings of SERINA- Seismic risk: An Integrated Seismological, Geotechnical and Structural Approach, Thessaloniki, Greece, 479-492.
Salem, H. S., 2000, The compressional to shear-wave velocity ratio for surface soils and shallow sediments: Europ. Jour. Environm. Eng. Geophys., 5, 3-14.
Teves-Costa P. and Batlló J., 2011, The 23 April 1909 Benavente earthquake (Portugal): macroseismic field revision: Journal of Seismology, 15 (1), 59-70.
Zitellini, N., Gràcia, E., Matias, L., Terrinha, P., Abreu, M.A., DeAlteriis, G., Henriet, J.P., Dañobeitia, J. J., Masson, D.G., Mulder, T., Ramella, R., Somoza, L., Diez, S., 2009, The quest for the Africa-Eurasia plate boundary west of the Strait of Gibraltar: Earth and Planetary Science Letters, 280, 13-50.