M
ASTER
F
INANCE
M
ASTER
´
S
F
INAL
W
ORK
D
ISSERTATION
T
HE EFFECT OF FREE CASH FLOW
,
DIVIDEND AND LEVERAGE ON
EARNINGS MANAGEMENT
–
E
UROPEAN EVIDENCE
B
RUNO
A
LEXANDRE DA
S
ILVA
C
HURRO
M
ASTER
F
INANCE
M
ASTER
´
S
F
INAL
W
ORK
D
ISSERTATION
T
HE EFFECT OF FREE CASH FLOW
,
DIVIDEND AND LEVERAGE ON
EARNINGS MANAGEMENT
-
E
UROPEAN EVIDENCE
B
RUNO
A
LEXANDRE DA
S
ILVA
C
HURRO
SUPERVISOR:
P
ROFESSORD
OUTORT
IAGOC
RUZG
ONÇALVESi
A
BSTRACTThis study analyses the effect of the free cash flow, the dividend and the companies’ leverage on Earnings Management in Euro-zone countries, using a sample of around 2.150 firm-year observations, from 2009 to 2016. I also analyze the 2008 financial crisis impacts on this study’s measures and, consequently, its relations to earnings management. The Kothari (2005)’s extension to Jones (1991) model is used to compute a discretionary accruals proxy, which is assumed as a measure of earnings management.
This study documents evidence of a significant negative relationship between free cash flow and earnings management, while dividend and leverage correlates to earnings management positively, in terms of direction. Furthermore, in terms of amount, the relationship found is inverse to the previous: significant positive in regarding the free cash flow and negative for leverage and dividend paying firms.
ii
RESUMO
Este estudo analisa o efeito do fluxo de caixa livre, do dividendo e do endividamento das empresas na Gestão de Resultados em países da Zona Euro, recorrendo a uma amostra de 2.150 observações empresas-ano, de 2009 a 2016, com enfoque nos impactos sentidos nas variáveis de estudo durante a crise financeira de 2008, e consequentemente a sua relação com Gestão de Resultados. A extensão do modelo de Kothari (2005) ao modelo de Jones (1991) é usada para calcular, de forma aproximada, os accruals discricionários, que são assumidos como uma unidade de medida de gestão de resultados.
Este estudo documenta evidências de uma relação negativa significativa entre o fluxo de caixa livre e a Gestão de resultados, enquanto as relações dos dividendos e alavancagem com a gestão de resultados são positivas, em termos de direção. Além do exposto, em termos de quantidade, a relação encontrada é inversa à anterior: significativa e positiva em relação ao fluxo de caixa livre e negativa em relação ao endividamento e aos dividendos.
Palavras chave: fluxo de caixa livre; endividamento; dividendo; gestão de resultados; accruals; crise.
iii
A
CKNOWLEDGMENTS“There are many hypotheses in science which are wrong. That’s perfectly all right: it’s the aperture to finding out what’s right. Science is a self-correcting process.”
Carl Sagan The accomplishing of a final Masters degree thesis is not only a personal and academic milestone in every student's life, but also the culmination of years of hard work and commitment towards that goal. That being said, this paper signifies not an ending to my academical path, but the closing of a very important stage of my life. I have worked towards this goal for the past two years, facing all adversities head on and embracing every difficulty as a learning situation that helped me get closer to the finish line. Becoming a master graduate was, without a doubt, the biggest academic challenge I've ever endured, so the satisfaction of finishing this paper is ever so gratifying to me. I would like to express my most sincere gratitude to:
My supervisor, Professor Doutor Tiago Gonçalves, for all the advices, opinions, availability and support that were fundamental in the making of this paper. Beyond that, I thank you for all your professional but also personal coaching, something that allowed me to develop several abilities not only as a student and professional, but especially as human being.
The totality of this Master’s degree faculty, from which I had the opportunity and absolute privilege to learn. I thank you for the rigor that you demand from your students, and for doing so with a great sense of professionalism. Your example has given me invaluable tools that I most certainly will use throughout my academic, personal and professional path.
To all my friends and colleagues with which I had the privilege to share this challenge. A special thank you to Patricia Spencer for the constant availability and willingness to help and support me accomplish this goal.
Lastly, my most sincere and absolute gratitude to Beatriz, to my brothers, my parents, my uncle and aunt, grandparents and friends. To them, I owe what I am, where I am, and where I will be in the future. The love, comprehension, unconditional support and unshakable confidence that they have in and for me are my main source of strength and
iv
hope. Thank you for always believing in me and providing me with every tool I could ever need or ask for in order to accomplish this goal.
“Bad times have a scientific value. These are occasions a good learner would not miss.” Ralph Waldo Emerson
V
I
NDEX1. Introduction ... 1
2. Literature review ... 3
2.1. Free cash flow and earnings management ... 5
2.2. Dividend and earnings management ... 6
2.3. Leverage and earnings management ... 7
3. Research questions and hypothesis ... 9
4. Research methodology ... 12 4.1. Sample selection ... 12 4.2. Measurement of variables ... 13 4.3. Research method ... 16 5. Results ... 17 5.1. Descriptive statistics ... 17
5.2. Pearson’s correlation matrix ... 19
5.3. The impact of the free cash flow, dividend and leverage to earnings management 21 5.3.1. Effect in terms of direction... 21
5.3.2. Effect in terms of intensity ... 23
5.3.3. Robustness analysis ... 25
6. Conclusion ... 28
7. References... 30
VI
Table Index
Table I. - Sample composition by country ... 12
Table II. - Sample composition by industry ... 13
Table III - Descriptive statistics ... 18
Table IV - Pearsons’ correlation matrix ... 20
Table V - Kothari (2005) regression model results (DAC) ... 22
Table VI - Kothari (2005) regression model results (ABS_DAC) ... 24
Table VII. - Regression results for negative and positive DAC ... 26
Table VIII. - Regression results including the impact of the financial crisis ... 27
Table IX – Results of the regression models to a subset of during crisis period (Year=[2009;2013]) ... 35
Table X – Results of the regression models to a subset of post-crisis period (Year=]2009;2016] ... 36
1
1. INTRODUCTION
Earnings management (EM) is a current problem that affects not only firms, but also the financial markets in which they are inserted. At corporate level, its consequences range from possible bankruptcy and violation of debt covenants, to investments in projects without profitability, which sole purpose is to benefit the managers at a personal level. At the market level, these may take the form of sanctions or fines imposed by regulators, an accentuated decrease of stock prices or even lead to a breach of confidence from investors. Given the great importance of the consequences mentioned, one question arises: why manage results? There is a panoply of motivations, but also of consequences. Watts and Zimmerman (1990) categorize incentives in capital market, contractual, regulatory and bonus contract incentives. Additionally, Dichev et al., (2013) in a survey to 169 CFOs, suggests that capital market motivations are the ones that are seen as the greatest influence while making decisions towards managing results.
Over the years, several studies have sought a link between the earnings management and a number of key macroeconomic, microeconomic or accounting factor. This study, like others, focuses on the exploration of the hypothesis of connection between free cash flow (FCF), corporate indebtedness, and the payment of dividends and earnings management. The motivation behind the choice of these variables is based on the actions that are possible through each of them, as well as their next connections with each of the categories of motivations separately. In addition, the period under scope comprises the time lapse immediately after the collapse of Lehman Brothers in September 2008, which caused a major shock in the global financial system and had a major impact on the financial markets.
The effects of the 2008 financial crisis were large and were felt in the enterprise world, being documented in their accounting. This study, additionally to verifying the existence of a general link between the interest variables, and the management of earnings, it aims to search for a possible effect of the economic crisis on Earnings management (EM) through the management of accruals.
2
As mentioned, the sample covers a temporal universe of 8 years, between 2009 and 2016. It comprises around 2.150 listed companies from 15 Euro-Zone countries. The Kothari (2005) model was used to calculate discretionary accruals, and was adopted as a measure of earnings management.
The results of the study suggest that the relationship between free cash flow and EM is negative regarding its direction, and positive in intensity. This suggests that companies with higher FCF practice EM with a sense of reducing earnings (Jensen, 1986; Kadioglu and Yilmaz, 2017), and practice more EM than companies with less FCF (Chung, Firth & Kim, 2005 and Lanhane and Mahakud, 2016). Contrasting, it also suggests that the relationship between dividends (DIV) and EM is positive in direction (Roychowdhury, 2006 and Graham et al., 2005) and negative in intensity (Guizani, 2018 and Farinha and Moreira, 2007), suggesting that paying dividends increases the pressure over firms’ performance and, that the market scrutiny over firms mitigates some opportunities to enroll in EM. Similar to dividends, leverage findings indicate a positive connection between Leverage (LEV) and EM regarding its direction (DeFond and Jiambalvo, 1994 and Chamberlain et al., 2014) and, a not statistically significant relation in terms of amount. In addition, they generally suggest that the crisis led companies to practice more EM than usual, while its direction was not statistically significant.
In this sense, this study is of interest to the academic community, because it suffices the need for a deepening in knowledge of the connection of three very relevant accounting variables, as well as more thorough look over issues related to the effects of economic crises on companies. This paper also makes it possible to alert the entities that regulate the financial markets for the need to create effective mechanisms aimed at relegating EM practices, reducing information asymmetry, and other measures such as strengthening existing regulations to increase the protection of financial markets investors.
This study is divided into five sections. In the second section, we find the literature review, where a theoretical framework of EM is made, and several hypotheses are studied. In the third section, the sample is presented; the methodology, the EM measurement and the base model with the respective variables are explained. Section four discusses the results obtained and, finally, section five presents the conclusions that were taken based
3
on the results obtained, and identifies the limitations to the study, ending with some suggestions for future investigations.
2. LITERATURE REVIEW
Financial reporting suffers from a trade-off in reliability and relevance. The demand for financial information is spread through multiple types of users with multiple ends for its information. Debt-holders demand information regarding the liquidity and solvency of the firms, and the impact from current earnings on those measures, being its prime concern the reliability of the information. Current and potential shareholders’ principal concern is the firm’s ability to generate future cash flows, meaning that relevance is the key. Thus, the financial information is used by multiple stakeholders to take decisions, meaning that it must be accurate and timely relevant (Kothari, 2001).
Accrual accounting allows firms to report about future revenues, expenses, and assets that do not translate immediately to cash, increasing the timeliness of the information through recognition of plausible future cash-flows. A more reliable information gives the investors a more complete view of firm’s owned assets.
Additionally, the trade-off between reliability and relevance limits the use of accounting information, because of the managers’ use of judgment to exploit its discretion in personal or firms’ favor.
Theoretically, the use of accruals would mean a greater quality of the accounting information, but the accounting system flexibility gives managers substantial influence over some subjective accounting recognition decisions, such as provisions, sales returns or other accounting methods, which would damage the quality of the accounting if its recognition do not truly reflect the firms’ current financial position.
Therefore, the financial information disclosed can be intentionally manipulated by firm’s managers to mislead some stakeholders to achieve a certain objective. Accrual management is then, the intentional manipulation of accruals with resource to accounting flexibility by managers (Yan, 2006 and Aman et al., 2006). Thereafter, real activities management occurs “…when managers undertake actions that changes the timing or
4
structuring of operation, investment and/or financing transaction in effort to influence the output in the accounting system” (Gunny 2010, p.855).
The previous literature does not reveal a single common definition for earnings management. According to Bjurman and Rahman (2014), earnings management (EM) is the umbrella term for different activities from managers towards influencing the accounting earnings’ number to reflect a desired outcome. According to Healy and Wahlen (1999), it occurs when managers’ use of judgment allows them to select reporting methods and estimates that do not truly reflect their firms’ underlying economics. Sun and Rath (2008, p.407) define EM as the “exercise judgement for the purpose of hiding true performance in order to either influence the stock performance, benefit from contractual terms between the firm and managers, or to influence regulatory decisions”. Fields et al., (2001), states EM as managers’ actions that can mislead the users of financial reporting data. An opportunistic approach can be observed in the fact that managers use the asymmetry of information to maximize their usefulness (Kundakchyan & Grigoryeva, 2016).
Although EM has been defined in so many ways, the main concept underlies on the purposeful change of financial reporting information by managers, to either mislead some stakeholders or to influence contractual outcomes.
Multiple studies investigated the motivations that lead managers to manage earnings. Healy & Whalen (1999) and Watts and Zimmerman (1990) found that managers’ incentives to manage earnings could be categorized as capital market, contractual, regulatory and bonus contract incentives. Capital market motivations consist of the use of earning management to influence a stock price and to reduce cost of capital. In this case, managers have the incentive to inflate earnings to receive a higher valuation. Kothari (2015) found the evidence of overvaluation at the time of seasoned equity offerings among firms overstating earnings through real activities, and Cohen & Zarowin (2010) found that companies enroll in both types of earnings management prior to stock issuance. Contractual motivations concern contracts with different parties such as debt providers, suppliers, customers or other debtors and creditors. The fundamental idea behind this
5
motivation’s category is that managers have incentives to manage earnings to take advantage of its’ firm’s contractual counterparties.
Regulatory incentives arise from the political and environmental risk associated with any business, and the potential harm that these factors may represent to said firms.
Bonus contract refers to personal and purely opportunistic motives. The agency theory assumes the allowance of bonuses to point managers’ and shareholders’ interests at the same direction. These bonuses are usually connected to exceeding earnings benchmarks; thus, managers have motives to manipulate earnings towards increasing their personal welfare.
Additionally, Dichev et al., (2013) found that the desire to influence stock price, outside pressure to hit earnings benchmarks, and inside pressure to do the same, were the most popular answers from a survey vising a universe of 169 CFOs. Other studies focused on the detection of EM throughout different periods of time and different economic environments.
2.1. Free cash flow and earnings management
Earnings include plenty of non-cash components such as depreciation of tangible assets, amortization of intangibles, provision of bad debts and other accounting entries which could lead to a biased economic reality. Managers could manipulate earnings through several accounting discretionary options, whereas free cash flow is harder to manipulate (Akumu, 2014).
Free cash flow (FCF) is a measure of how much cash a business generates after accounting for capital expenditures (Akumu, 2014). It can be defined as cash available for a resource provider, either from a debt or equity provider, meaning that it is the cash available after fulfilling the requirements of the business, which can be used to pay debt or to distribute to equity holders. Jensen (1986) defined free cash flow as the excess cash available to invest in all positive net present value projects and argued that managers use FCF for their personal gain tending to enroll in non-profitable projects.
The non-optimal use of FCF could rise agency problems. The agency problem, developed by Coase (1937), Jensen and Meckling (1976), and Fama and Jensen (1983 a,b),
6
essentially consists on the separation of ownership and control of a firm. The conflict of interests between managers and shareholders has been studied widely, and it relies on the fact that managers have incentives to behave based on their personal interests instead of the firms’ and shareholders’ interests (Jensen, 1986). Adding to this, Kadioglu and Yilmaz (2017) posited that managers tend to make unnecessary expenditures that benefit themselves at the expense of shareholders’ interest.
Recent studies found a positive connection between the surplus of free cash flow and agency problems, meaning that the higher the free cash flow excess, higher the agency problems (Chung, Firth & Kim, 2005 and Lanhane and Mahakud, 2016). This relationship is even deeper when investment opportunities are scarce (Gul, 2001). In the event of surplus of free cash flow, managers have the incentive to “waste” it on non-optional project such as zero or negative NPV projects to maximize their welfare at the expense of firms’ value.
Separately from investment opportunities, the free cash flow could be managed by lengthening the time to pay the bills, by shorting the time to collect cash from firms’ debtors, by delaying inventory buy offs, or by choosing what items are or are not capital expenditures (Jensen & Michael, 1996). By acting in this way, managers can either inflate or deflate earnings to achieve a certain outcome that could be an overvaluation, or avoid debt-covenants violations.
2.2. Dividend and earnings management
Firms managers can decide how to distribute its’ earnings to investors. The most common ways to do it are the distribution of a dividend per share or shares’ buy back. Dividend is the distribution of profits to a company’s’ shareholder, while shares repurchases represent the firms’ intention to buy its’ own shares with a premium, granting to the investor a certain return and increasing the firms’ control. Investors are assumed to be rational and risk averse, and are expected to act in disregard to the firms’ policy, which is preferred by the markets to be solid and constant instead of volatile.
Lintner (1956) argues that managers believe that the markets prefer firms with stable dividend policies. Contrarily to Lintner findings, Miller and Modigliani (1961) argued that in perfect and complete markets, the firms’ dividend policy does not affect its’ value,
7
positing that the firms’ value is determined by the optimal choice of investments and that the net payout is the difference between earnings and investments, concluding that a firm can adjust its dividends to any level, changing the number of shares outstanding.
Further, Jensen (1986) theorizes that dividend distribution is an effective tool in terms of constraining management self-interest actions, due to its dispersing of FCF ability. Thus, dividends can be used as an internal corporate governance mechanism, reducing the agency problems (Guizani, 2018). Although dividend proprieties allow its use as an agency problem mitigator, it can work as an enhancer, pressuring the management to either achieve certain goals (Graham et al., 2005) or to maintain dividend amounts, when it’s not achievable (Roychowdhury, 2006).
The dividend policy has a great impact on stock price. Lintner (1956) introduced the concept of conservatism on dividends, meaning that a structured and solid dividend policy conveys good information about the firm to the market, while a volatile dividend policy would mean surprises to shareholders, which might result on a stock price decrease. Consequently, the signaling effect of the dividend policy could prevent managers to make downward adjustments or give them the incentive to make upward adjustments to the earnings distribution (Allen and Michaely, 2003), being simultaneously a mitigator and an enhancer of EM.
Brav et al. (2005, p.520) found that “firms with stable and sustainable increases in earnings are for the most part the only firms that consider increasing or initiating dividends.”, reinforcing the signaling effect of dividend policy.
Recent literature indicates that dividends are “disappearing” (Fama and French, 2001a). Dividend payout strategies are gradually being replaced by stock repurchases. Firms’ prefer mixed policies over dividend only strategies, Skinner (2008). Allen and Michaely (2003) argue that both strategies have similar signaling effects but repurchases are larger in size and their impact is more pronounced.
2.3. Leverage and earnings management
Leverage consists in a level of commitment, for a firm, to use its free cash flows to pay the principal plus interests to some counterparty. According to Jensen (1986) this relationship between debt and cash flows works as a mitigator of earnings managements,
8
reducing the cash available on managers’ power, which could be invested opportunistically in non-value maximizing projects. Nevertheless, its ability to reduce agency costs through free cash flows can originate a problem of divergence of interest between shareholders and bondholders, or between managers and bondholders. This new problem generates agency costs, meaning that managers can either increase firm’s “risk” investing in highly profitable and risky projects, maximizing value for shareholders, or changing its payout policy in the bondholder’s favor, harming the shareholders.
To reduce this conflict and align the stakeholders’ interest, debt providers and firms sign contracts, whereas its violation would imply major changes on firms’ debt in less favorable terms. These covenants are usually connected with accounting figures, earnings benchmarks or profitability thresholds. Since its violation could harm the firms and its managers, an opportunistic setting is revealed, since managers can manipulate earnings to avoid debt covenant violations.
Furthermore, managers may feel the importance of managing the leverage levels when their companies wish to take a new loan, as that lenders are rational and risk averse, and the company’s current level of leverage could dictate the approval of the loan (Zamri et al., 2013). The literature offers mixed results on whether managers manipulate earnings by leverage-based purposes. DeFond and Jiambalvo (1994) and Chamberlain et al. (2014) found a positive connection between leverage and earnings management when firms intend to reduce the likelihood of debt covenants violations or intend to increase their bargaining power during debt renegotiations. On the other hand, some studies found a negative link between earnings management and leverage, arguing primarily that leverage requires a debt repayment reducing the amount of cash on managerial hands and secondly that levered firms may face a greater control from creditors, making it harder to manipulate earnings (Jensen, 1986; Rodriguez-Pérez and Van Hemman, 2010; Afza and Rashid, 2014; Jelinek, 2007).
Firms can raise debt through private (banks) or public debt markets (bondholders). Raising debt leads to an accounting scrutiny conducted by lenders to access the firms’ solvency and liquidity. The quality of accounting information plays an important role when lenders estimate future cash flows, meaning that information risk is price incremental to the borrowers’ default risk (Bharath, Sunder, and Sunder, 2008). Although
9
accrual-based EM is not easy to spot in accounting panel data, if borrowers pay a price for the quality of their accounting information within debt total price, we can assume that EM activities may increase the information risk and consequently the debt price.
3. R
ESEARCH QUESTIONS AND HYPOTHESIS
In the beginning of the XXI century, the world lived what many economists consider to be the worst financial crisis since the Great Depression of the 1930s. The financial event was not fully unknown for politicians and economists, given that past similar events where vastly studied by them and many theories were formulated on how to and what to do to reverse the situation. The crisis of 2007-2008 had a great impact on firms. The collapse of Lehman Brothers Holdings Inc. marked the fall of the worlds’ financial system and managers, unlike politicians and theoretical economists, faced major changes on its’ firms’ environment almost instantaneously.
Following the crisis economic shock on accounting matters, the research question of this study emerges from the intent to understand the impact on earnings management, in terms of direction and intensity, from free cash flow, dividend and leverage, through discretionary accruals. A second purpose of this study is to infer whether the financial crisis made extreme pressure on European, non-financial firms’ managers, leading them to alter the direction and/or intensity of its’ discretionary accruals. Summing, this study’ research questions are:
RQ1: Does free cash flow impact earnings management? RQ2: Does leverage impact earnings management? RQ3: Do dividends impact on earnings management?
Given the previous research questions, this study tests hypothesis that would allow to conclude what the connection between the stated accounting measures and EM is, and how to measure that relationship in terms of direction and proportion.
Under RQ1 context, most of the existing literature indicates that free cash flow positively impacts EM, either through Discretionary accruals management (DAC) or/and Real
10
activities earnings management (REM), for normal economic periods of sample selection (Chung, Firth & Kim, 2005 and Labhane and Mahakud, 2016).The rationale behind the stated is that managers with excess FCF engage in non-profitable projects for its own welfare maximization, which would translate, on the following years, in a decrease on firms and shareholders welfare. Thus, managers use the surplus of free cash flow to camouflage bad investment decisions made on previous years. Some studies also found evidence that FCF could negatively impact earnings management (Dechow, Ge, Shcrand, 2010 and Becker, Defond, Jiambalvo and Subramanyam, 1998). The argument is based on market and tax reasons, suggesting that managers could push towards decreasing earnings via cash flow to smooth earnings, and on the year of the “bad” investments, FCF reduces due to its’ actual investment cash outflow. Jensen (1986) posited that the excess of FCF generates agency costs that firms must undertake due to the possibility of its’ non-optimal investment. Gul (2001) argued that firms with higher surplus of free cash flow would have more EM, especially when investment opportunities scarce. Thus, the first two hypotheses of this study arises:
H1: Firms with high levels of free cash flow would have high levels of EM; H2: Firms with high levels of free cash flow manage earnings downwards;
As stated, a great economic shock, such as a global financial crisis, has great impact on firms’ ability to generate earnings, and sets back its’ access to capital sources. A large bundle of studies indicate that earnings are the metric that most investors use to make investment decisions (Kothari, 2001). Dividend per-se, can be claimed as a proportion of firms’ earnings that would be distributed to its investors, meanings that dividends, theoretically, would vary with firms’ earnings. In reality, the previous doesn’t occur. Dividends have a signaling effect about firms’ future ability to perform (Farinha and Moreira, 2007). Several studies investigated the impact of dividend signaling effects on firms’ reported earnings and its’ dividend yields, concluding that managers are willing to practice an unsupportable dividend yield rate to maintain the dividend amount, because its’ reduction would mean a greater decrease on firms’ quotation. Therefore, dividend would be an enhancer of EM (Graham et al., 2005; Roychowdhury, 2006).
On another hand, dividends can mitigate EM due to its’ cash flow dispersion ability (Guizani, 2018). Assuming that the higher the free cash flow the higher the EM, the dividend
11
expropriate managers from excess cash, reducing EM (Jensen, 1986). From the previous arguments and under the second research question, the third and fourth hypothesis of this study arise:
H3: Firms that pay dividends would have lower EM levels; H4: Firms that pay dividends manage earnings upwards;
Under RQ3 and focusing on leverage, following the dividend rationale, debt generates an obligation to the firms to repay its’ coupons and principal, reducing the cash on managers “hands”. Additionally, indebtedness creates creditors scrutiny over firms’ books, working as a mitigator of EM practices (Rodriguez-Pérez and Van Hemman, 2010). Disregarding its mitigator component, leverage is also an enhancer, given that debt contracts are very rigorous, and its violation would harm the borrower considerably, in terms of pricing and accessibility to new funds (DeFond and Jiambalvo,1994; Chamberlain et al., 2014). Debt covenants are usually connected to firms accounting measures, such as earnings benchmarks and profitability and solvency ratios. Thus, managers are motivated to upward manage earnings through leverage. Then the fifth and sixth hypothesis of this study arise:
H5: Firms with higher leverage have less earnings management; H6: Firms with higher leverage manage earnings upwards;
12
4. RESEARCH METHODOLOGY
4.1. Sample selection
The data provider used to collect the financial and accounting information were Amadeus and DataStream. The data concerns to all listed Euro Zone (15) firms, except the financial and insurance, public administration and defense, extraterritorial organizations and bodies sectors, from NACE REV: 2 main sections classification. The exclusion of this main sections results from its’ accounts specific characteristics and regulation. Its’ inclusion would mean biased results on total accruals and consequently on discretionary accruals measures.
Additionally, firms with insufficient data and firms which data violates the fundamental rules of accounting were excluded, and the number of observations by country were assured. To assure that outliers effects were suppressed, all observations with total accruals below 1 percentile and above 99 percentiles were excluded, resulting on 354 exclusions.
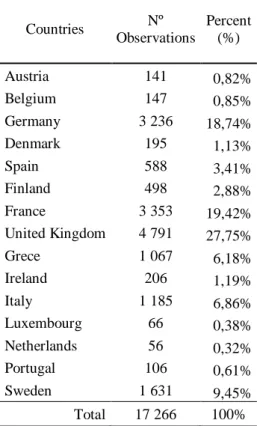
Table I. - Sample composition by country
Countries Nº Observations Percent (%) Austria 141 0,82% Belgium 147 0,85% Germany 3 236 18,74% Denmark 195 1,13% Spain 588 3,41% Finland 498 2,88% France 3 353 19,42% United Kingdom 4 791 27,75% Grece 1 067 6,18% Ireland 206 1,19% Italy 1 185 6,86% Luxembourg 66 0,38% Netherlands 56 0,32% Portugal 106 0,61% Sweden 1 631 9,45% Total 17 266 100%
13
The study period referred to 2009 to 2016. However, the data was collected from 2008 to 2016. The final sample has 17.266 observations, from 15 Euro-Zone countries and 17 different industries.
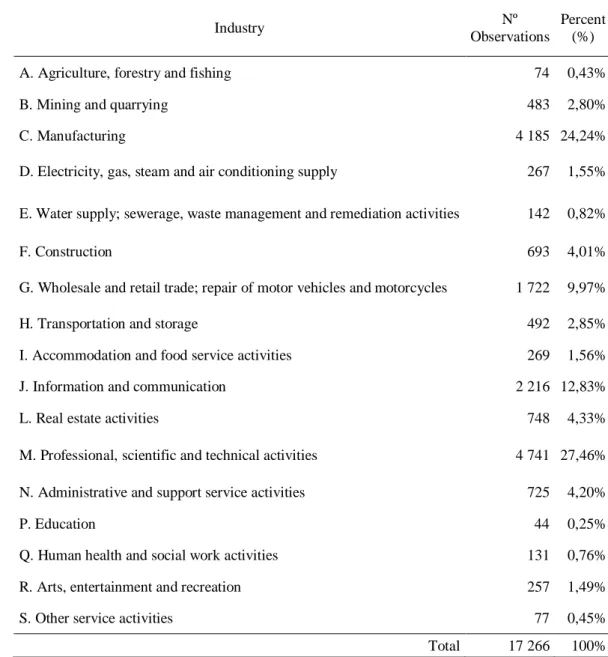
Table II. - Sample composition by industry
Industry Nº
Observations
Percent (%)
A. Agriculture, forestry and fishing 74 0,43%
B. Mining and quarrying 483 2,80%
C. Manufacturing 4 185 24,24%
D. Electricity, gas, steam and air conditioning supply 267 1,55%
E. Water supply; sewerage, waste management and remediation activities 142 0,82%
F. Construction 693 4,01%
G. Wholesale and retail trade; repair of motor vehicles and motorcycles 1 722 9,97%
H. Transportation and storage 492 2,85%
I. Accommodation and food service activities 269 1,56%
J. Information and communication 2 216 12,83%
L. Real estate activities 748 4,33%
M. Professional, scientific and technical activities 4 741 27,46%
N. Administrative and support service activities 725 4,20%
P. Education 44 0,25%
Q. Human health and social work activities 131 0,76%
R. Arts, entertainment and recreation 257 1,49%
S. Other service activities 77 0,45%
Total 17 266 100%
4.2. Measurement of variables
Several models and its’ extensions have been used to measure earnings management. Total accruals value contemplates a non-discretionary part, which refers to “normal” or “regular” accruals, which vary amongst country, industry and firms’ life cycle stage and, a discretionary part that is associated with managers’ earnings management
14
actions/decisions. Academics widely use the abnormal or discretionary accruals as a proxy to earnings management.
This study uses Kothari et al. (2005) to estimate the total accruals value. The model assumes the error term (𝜀𝑖𝑡) of an Ordinary Least Square as discretionary accruals, translating the earnings management into a figure (number). Adding to this, Dechow et al. (1995) extension to Jones (1991) model is used to compute discretionary accruals and finally, Kasznik (1999) extended Dechow et al. (1995) and Jones (1991) models “including the change in operating cash flow as an explanatory variable” and adjusted “the sales revenue variable for the change in accounts receivable” (Kasznik 1999, p.64). The combination between Kothari et al. (2005) and the two previous models grants robustness to the analysis and extends the literature on model selection to measure discretionary accruals.
Equation 1. shows Kothari et al. (2005) estimation of total accruals: (1) 𝑇𝑜𝑡𝑎𝑙 𝐴𝑐𝑐𝑟𝑢𝑎𝑙𝑠𝑖,𝑡 = (∆ 𝑛𝑜𝑛−𝑐𝑎𝑠ℎ 𝑐𝑢𝑟𝑟𝑒𝑛𝑡 𝑎𝑠𝑠𝑒𝑡𝑠𝑖,𝑡 𝑇𝑜𝑡𝑎𝑙 𝑎𝑠𝑠𝑒𝑡𝑠𝑖,𝑡−1 ) − (∆ 𝑐𝑢𝑟𝑟𝑒𝑛𝑡 𝑙𝑖𝑎𝑏𝑖𝑙𝑖𝑡𝑖𝑒𝑠−𝑙𝑜𝑛𝑔 𝑡𝑒𝑟𝑚 𝑑𝑒𝑏𝑡𝑖𝑡 𝑇𝑜𝑡𝑎𝑙 𝑎𝑠𝑠𝑒𝑡𝑠𝑖,𝑡−1 ) − ( 𝑑𝑒𝑝𝑟𝑒𝑡𝑖𝑎𝑡𝑖𝑜𝑛 𝑎𝑛𝑑 𝑎𝑚𝑜𝑟𝑡𝑖𝑧𝑎𝑡𝑖𝑜𝑛𝑖𝑡 𝑇𝑜𝑡𝑎𝑙 𝑎𝑠𝑠𝑒𝑡𝑠𝑖,𝑡−1 )
As posited, the components of total accruals are reflected on Eq. (1). The discretionary accruals are estimated by subtracting from total accruals its’ non-discretionary part. All variables on Eq. (1) have lagged total assets as denominator, which works mathematically and simultaneously as a control mechanism for scale bias and as a mitigator of heteroscedasticity in residuals, following Kothari et al. (2005). On this model 𝑅𝑂𝐴𝑖𝑡 or 𝑅𝑂𝐴𝑖𝑡−1 are included, since the model was developed to provide an effective reflection of firms’ actual and past performance in the accruals.
(2) 𝑇𝐴𝑖,𝑡 𝐴𝑇𝑖,𝑡−1 = 𝛽0+ 𝛽1( 1 𝐴𝑇𝑖,𝑡−1) + 𝛽2( ∆𝑆𝑎𝑙𝑒𝑠𝑖,𝑡 𝐴𝑇𝑖,𝑡−1) + 𝛽3( 𝑃𝑃𝐸𝑖,𝑡 𝐴𝑇𝑖,𝑡−1) + 𝛽4 (𝑅𝑂𝐴𝑖,𝑡) + 𝜀𝑖,𝑡 Where: 𝑇𝐴𝑖,𝑡: total accruals of firm i on year t; 𝐴𝑇𝑖,𝑡−1: total assets if firm i on year t-1; ∆𝑆𝑎𝑙𝑒𝑠𝑖,𝑡 is the change in sales/revenues between year t and t-1 of firm i; 𝑃𝑃𝐸𝑖,𝑡 is net
property, plant and equipment of firm i on year t; 𝑅𝑂𝐴𝑖,𝑡 𝑜𝑟 (𝑖,𝑡−1) is the return on assets of firm i on years t or t-1 and 𝜀𝑖,𝑡is the residual term from the regression, furtherly denoted as discretionary accrual (DAC).
15
Dechow, Sloan and Sweeney (1995) extended Jones (1991) model. Jones (1991) assumed that managers do not exercise discretion over revenues in either the estimation period or the event period. Thus, Dechow et al. (1995) adjusted the revenue component for the change in receivable in the event period.
Dechow et al. (1995) model: (3) 𝑇𝐴𝑖,𝑡 = 𝛽0+ 𝛽1( 1 𝐴𝑇𝑖,𝑡−1) + 𝛽2( ∆𝑅𝐸𝑉𝑖,𝑡 𝐴𝑇𝑖,𝑡−1− ∆𝑅𝐸𝐶𝑖,𝑡 𝐴𝑇𝑖,𝑡−1) + 𝛽3( 𝑃𝑃𝐸𝑖,𝑡 𝐴𝑇𝑖,𝑡−1) + 𝜀𝑖,𝑡
Where: 𝑇𝐴𝑖,𝑡: total accruals of firm i on year t; 𝐴𝑇𝑖,𝑡−1: total assets of firm i on year t-1; ∆𝑅𝐸𝑉𝑖,𝑡 is the change in sales/revenues between year t and t-1 of firm i; ∆𝑅𝐸𝐶𝑖,𝑡 is the change in receivables between year t and t-1 of firm i; 𝑃𝑃𝐸𝑖,𝑡 is net property, plant and equipment of firm i on year t and 𝜀𝑖,𝑡is the DAC.
The adjustment should ensure that the estimate of earnings management is no longer biased towards zero Jones (1991).
Kasznik (1999) extended Dechow et al. (1995) and Jones (1991) by taking the modification made by Dechow et al. (1995) on Jones (1991) model and introducing the change in cash flow from operations (Eq.5)
(4) 𝑇𝐴𝑖,𝑡 = 𝛽0+ 𝛽1(∆𝑅𝐸𝑉𝑖,𝑡 𝐴𝑇𝑖,𝑡−1 − ∆𝑅𝐸𝐶𝑖,𝑡 𝐴𝑇𝑖,𝑡−1) + 𝛽2( 𝑃𝑃𝐸𝑖,𝑡 𝐴𝑇𝑖,𝑡−1) + 𝛽3( ∆𝐶𝐹𝑂𝑖,𝑡 𝐴𝑇𝑖,𝑡−1) + 𝜀𝑖,𝑡
Where: 𝑇𝐴𝑖,𝑡: total accruals of firm i on year t; 𝐴𝑇𝑖,𝑡−1: total assets of firm i on year t-1; ∆𝑅𝐸𝑉𝑖,𝑡 is the change in sales/revenues between year t and t-1 of firm i; ∆𝑅𝐸𝐶𝑖,𝑡 is the change in receivables between year t and t-1 of firm i; 𝑃𝑃𝐸𝑖,𝑡 is net property, plant and equipment of firm i on year t; ∆𝐶𝐹𝑂𝑖,𝑡 is the change in cash flow from operations between year t and t-1 of firm i and 𝜀𝑖,𝑡is the DAC.
The regressions unstandardized residuals were saved as DAC_”model” (discretionary accruals), being the measure of earnings management. DAC variables measure the direction of earnings management, meaning that a negative sign means that managers used DAC to decrease earnings and, consequently, if it’s positive they use it to increase its’ firms’ earnings.
16
Furtherly, ABS_DAC_”model” is computed as the absolute value of any DAC_”model” variable. The previous measures earnings management as an amount regardless the direction (practice more or less of earnings management). Hence, for each model, two measures of discretionary accruals were computed, becoming then possible to infer the direction and amount of EM of each observation, to perform the analysis.
For this study proposes, DAC_”model” and ABS_DAC_”model” are assumed, furtherly, as a dependent variables. The independent variables are free cash flow (FCF) which is the ratio of cash flow divided by total assets, leverage (LEV) which is the ratio of total debt over total assets and a binary variable which assumes the value of 1 if a firm pays dividends, and the value of 0 otherwise (BDY). The control variables are the return on assets (ROA), controlling for performances on the event period and business cycle stage differences and, the natural log of total assets (LN(AT)) controlling for size differences.
4.3. Research method
The main purpose of this study is to analyze the link between the levels of earnings management with respect to cash flow, leverage and dividend. Additionally, the incorporation of the crisis factor on the analyses aims to identify if the crisis affected the usual levels of DAC.
It uses a standard regression analysis and descriptive statistics as tools, SPSS statistical packages were used to conduct all the analysis. Total accruals were calculated based on Kothari et al., (2005) model presented on Eq.1. To test the research hypothesis previously formulated, the following multivariate model were design:
(5) 𝐷𝐴𝐶𝑖,𝑡 = 𝛽0+ 𝛽1(𝐹𝐶𝐹𝑖,𝑡) + 𝛽2(𝐵𝐷𝑌𝑖,𝑡) + 𝛽3(𝐿𝐸𝑉𝑖,𝑡) + 𝛽4(𝐵𝑌𝑖,𝑡) + 𝛽5(𝐵𝐶𝑖,𝑡) + 𝛽6(𝑅𝑂𝐴𝑖,𝑡) + 𝛽7(ln 𝐴𝑇𝑖,𝑡) + 𝜀𝑖,𝑡
Where i refers to each firm observation and t to the matching year.
The DAC variable was calculated using three models, Kothari et al. (2005), Dechow et al. (1995), Krasnik (1999). It measures discretionary accruals, and can be interpreted as a direction of earnings management, if positive means that earnings management goal is to inflate earnings, if negative the goal is to deflate it. Furtherly, the absolute value of
17
DAC is also computed to analyze EM in terms of its quantity/volume, meaning that higher values mean more EM, and lower values means less EM. Both DAC and ABS_DAC are dependent variables on this study, to test for all the hypothesis. The three models were used to confer sturdiness and comparison measure to the study.
As independent variables this study counts firstly with FCF which measures the amount of free cash flow generated by the firm on a certain year and is computed by the ratio of free cash flow by total assets. The second independent variable of interest is a binary which assumes the value 1 if a firm pay dividends and 0 if it doesn’t. The third independent variable is leverage which is measured by the ratio of total debt by total assets.
To access differences on firms, four control variables were added to the model: BY, BC, ROA and ln(AT). The variables BY and BC are dummies to control for year and country, respectively. ROA is widely used on the previous literature to analyze the relationship between operating revenues and the earnings management practices (Santos, 2017 and Tendeloo & Vanstraelen, 2008). Ln(AT) is computed by the natural log of total assets to control for size differences.
5. RESULTS
5.1. Descriptive statistics
According to Table III., for Kothari et al. (2005), Dechow et al. (1995) and Krasnik (1999), the calculated measures of DAC, verify that the average discretionary accruals level is negative but close to zero, for Europe 15 zone listed companies, meaning that, on average, companies’ managers deflate the results rather than inflate it. In terms of amount (“quantity”) all three measures indicate an approximate level of EM, which is a “red flag” enhancing the fact that all measures are possibly highly correlated.
Regarding the independent variables of the model, it’s important to refer that, on average, FCF represents about 4.5% of total assets, LEV accounts for 21.2% of total assets, and that 57.04% of the sample firms pay dividends, which confers sturdiness to the analysis. Additionally, the variable used for control in a crisis period (B_CRS) has an average of
18
0.5960, which means that 59.6% of the observations depicted on the sample rely on the crisis period.
Table III - Descriptive statistics
The ROA control variable average is negative, which is not usual on the literature, but reflects the latest financial crisis. Its median is positive, and its maximum is relatively low when compared with its minimum, which could mean that either the majority of the data relies on a recession stage of the business cycle, or that the data is biased towards negative earnings.
Variables: DAC_KOTH discretionary accruals computed using Kothari et al. (2005) model; ABS_DAC_KOTH absolute value of DAC_KOTH; DAC_DECH discretionary accruals computed using Dechow et al. (1995) model; ABS_DAC_DECH absolute value of DAC_DECH; DAC_KRAS discretionary accruals computed using Krasnik (1999) model; ABS_DAC_KRAS absolute value of DAC_KRAS; FCF free cash flow; BDY binary variable where 1 dividend yield >0 and 0, otherwise; LEV leverage; LN(AT) logarithm of total assets; ROA return on assets; CRS binary variable were 1=[2009;2013] and 0=[2014;2016];
19
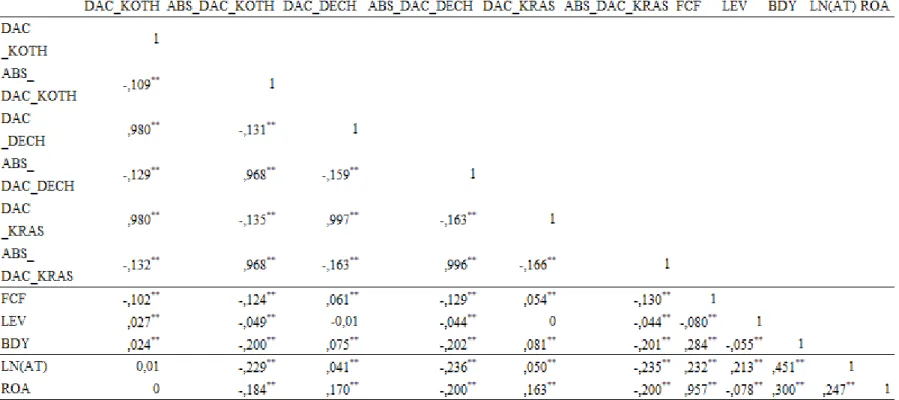
5.2. Pearson’s correlation matrix
Pearson’s correlation matrix assures that the measures computed do not have multicollinearity problems, and allows one to infer about the relationship between the measures.
By analyzing the matrix (Table IV), it’s observable that all measures of DAC variables are highly correlated amongst each other, meaning that the application of the research model to any of these measures would lead to significant conclusions. For that reason, furtherly, only Kothari et al. (2005) model will be used to perform the analysis.
The dependent variable of the research model (DAC) is negatively and significantly correlated with FCF, and positively and significantly correlated with BDY and LEV. These correlations are supported by previous literature, which is stated on the literature review chapter (chapter II).
Additionally, the connection between the interest variables of the study is relatively low, lying in and absolute range of 0.055 and 0.284, thus multicollinearity is not a major problem in interpreting coefficients (Judge et al., 1988).
ROA is highly positively correlated with FCF. This connection means that as firms’ revenues increase (or decrease), FCF also increase (or decrease), ceteris paribus, meaning that the amount of cash a business can generate is connected positively with its’ assets, which leads to the conclusion that the better the sample firms perform (higher ROA), the more cash they generate (higher FCF).
Lastly, the correlation between ABS_DAC and ROA is negative, thus firms with higher operational earnings enroll in less EM, as supported by Tendeloo & Vanstraelen (2008) and Santos (2017).
20
Table IV - Pearsons’ correlation matrix
Variables: DAC_KOTH discretionary accruals computed using Kothari et al. (2005) model; ABS_DAC_KOTH absolute value of DAC_KOTH; DAC_DECH discretionary accruals computed using Dechow et al. (1995)) model; ABS_DAC_DECH absolute value of DAC_DECH; DAC_KRAS discretionary accruals computed using Krasnik (1999) model; ABS_DAC_KRAS absolute value of DAC_KRAS;FCF free cash flow; BDY binary variable were 1=dividend yield >0 and 0=dividend yield=0; LEV leverage; LN(AT) logarithm of total assets; ROA return on assets;
21
5.3. The impact of the free cash flow, dividend and leverage to
earnings management
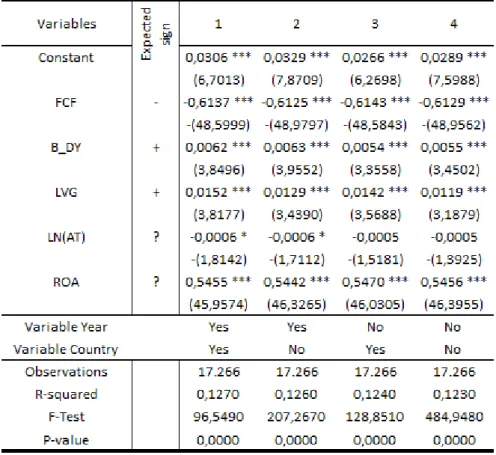
5.3.1. Effect in terms of direction
The result of the multivariate model (OLS) presented below on Table V. allow to take conclusions about the impact of the interest variables over EM in terms of its’ direction. The association between the independent variables FCF and DAC, shows a negative beta coefficient, statistically significant at 1%, in all model specifications, validating the second hypothesis of this study. This translates that managers of firms with higher levels of free cash flow manage earnings with the intent to its’ reduction. These findings are in line with the hypothesis of smoothing earnings stated by Beker et al., (1998) and Dechow et al., (2010) and the hypothesis proposed by Jensen (1986) that states that managers in firms with higher levels of free cash flow tend to use its’ cash to invest in non-profitable projects linked to their own welfare.
The second variable of interest is a binary variable with respect to dividend payment. Its beta coefficient is positive and statistically significant at 1% on every models’ specifications, indicating that firms that pay dividends manage earnings upwards, which is supported by the literature (Roychowdhury, 2006 and Graham et al., 2005) inferring that these companies suffer from market pressure to meet dividend thresholds or inflate earnings to justify a certain payout policy. The result validates the forth hypothesis of this study.
22
Table V - Kothari (2005) regression model results (DAC)
Variables: FCF free cash flow; BDY binary variable were 1=dividend yield >0 and 0=dividend yield=0; LEV leverage; LN(AT) logarithm of total assets; ROA return on assets;
The outcomes for leverage show that its’ relationship with DAC is positive and statistically significant at 1% significance for all scenarios. This result validates the sixth hypothesis, implying that leverage pressures firms’ management to fulfill debt covenants, when its’ violation is probable or to take advantage on renegotiating terms. Thus, firms with higher levels of leverage tend to manage earnings upwards (DeFond and Jiambalvo, 1994 and Chamberlain et al., 2014).
Concerning the control variables, the log of total assets shows a negative sign for all cases but it’s not statistically significant. The return on assets control variable has a positive effect on DAC, and it is always statically significant at 1% significance. However, in this
23
study ROA serves the purpose of controlling a firm’s profitability divergences, and its effects could be interpreted as that firms with higher ROA manage earnings upwards.
5.3.2. Effect in terms of intensity
Table VI. argues that the results of the multivariate use the previously estimated absolute value of DAC model as dependent variable. Its results provide understanding about earnings management as a “quantity” regardless of its’ direction.
According to the table, and regarding the variables of interest, FCF presents a positive sign, and is statistically significant at 1% significance for all cases. This result means that the higher the free cash flow available the more EM it practices (Jensen, 1986 and Chung, Firth & Kim, 2005 and Labhane and Mahakud, 2016). Indicating that managers are more willing to “waste” their firms’ cash when more cash is generated. The result validates the first hypothesis of this study.
The dividend variable presents a significant (1%) negative sign, for all model specifications, which implies that firms that pay dividends enroll in less earnings management. The signaling effect of the dividend could lead to a high level of scrutiny over paying dividends firms, which could mitigate EM. Other plausible effects lie on the moral hazard risk faced by firms connected to an EM situation. This could back fire to the firm, representing a great loss of credibility on the market, which could, consequently, drive the quotation down. In addition, paying dividends reduces the available cash on managers hands, mitigating EM (Jensen, 1986 and Guizani, 2018).
24
Table VI - Kothari (2005) regression model results (ABS_DAC)
Variables: FCF free cash flow; BDY binary variable were 1=dividend yield >0 and 0=dividend yield=0; LEV leverage; LN(AT) logarithm of total assets; ROA return on assets;
On the leverage side, the negative significant coefficient indicates that firms with higher levels of leverage tend to enroll in less EM. Similarly, to the dividend variable effects, increasing the leverage weight on a firm’s capital structure would imply a greater scrutiny from debt providers and a reduction on FCF, which mitigates EM (Jensen, 1986; Rodriguez-Pérez and Van Hemman, 2010; Afza and Rashid, 2014; Jelinek, 2007). The control variables (LN(AT) and ROA), present a negative and statistically significant (1%) relationship with ABS_DAC, meaning that the higher the firms’ asset level is, less EM it practices and that the higher the ROA the less EM it practices, respectively.
25
5.3.3. Robustness analysis
In order to confer robustness on the previous results, two subsamples were created. The DAC variable previously used to conduct the directional analyses on EM, were divided into only positive (negative) subsamples. The multivariate model presented on Eq. 5 was applied onto each subsample. The rationale behind the process is to access if the interest variables effects changes within firms’ that inflate (deflate) earnings.
Secondly, in order to access the crises effect of the interest variables on EM and to confer robustness to the first results, a binary variable (B_CRS) was introduced on the multivariate model presented on Eq. 5 and, the sample was divided into two subsamples: crisis period covering from 2009 to 2013 (European commission report 2014) and post-crisis period, covering from 2014 to 2016.
The multivariate model used was the same (Kothari et al., 2005), and for positive DAC estimated values, the free cash flow effect keeps constant with the previous analysis. The effect is negative and statistically significant at 1% significance for all model specifications, meaning that amongst the firms that inflate earnings, firms with higher level of FCF inflate to lower amounts. Hence, firms with higher FCF, amongst inflating earnings firm, manage earnings to less positive values. The dividend presents a negative statistically significant (1%) beta. The results indicate that amongst the firms with positive DAC, dividend paying firms have less DAC, which means that these firms inflate earnings, but in less quantity than if they do not pay dividends. This effect is once again connected with market scrutiny and reputational factors of listed firms. On the leverage side, the relationship is statistically significant (10%) for (1) and (3) model specifications while is not statistically significant for (2) and (4). The beta coefficient is positive, indicating that amongst the firms that inflate earnings, higher levels of debt conduct to more inflate earnings. However, it’s not possible to take any conclusion from the result, due to insufficient statistically significance, the results support the previous conclusions (Table VII).
Keeping everything else constant, the model was applied to negative estimated DAC only. The results for FCF are negative and statistically significant (1%). This means that for firms that deflate earnings, high levels of FCF drive reported earnings to even lower values. The conclusion confirming again the second hypothesis of the study. In dividend
26
paying terms, the overall effect is that amongst the firms with negative DAC, dividend paying firms tend to increase earnings. This outcome is supported by the signaling effect of the dividend and by the smoothing earnings theory (Allen and Michaely, 2003; Brav et al., 2005). The same effect occurs with leverage, as firms with high leverage amongst the negative DAC firms push earnings to fewer negative values.
Table VII. - Regression results for negative and positive DAC
To study the crisis economic shock, a crisis binary variable was added to the model. It assumed the value of 1 when the observation lied on the crisis period (2009 – 2013) and 0 otherwise. The purpose was to provide understanding on how the crises affected the interest variables impact on EM. In term of direction, the results corroborate with the previous analysis (Table VIII), meaning that during the crisis period the firms behaved as usual, showing a negative significant (1%) beta for FCF, and positive significant (1%) betas for BDY and LEV. The crisis variable presents a negative value, significant at 10% significance, meaning that during crises firms intended to drive earnings to lower levels
27
through DAC. In terms of quantity of EM, the effect of each variable was not affected, and the crisis binary presents a positive and statistically significant at 1% significance coefficient, meaning that during crisis, firms enroll in more EM. These effects can be explained by the attempt to hide lower performances, or by the fact that lower performances were expected, which could lead managers to intentionally decrease reported earnings.
Table VIII. - Regression results including the impact of the financial crisis
Finally, the sample was divided basing on non-crisis period and crisis period. The first subsample counts 10.290 observations and the second 6.976 observations. The purpose of the division is to confirm the results of the crisis binary, and again to access the crisis effect on the interest variables with respect to EM. In directional terms, the overall effect of the variables is constant and corroborates the previous results. The subsample method
28
allows one to compare the regression coefficients. Thus, it’s observable that, for both periods, the FCF is significant at 1% significance, and has a higher coefficient on the post-crisis subsample. This leads to the conclusion that during the crisis the FCF impact on DAC was negative but less pronounced than after crisis. On dividend and leverage terms, both experienced a reduction on coefficient and significance when moving from a during crisis to a post-crisis period, which means that during the crisis, firms’ management gave much more attention to these two measures than after the crisis.
6. C
ONCLUSION
The Great Recession was the largest economic and financial crisis since the Great Depression (1929-1939). Although some countries and industries have already recovered from its’ initial global effects, some are still experiencing its’ consequences as if it occurred less than 1 year ago. These effects have been examined by several studies on accounting matters, either in terms of effects over firms’ books or in terms of markets’ reaction over firms’ disclosures (Gaio, 2010; Santos, 2017)
This study is not different from the referred. Its’ first goal was to understand the connection between the quantity of free cash flow and leverage, and the payment of dividends of European state member firms and its practice of earnings management. For this purpose, the study uses a sample of around 2.150 firm-year observations, of Euro-zone listed companies, from 2009 to 2016, containing a total of 17.266 observations. Subsequently, the sample is divided to analyse the impact of the great recession on firms’ earnings management engagements.
The results indicate that, for these specific sample characteristics, the relationship between the FCF and EM is negative in terms of its’ direction and positive in terms of its’ quantity, meaning that managers of firms with more cash, manage firms’ earnings with the intent to its reduction (Kadioglu and Yimaz, 2017) and, simultaneously that, in the same conditions, more FCF leads to more EM (Chung et al., 2005; Lanhane and Mahakud, 2016; Jensen, 1986). Further analysis was conducted to corroborate the first conclusions, and the results support the first conclusions, meaning that regardless of the firms overall EM goal, more FCF leads managers to deflate earnings.
29
Opposingly, the link between LEV and BDY, and EM is positive regarding its’ direction and negative regarding its’ quantity, meaning that managers in firms that pay dividends or firms with more leverage inflate earnings confirming Graham et al. (2005), Roychowdhury (2006), DeFond and Jiambalvo (1994) and Chamberlain et al. (2014), and that in the previous situation they enroll in less EM (Jensen, 1986 and Guizani, 2018 and Rodriguez-Pérez and Van Hemman, 2010; Afza andRashid, 2014; Jelinek, 2007). A deeper analysis indicates that for dividend paying firms this connection could be characterized as a smoothing earnings practice, since for these firms the role of dividends is inversible related with the EM intention. The same analyses on LEV indicates that independently of the EM goal, high levels of leverage conducts to increase reported earnings, supporting the hypothesis from DeFond and Jiambalvo (1994) and Chamberlain et al. (2014).
The introduction of a crisis scenario on this study, leads to the conclusion that during its’ period, firms’ managed earnings to inflate them, but lesser than on crisis off period, and that firms’ practices more EM during crisis than on off crisis periods. The analysis also indicates that the overall relationship of each of the interest variables did not change in sign terms although it has changed it terms of proportions. This crisis’ effect on EM can be justified by the firms relieve of market pressure to disclose “good” results, since it’s expectable that they should be “bad”, and by the theory of delaying “good” news when they are not expected.
The main limitation of this study is the fact that we assumed to be a non-crisis period is a period whether most countries and industries are still recovering from one of the biggest economic shocks that ever occurred, the great recession. Other limitations emerge from the measure of EM. Additionally, EM can assume several forms and, it’s a very subjective concept that becomes hard to measure (Leuz et al., 2003).
For future investigation, a similar study using another measure of EM, such as other models to compute its proxy or a focus on REM instead of AEM is recommended. Another study could go through the application of this same methodology to other geographic areas or non-listed firms, or to firms in the financial and public sectors, with the necessary adjustments. Lastly, a study that covers the time frame limitation of this study, using a more distant data for post-crisis period is suggested.
30
7. REFERENCES
Afza, T., & Rashid, B. (2014). Opportunistic earnings management, debt and diversification: empirical evidence for manufacturing firms of Pakistan. Science
International, 26(5).
Allen, F., & Michaely, R. (2003). Payout policy. In Handbook of the Economics of
Finance (Vol. 1, pp. 337-429). Elsevier.
Aman, A., Pourjalali, H., & Teruya, J. (2006). Earnings management in Malaysia: A study on effects of accounting choices. Malaysian Accounting Review, 5(1), 185-209.
Becker, C. L., DeFond, M. L., Jiambalvo, J., & Subramanyam, K. R. (1998). The effect of audit quality on earnings management. Contemporary accounting research, 15(1), 1-24.
Bharath, S. T., Sunder, J., & Sunder, S. V. (2008). Accounting quality and debt contracting. The Accounting Review, 83(1), 1-28.
Bjurman, A., & Rahman, A. (2014). Who is winning the earnings game?: A study about earnings management and subsequent stock returns in the US equities market.
Brav, A., Graham, J. R., Harvey, C. R., & Michaely, R. (2005). Payout policy in the 21st century. Journal of financial economics, 77(3), 483-527.
Chamberlain, T. W., Butt, U. R., & Sarkar, S. (2014). Accruals and real earnings management around debt covenant violations. International Advances in Economic
Research, 20(1), 119.
Chung, R., Firth, M., & Kim, J. B. (2005). Earnings management, surplus free cash flow, and external monitoring. Journal of business research, 58(6), 766-776.
Coase, R. H. (1937). The nature of the firm. economica, 4(16), 386-405.
Cohen, D. A., & Zarowin, P. (2010). Accrual-based and real earnings management activities around seasoned equity offerings. Journal of accounting and Economics, 50(1), 2-19.
31
Dechow, P. M., Sloan, R. G., & Sweeney, A. P. (1995). Detecting earnings management.
Accounting review, 70, 193-225.
Dechow, P., Ge, W., & Schrand, C. (2010). Understanding earnings quality: A review of the proxies, their determinants and their consequences. Journal of accounting and
economics, 50(2-3), 344-401.
DeFond, M. L., & Jiambalvo, J. (1994). Debt covenant violation and manipulation of accruals. Journal of accounting and economics, 17(1-2), 145-176.
Dichev, I. D., Graham, J. R., Harvey, C. R., & Rajgopal, S. (2013). Earnings quality: Evidence from the field. Journal of Accounting and Economics, 56(2-3), 1-33.
Fama, E. F., & French, K. R. (2001). Disappearing dividends: changing firm characteristics or lower propensity to pay?. Journal of Financial economics, 60(1), 3-43. Fama, E. F., & Jensen, M. C. (1983). Agency problems and residual claims. The Journal
of Law and Economics, 26(2), 327-349.
Farinha, J., & Moreira, J. A. (2007). Dividends and earnings quality: the missing link. CETE/Faculty of Economics/University of Porto. Retrieved June, 10, 2010.
Fields, T. D., Lys, T. Z., & Vincent, L. (2001). Empirical research on accounting choice.
Journal of accounting and economics, 31(1-3), 255-307.
Gaio, C. (2010). The relative importance of firm and country characteristics for earnings quality around the world. European accounting review, 19(4), 693-738.
Graham, J. R., Harvey, C. R., & Rajgopal, S. (2005). The economic implications of corporate financial reporting. Journal of accounting and economics, 40(1-3), 3-73. Guizani, M. (2018). The mediating effect of dividend payout on the relationship between internal governance and free cash flow. Corporate Governance: The International
Journal of Business in Society.
Gul, F. A. (2001). Free cash flow, debt-monitoring and managers' LIFO/FIFO policy choice. Journal of corporate finance, 7(4), 475-492.
32
Gunny, K. A. (2010). The relation between earnings management using real activities manipulation and future performance: Evidence from meeting earnings benchmarks.
Contemporary Accounting Research, 27(3), 855-888.
Healy, P. M., & Wahlen, J. M. (1999). A review of the earnings management literature and its implications for standard setting. Accounting horizons, 13(4), 365-383.
Jelinek, K. (2007). The effect of leverage increases on earnings management. The Journal
of Business and Economic Studies, 13(2), 24.
Jensen, M. C. (1986). Agency costs of free cash flow, corporate finance, and takeovers.
The American economic review, 76(2), 323-329.
Jensen, M. C., & Meckling, W. H. (1976). Theory of the firm: Managerial behavior, agency costs and ownership structure. Journal of financial economics, 3(4), 305-360. Jones, J. J. (1991). Earnings management during import relief investigations. Journal of
accounting research, 29, 193-228.
Judge, G. G., Hill, R. C., Griffiths, W. E., Lutkepohl, H., & Lee, T. C. (1988). Introduction to the Theory and Practice of Econometrics.
Kadioglu, E., & Yilmaz, E. A. (2017). Is the free cash flow hypothesis valid in Turkey?.
Borsa Istanbul Review, 17(2), 111-116.
Kasznik, R. (1999). On the association between voluntary disclosure and earnings management. Journal of accounting research, 37(1), 57-81.
Kothari, S. P. (2001). Capital markets research in accounting. Journal of accounting and
economics, 31(1-3), 105-231.
Kothari, S. P., Leone, A. J., & Wasley, C. E. (2005). Performance matched discretionary accrual measures. Journal of accounting and economics, 39(1), 163-197.
Kothari, S. P., Mizik, N., & Roychowdhury, S. (2015). Managing for the moment: The role of earnings management via real activities versus accruals in SEO valuation. The

![Table IX – Results of the regression models to a subset of during crisis period (Year=[2009;2013])](https://thumb-eu.123doks.com/thumbv2/123dok_br/15457244.1029552/43.892.126.770.227.891/table-results-regression-models-subset-crisis-period-year.webp)
![Table X – Results of the regression models to a subset of post-crisis period (Year=]2009;2016]](https://thumb-eu.123doks.com/thumbv2/123dok_br/15457244.1029552/44.892.124.769.156.851/table-results-regression-models-subset-crisis-period-year.webp)