Impact of Mobile Broadband in
the Mobile Telecommunication
Industry
Final Paper in the form of Dissertation presented to Universidade Católica Portuguesa to obtain a master’s degree in Business Economics
by
Mª Francisca Seabra da Silva
Under the guidance ofProf. Ricardo Gonçalves
Universidade Católica Portuguesa September 2017
Acknowledgments
First of all, I would like to express my sincere gratitude to my thesis advisor, Professor Ricardo Gonçalves, who steered me in the right direction to write this master’s thesis. In all stages of this process, the professor supported me and helped me whenever I ran into a trouble or had a question about the research. I am sincerely thankful to have been able to learn and work with Professor Ricardo Gonçalves.
Throughout these two long years my family and friends supported me unconditionally and, to them, I would like to express my profound appreciation. With a special thanks to my mother, father and little sister I would like to say that without their continuous, but thousands of miles away, encouragement and support I wouldn’t be able to accomplish this goal.
Thank you,
Abstract
The goal of this master’s thesis is to answer to the following research question: What are the relationships between mobile broadband and mobile telecommunication revenues and mobile broadband and market structure?
My approach is econometric in nature. I developed two equations with the purpose of analyzing the impact of mobile broadband in the telecommunication industry and used the STATA program to regress the different models. For the first equation, I conducted a panel data approach of 34 OECD countries over the period 2009 and 2013. For the second equation, I used a cross section method of the same 34 OECD countries and for the year 2013.
First, the results suggest that there exists a positive relationship between mobile broadband subscriptions and mobile telecommunication revenues which, in relative terms, is more sizeable than that of voice calls. This result demonstrates the growing importance of broadband mobile traffic for mobile operators. Second, there appears not to exist a statistically significant relationship between mobile broadband prices and market structure, an opposite result to that of Genakos, Valletti and Verboven (2017) for the mobile industry as a whole. This suggests that different and novel forms of competition may underlie the provision of mobile broadband services.
Keywords: mobile telecommunication; mobile telecommunication revenues; mobile broadband; market structure; mobile basket prices
Table of Contents
Acknowledgments ... iii Abstract ... iv Introduction ... 12 Chapter 1 ... 16 Literature Review ... 16 Chapter 2 ... 20 Data Description ... 202.1. Countries and Years... 20
2.2. Mobile Telecommunication Revenues ... 21
2.3. Cellular Mobile Subscriptions ... 24
2.4. Total Wireless Broadband Subscriptions by access technology ... 26
2.5. Mobile Basket Prices ... 30
2.6. Market Structure ... 34 Chapter 3 ... 37 Empirical Framework ... 37 3.1. Equations ... 37 3.2. Common Problems ... 40 Chapter 4 ... 42
Main Results and Discussion ... 42
4.1. Equation 1 ... 42
4.2. Equation 2 ... 48
Conclusion ... 53
Bibliography ... 56
Appendix ... 58
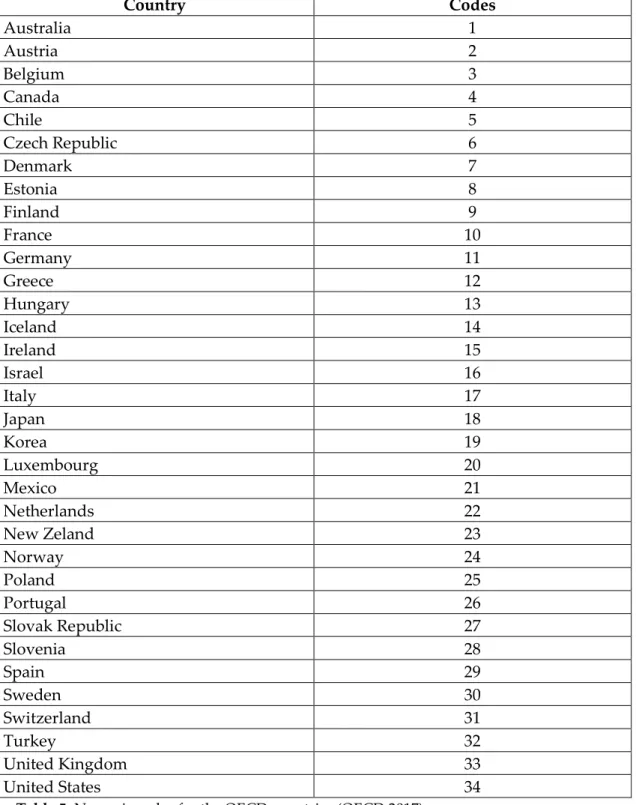
1. Numeric codes for the OECD countries ... 58
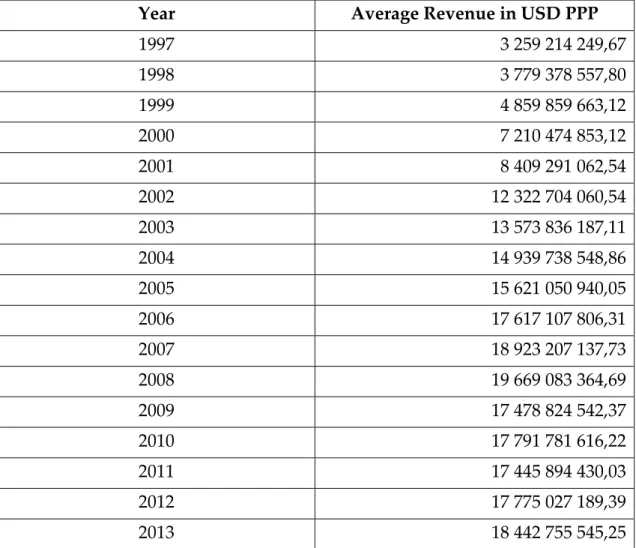
2. OECD Mobile Telecommunication Revenue Average ... 59
3. OECD Cellular Mobile Subscriptions ... 60
5. OECD total wireless broadband subscriptions by dedicated mobile data 61
6. Market Structure for OECD countries ... 62 7. GDP per capita 2013 for OECD countries ... 63 8. 3G cellular mobile subscriptions for the OECD area in 2013 ... 64 9. Public Telecommunication Investment per capita for the OECD area in 2013 ... 65 10. Summary Statistics ... 66
List of Graphics
Graphic 1: OECD Mobile Telecommunication Revenues Average (in USD PPP) (OECD, 2015) ... 24
Graphic 2: OECD Cellular Mobile Subscriptions (in units) (OECD, 2015) ... 26 Graphic 3: Total OECD wireless broadband subscriptions by standard mobile (in units) (OECD, 2015) ... 28
Graphic 4: OECD Total wireless broadband subscriptions by dedicated mobile data (in units) (OECD, 2015) ... 29
Graphic 5: Market Structure for OECD countries calculated through HHI (in percentage) (Source: OECD, 2015) ... 36
List of Tables
Table 1: Information about the mobile baskets' prices (values for 2014 in USD PPP) (Source: OECD, 2015) ... 33
Table 2: Mobile Baskets OECD average price and the corresponding logarithm (Source: OECD, 2015) ... 33
Table 3: Results of Equation 1 (standard errors are presented in parenthesis bellow the coefficients); * ** *** represents the significance level at 10%, 5% and 1%, respectively ... 47
Table 4: Results of Equation 2 (standard errors are presented in parenthesis bellow the coefficients); * ** *** represents the significance level at 10%, 5% and 1%, respectively ... 52
Table 5: Numeric codes for the OECD countries (OECD 2017) ... 58 Table 6: OECD Mobile Telecommunication Revenue Average in USD PPP between 1997 and 2013 (units) (OECD 2015) ... 59
Table 7: Sum of the cellular mobile subscriptions of all 34 OECD countries between 1997 and 2013 (units) (OECD 2015) ... 60
Table 8: OECD total wireless broadband subscriptions by standard mobile (units) (OECD, 2015) ... 61
Table 9: OECD total wireless broadband subscriptions by dedicated mobile data (units) (OECD, 2015) ... 61
Table 10: Market Structure for OECD countries calculated trough HHI (values that support graphic 5; presented in percentage) (Source: OECD, 2015) ... 62
Table 11: GDP per capita in 2013 for the 34 OECD countries (values in USD PPP) (Source: OECD, 2017) ... 63
Table 12: 3G cellular mobile subscriptions for the 34 OECD countries in 2013 (values in units) (Source: OECD, 2015)... 64
Table 13: Public Telecommunication Investment per capital for the OECD area in 2013 (values are presented in USD) (Source: OECD, 2015) ... 65
Table 14: Summary Statistics of all variables (observations, mean, standard deviation, minimum, maximum and median) (Stata, 2017) ... 66
Introduction
Telecommunications is a diverse industry that comprises companies that manage, regulate and develop all communications at a certain range of distance. These types of communications can be established, for example, through mobile phones, all kinds of portable computing devices (smartphones, computers, tablets, …), telegraph, also through the internet, amongst others.
Since the beginning, this industry has been changing and evolving. If we analyzed this industry and its implications a few years ago, compared to the reality of today, we would obtain very distinct results. For instance, initially, the telecommunication sector was under severe regulation, and today, we have an almost unregulated market. Another good example that can demonstrate the drastic changes in this market is what is occurring with the roaming segment. In the present year, 2017, the European Commission decided to put an end to this segment of the telecommunication sector. Currently, it is possible to “remain connected while travelling in the EU, for the same price as at home” (European Commission, June 2017). Similarly, some years ago, a single computer was the size of an entire room, and today, we have a device that can substitute a computer in our hands, daily. With our mobile phones and smartphones we can have access to everything and connect with everyone, no matter the region, the country or even the continent. The mobile telecommunication has changed greatly in the past years and has dramatically changed the way we communicate and interact with other people.
In the 90s, when the Internet appeared, its core purpose was to serve the business world and people only used it in their work environment. Dial-up access allowed for the massification of the internet at a low cost to consumers. Meanwhile, a necessity of accessing to information in fractions of seconds and in real time was emerging and, so, broadband was developed (ADSL or cable). Afterwards, in the mobile segment, 2G and 2.5G emerged and allowed a limited internet mobile use, but it was only with the mobile phones 3G that the ability to develop mobile broadband was created.
Broadband is a term used to explain high speed telecommunications systems that support great amounts of information, such as, voice, high-speed data services and video services (European Commission, 2017). If we speak about mobile broadband, we are referring to those types of systems that are wireless (do not require any physical connection), more precisely, we are referring to “wireless high-speed internet access” (European Commission, 2017). These types of wireless connections can be made through, for example, a portable modem, telephone, smartphone, or other devices.
According to the OECD statistics, in December 2016 the mobile broadband segment reached a penetration of about 99 subscriptions per 100 inhabitants, which translated in numbers represents 1,275 billion subscriptions in a population of 1,284 billion people (OECD, 2017). Comparing with 2015, in 2016 the mobile broadband subscriptions for the OECD countries grew about 9,8%. Our country, Portugal, amongst others such as Poland, Slovenia, Chile, Turkey and Mexico, were the countries with the highest growing rates in the last 6 months of 2016 (between 22% and 12%) (OECD, 2017).
The main purpose of this master’s thesis is to study and analyze the Mobile Telecommunication market and its evolution and changes over the last few years. Therefore, I decided to focus my analysis on a specific segment of this industry: mobile broadband. In order to visualize and understand the impact and
importance of mobile broadband in the industry and its competition level, I propose to answer to the following research question:
1. What are the relationships between mobile broadband and mobile telecommunication revenues and mobile broadband and market structure?
After reading the Genakos, Valetti & Verboven (2017) paper about the evaluation of market consolidation in mobile communications, I decided to conduct a similar approach (with slight differences) but for a specific segment of the industry. In this paper, the authors studied the relationship between market structure and prices and between market structure and investment in mobile telecommunications and regressed three different equations. The first one studies the relationship between retail prices and market structure and the other two equations study the relationship between investment and market structure. Both equations include several control variables that may influence both the dependent and independent variables.
My approach, as I said before, is for a specific segment of this industry, mobile broadband, and I decided to analyze two equations. The first one studies the relationship between mobile telecommunication revenues and the number of subscriptions of mobile broadband (cellular mobile subscriptions, wireless mobile subscriptions of standard mobile and wireless broadband subscriptions of dedicated mobile data). The second equation is very similar to the first equation of Genakos, Valetti & Verboven (2017) and studies the relationship between mobile baskets prices and market structure, containing control variables (these variables are not all equal to the ones used in their paper).
In order to regress these equations, I used the data analysis and statistical software, Stata. This program enables the analysis of several datasets, data management and the analysis of graphics. Some of Stata’s basic features are: basic tabulations and summaries; linear regression; time series smoothers; sample
selection; survey data; contrast and comparisons; power analysis, among other features (Stata, 2017).
Regarding the structure of this thesis, firstly there is a literature review about the mobile telecommunication industry, broadband, market structure and mobile baskets; secondly, a description of the data used in each model is made (mobile telecommunication revenues, cellular mobile subscriptions, total wireless broadband subscriptions by access technology, mobile basket prices, market structure, GDP per capita and public telecommunication investment); next there is the empirical framework and the presentation and analysis of the main results, and finally, the conclusion.
Chapter 1
Literature Review
The literature review gives a clearer sense of the work that has been done through the years regarding concepts, industry or market. In this chapter, I contextualize the mobile telecommunication industry and how it has been evolving, namely regarding the form and intensity of competition among operators.
The basis for this master thesis is Genakos, Valletti & Verboven (2017), where they address and study the impact of market structure on prices and investment in the mobile telecommunication industry. Their results suggest that, for the period between 2002 and 2014 in 33 OECD countries, when mobile markets become less competitive, the prices for the final consumer increase (their comparison basis was a market with no concentration).
One of the differences between my work and this paper is that the authors actually analyzed the separate impact of market structure on total industry investment, and in my analysis, I took that last variable as a control variable that could influence market structure. Their findings suggest that, at country level, there is an insignificant effect of market structure on total industry investments, but some theoretical work would suggest that there is a relationship between these two variables (in fact, theoretically, an inverse relation exists, meaning that when market structure is stronger, total industry investment decreases). Genakos, Valletti & Verboven (2017) also provide some justifications for the
finding “concentration has no effect in industry investment” such as the existence of fixed cost savings and economies of scope. Additionally, Genakos et al. (2017) use Teligen data relative to low, medium or high uses of mobile communication. They essentially refer to calls and messages and in my analysis, I used information about OECD mobile baskets that incorporate broadband.
The work of Sung and Kwon (2011), can contrast with a few results of Genakos et al. (2017) in the sense that, for the period of 1998 and 2009 in OECD countries, they discovered no relation between market concentration and mobile prices. Essentially, the work of these authors differs in a way that they also studied the relationship between market concentration and profits and found that there is a positive relationship between these two variables (which means that as market concentration increases, profits should also increase). In order to support these results, the authors analyzed two different, but related theories: the market power hypothesis and the efficiency hypothesis. The first one believes that the more concentrated the market structure is, the worse is market performance (meaning, that the profits would be lower). Contrarily, regarding the efficiency hypothesis, it argues that a more concentrated market structure is not always harmful to consumer welfare. Based on these two hypotheses, the authors were able to conclude that the first hypothesis, the market power hypothesis, could be rejected in the OECD mobile markets and that this could lead to an interruption of government intervention, since concentrated market would not prejudice final consumers.
In this period of time (1998 to 2009) the industry witnessed a decrease in prices, more precisely, mobile prices decreased 68,32% between 1999 and 2009. At the same time, the number of mobile subscribers also increased, but in contrast, the number of fixed telephones lines was reduced (Sung and Kwon, 2011).
These last results show and support the importance of mobile telecommunication in our community and its evolution over time. People in the
2000s were investing more in communications over portable devices instead of fixed telephones. Also, one of the trends of that period of time (and that actually remains in these days) is customer loyalty (the ability of a consumer to remain with a certain brand over a long period of time, not trading its services or goods for a competitor’s services or goods). People started to invest in long term relations with their mobile operators, meaning that prepaid subscribers started to decrease (Sung & Kwon, 2011).
Affeldt & Nitsche (2014), also studied the relationship between market concentration and price levels, found some limitations (they concluded that there is not a positive relation between these two variables and found some indications that such relation could be negative) and proposed a different method in order to account for quality differences across countries. These authors studied the industry for the period between 2003 and 2012 in European markets and just like Sung & Kwon (2011) they argue that there might be a statistically insignificant relation between market concentration and prices when a linear time trend is included in the analysis.
Market concentration (which can be calculated through diverse methods) is, many times, considered a competition measure of different markets, but according to Boone, Griffith & Harrison (2005), concentration-based measures are not the most suitable ones. To fully comprehend the relation between market concentration and prices, other variables should be included in the analysis, such as trend in costs and quality and demand differences between countries (Affeldt & Nitsche, 2014).
Countries have different factors that influence prices and market concentration and the analysis of such impact may not be accounted in the same way for all countries. For instance, in the UK market, the most reliable measure of the degree of competition is through profits (Boone, Griffith & Harrison, 2005).
Namely, the authors believe and argued that this measure enables a more “robust representation of competitiveness”.
Despite the fact that results showed profits are the best approach (mainly because they are not as dependent to cyclical changes as other measures), there are some questions about its reliability, since for a different industry the degree of competition can be measured in other ways and be influenced by other factors. It is also important to remember that the study of those authors was conducted for a single geographical market, United Kingdom (UK). Boone, Griffith & Harrison (2005) also mentioned that the worst measure is the Herfindahl index, and they even question its usefulness as a measure of competition, but as stated before, this result can be changed by the possibility of existence of new drivers in a certain industry.
Industries are different and must be measured in different ways, especially the mobile telecommunication industry. This industry is in constant change and its growth and evolution drivers can modify through time. There are always new technologies and new trends that influence consumers, their choices and, consequently, impact mobile operators. These factors that influence the emergence and development of new technologies are, for example, per capita income, urbanization, internet/broadband penetration and regulation. All of these drivers have a positive influence on the mobile telecommunication market (Bohlin, Gruber & Koutroumpis, 2010).
Mobile broadband is a market segment of great importance in the industry and a measure of technology evolution for the consumer. In fact, this segment combining with GDP per capita constitute two great factors that positively and significantly impact the industry and constitute two country level diffusion parameters (Bohlin, Gruber & Koutroumpis, 2010).
Chapter 2
Data Description
The data that supports the present paper was obtained from the OECD website, namely from the “OECD Digital Economy Outlook 2015”. For both equations, I used the information available in the tables, and also the information in the book online itself for all 34 OECD countries.
In the following chapters I will describe how the data for each variable was treated and analyzed, namely what were the countries in my analysis and the time horizon, and, also, the description of the following information: mobile telecommunication revenues, number of cellular mobile subscriptions, total wireless broadband subscriptions for standard mobile and dedicated mobile data, mobile baskets prices, market structure, GDP per capita, 3G cellular mobile subscriptions and public telecommunication investment.
2.1. Countries and Years
The countries analyzed were the 34 OECD countries: Australia, Austria, Belgium, Canada, Chile, Czech Republic, Denmark, Estonia, Finland, France, Germany, Greece, Hungary, Iceland, Ireland, Israel, Italy, Japan, Korea, Luxembourg, Mexico, Netherlands, New Zeland, Norway, Poland, Portugal, Slovak Republic, Slovenia, Spain, Sweden, Switzerland, Turkey, United Kingdom and United States.
For both datasets I transformed the countries into numeric codes1 in order to
be able to work in Stata, since the program only accepts numeric variables and not string variables.
Regarding the time trend, in equation 1 the data set has information since 1997 to 2013 and in equation 2 the analysis is made only for the year of 2013.
In both equations, there are some missing values for some years and for some countries, so in order to obtain a cleaner regression those missing values were dropped when the regression was made.
2.2. Mobile Telecommunication Revenues
The Mobile Telecommunication Revenues are presented from 1997 to 2013 for the 34 OECD countries and the values are all in USD PPP.
Purchasing Power Parity (PPP) is a form of currency conversion that matches the purchasing power of different countries (and therefore, different currencies) by eliminating the existing differences in price levels (OECD, 2017). Taking into account the exchange rate, the purchasing power parity concept states that two currencies being analyzed are in equilibrium when goods are priced the same in both countries (not by the same numeric value, but by the same psychological and economic value, taking into consideration the cost of living and inflation rates of both countries) (Investopedia, 2017).
This rate of conversion is calculated by dividing the price of a certain good or product in a certain currency by the price of that certain good or product in another currency. For example, a t-shirt of a certain brand costs 5€ in Portugal, and that same t-shirt of that brand costs 8$ in the United States of America, so the
PPP for that t-shirt between Portugal and USA is calculated by the fowling formula:
5 8
⁄ = 0,625
This result means that for every dollar spent on that t-shirt of that certain brand in the USA, 0,625 euros would have to be spent in Portugal to obtain the same quantity and quality of that t-shirt.
Mainly, PPPs are used to compare GDP (in terms of the size of economies) and to compare price levels, but, at the same time, this method has some limitations regarding its use. For example, it is recommended to use PPPs carefully if we are conducting an analysis over time of GDP per capita and relative prices and a comparison of cost of living. The analysis of these situations requires the study of variants other than PPPs and if it is not conducted properly, the analysis can be biased and lead to wrong conclusions. Also, PPPs should not be used, at all, as a measure of countries’ ranking, as national growth rates, as precise exchange rates and to conduct productivity comparisons by industry, among other situations (OECD, 2017).
The basis for the Mobile Telecommunication revenues analysis was dataset “2.24 Mobile telecommunication revenue” of the Digital Economy Outlook 20152.
This dataset contains information on revenues for the mobile telecommunication industry in 34 OECD countries, since 1997 to 2013. Also, it is possible to analyze the percentage of total revenue and the OECD average between the years mentioned.
Initially, since the original dataset presents the data in USD millions, I had to transform the revenues into unities (in USD), in order to have all variables with the same measure. After this it was necessary to convert the revenues in USD to revenues in USD PPP. This way the data can be more accurate and account for possible differences between the economies of the different countries. To do this,
first it was necessary to convert the revenues to their national currency and then convert to PPPs3.
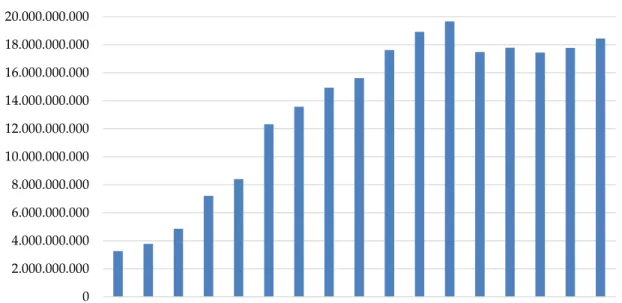
The highest mobile telecommunication revenue between 1997 and 2013, for the 34 OECD countries, was 226 003 USD PPP millions and represents the revenue in 2013 for the United States of America. The lowest was, approximately 21 USD PPP millions and represents the revenue in 1997 for Luxembourg.
Regarding our country, Portugal, the highest revenue was in 2013 and accounted for 4 215 USD PPP millions. Between 1997 and 2009 the industry grew every year (with the exception of 2004, where revenues decreased 2,94% regarding the previous year). Since 2010 until 2013, the mobile telecommunication’s revenue decreased, and in 2013 the most accentuated decrease within this period was registered: -6,98%.
In Graphic 1 is possible to see the OECD mobile telecommunication revenues average through the years. It is possible to note that until 2008 revenues were always increasing and, in the same year, the highest revenue average was also registered.
After 2008 the average mobile telecommunication revenue decreased by, approximately, 11,14%, reaching the value of 17 478,82 USD PPP millions. This decrease can be associated to the global economic crisis of 2009 that affected almost every industry and market, including the telecommunication industry. Nevertheless, despite the decrease in total revenues, the telecommunication industry has demonstrated some resilience and some of the firms headquartered in OECD countries increased their net income. This resistance can possibly be explained by “long contract durations, the emergence of bundled offers, and the fact that communication services are increasingly perceived as non-discretionary spending items” (OECD, 2011).
3 The conversion rates used (both exchange rates and PPPs) were the ones that are presented in OECD’s website,
for each year and country https://data.oecd.org/conversion/purchasing-power-parities-ppp.htm and https://data.oecd.org/conversion/exchange-rates.htm#indicator-chart
Graphic 1: OECD Mobile Telecommunication Revenues Average (in USD PPP)4 (OECD,
2015)
Contrary to what happened in Portugal, between 2012 and 2013, an increase of approximately 3,76% of the OECD Mobile Telecommunication revenue average (the OECD mobile telecommunication revenue average went from 17 775 027 189,39 USD PPP in 2012 to 18 442 755 545,25 USD PPP in 2013) was observed. This increase can be seen as a possible industry recovery.
2.3. Cellular Mobile Subscriptions
The cellular mobile subscriptions are presented from 1997 to 2013 for all 34 OECD countries and are measured in units.
This information was obtained from the OECD’s dataset “2.10 Cellular mobile subscriptions in the OECD area”5. In this document, it is possible to find the
number of subscriptions for cellular mobile, in thousands, for all 34 OECD countries, since 1993 to 2013. Additionally, it contains the compound annual
4 The values that support the chart can be found in Appendix.
5 http://www.oecd.org/sti/DEO-tables-2015.htm 0 2.000.000.000 4.000.000.000 6.000.000.000 8.000.000.000 10.000.000.000 12.000.000.000 14.000.000.000 16.000.000.000 18.000.000.000 20.000.000.000 1997 1998 1999 2000 2001 2002 2003 2004 2005 2006 2007 2008 2009 2010 2011 2012 2013
growth rate (CAGR) between 2011-2013 and 2003-2013, the OECD average, the number of subscriptions worldwide and the OECD percentage share of world total.
For the period analyzed the highest cellular mobile subscriptions is for USA in 2013, which amounts to 305 742 thousand. Actually, this country has the 11 highest values (between 2003 and 2013), clearly demonstrating that is the country with the most cellular mobile subscriptions. This could possibly be explained by the fact that the USA is one of the countries with the largest population (both around the world and among the OECD countries).
For Portugal, the highest value was in 2012, totalizing, approximately, 16 828 thousand, and the lowest value was registered in 1997 with only 1 507 thousand. The median between 1997 and 2013 for Portugal is 11 368 thousand. From 1997 to 2012, we observe significant growth in the number of subscriptions for cellular mobile and, between 2012 and 2013 our country registered a decrease of 1,04%. The most accentuated growth, in Portugal, was between 1997 and 1998, where the number of subscriptions went from 1 506 958 to 3 074 633 (an increase of approximately 104%).
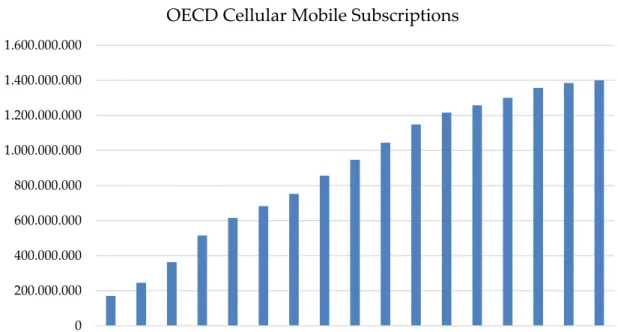
In Graphic 2 it is possible to analyze the total cellular mobile subscriptions for OECD countries, between 1997 and 2013.
In this period of time, as it is possible to see, every year the sum of all OECD cellular mobile subscriptions increased and, contrary to what happened in Portugal, the most accentuated growth was between 1998 and 1999, since the number of subscriptions went from 245 787 030 to 362 728 249, registering, approximately, a 48% increase. In 2000, the growth started to slow down, and between 2012 and 2013, the least accentuated growth was observed: 1,17%.
Graphic 2: OECD Cellular Mobile Subscriptions (in units)6 (OECD, 2015)
According to the OECD, mobile subscriptions per 100 inhabitants remained stable over the years, but in some countries, in the end of 2013, some declines were observed. Consequently, these decreases in the number of mobile subscribers can be associated to decreases in pre-paid subscribers and in reductions in termination rates (which reduce the need for each individual to have more than one mobile phone subscription). Also, we are facing a new trend of communication through the internet and there are diverse applications that allow us to connect with people around the world without the need to use a SIM card. All of these factors can contribute to the slowdown of mobile subscribers and even its overall decline.
2.4. Total Wireless Broadband Subscriptions by access
technology
6The values that support the chart can be found in Appendix
0 200.000.000 400.000.000 600.000.000 800.000.000 1.000.000.000 1.200.000.000 1.400.000.000 1.600.000.000 1997 1998 1999 2000 2001 2002 2003 2004 2005 2006 2007 2008 2009 2010 2011 2012 2013
The data for total wireless broadband subscriptions by access technology was collected from OECD’s dataset “2.19 Total wireless broadband subscriptions by access technology”. This document presents the number of subscriptions for the years between 2009 and June 2014 and it is divided into four categories: satellite, fixed wireless, standard mobile and dedicated mobile. For the purpose of my analysis, I only used the data between 2009 and 2013 and for two of the four categories: standard mobile and dedicated mobile. These two categories represent, every year, approximately 99% of the total wireless broadband subscriptions of all access technology.
I will next describe the analysis and the treatment that each category had, in order to work with the information in a concise and coherent way.
2.4.1. Total Wireless Broadband Subscriptions by Standard Mobile
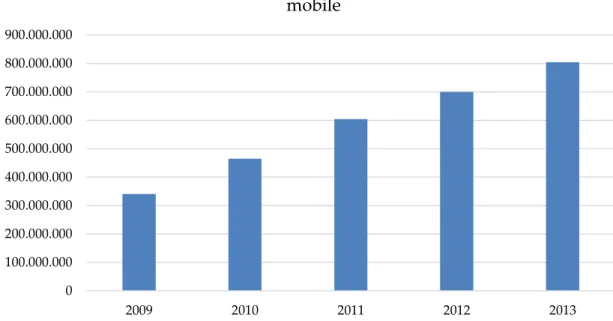
The total wireless broadband subscriptions by standard mobile are presented in units for all the 34 OECD countries, and like in the other documents, it is possible to analyze the OECD total for each year. In the following graphic, graphic 3, it is possible to examine those values.
It is possible to conclude that the tendency is the growth of wireless broadband subscriptions by standard mobile. In fact, from 2009 until 2013, the number of these subscriptions has been increasing at a rate always higher than 13%. The most accentuated growth was registered in 2010, where the total wireless broadband subscriptions by standard mobile grew 36,55% comparing to the previous year. In 2013, the least accentuated growth was registered, 14,86%, a value increase from approximately 700 million to 804 million.
Graphic 3: Total OECD wireless broadband subscriptions by standard mobile (in units)
(OECD, 2015)7
Regarding values by country, the highest value was registered in 2013 for the USA, approximately 314 million subscriptions (in fact, the USA represents the highest values for all years analyzed). The lowest value is represented by Iceland in 2009, approximately 77 thousand subscriptions. Curiously, this country also registered the lowest value in 2013, approximately 146 thousand subscriptions.
The analysis for Portugal is peculiar, since our country presents, until 2011, a growth rate of about 13% and in 2012 a 75% decline was observed, from 2 924 480 subscriptions to 738 873 subscriptions. Then, in 2013, the observed growth rate was 75,85% and the number of wireless broadband subscriptions by standard mobile reached 1 299 281.
2.4.2. Total Wireless Broadband Subscriptions by Dedicated Mobile
Data
7The values that support the chart can be found in Appendix.
0 100.000.000 200.000.000 300.000.000 400.000.000 500.000.000 600.000.000 700.000.000 800.000.000 900.000.000 2009 2010 2011 2012 2013
Total OECD wireless broadband subscriptions by standard mobile
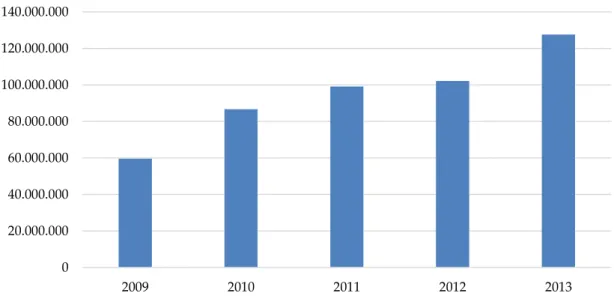
The total wireless broadband subscriptions by dedicated mobile data is presented in units for all the 34 OECD countries, and like in the other documents, it is possible to analyze the OECD total for each year. In the following graphic, graphic 4, is possible to examine those values.
Graphic 4: OECD Total wireless broadband subscriptions by dedicated mobile data (in units)
(OECD, 2015)8
As in the subscriptions of standard mobile, the OECD total wireless broadband subscriptions of dedicated mobile data increased every year and the most accentuated growth was also registered in 2010, 45,40% (the number of subscriptions went from, approximately 60 million in 2009 to 87 million in 2010). The least accentuated growth, contrary to what happened with standard mobile, was in 2012, which registered an increase of only 3%. In the meanwhile, in 2013 there was a recovery, and the growth rate raised up to 24,87% and the OECD total wireless broadband subscriptions of dedicated mobile data reached 127 577 188.
Regarding the values for countries, the lowest value was also for Iceland in the year of 2009, which amounted to almost 20 thousand subscriptions. This country
8The values that support the chart can be found in Appendix
0 20.000.000 40.000.000 60.000.000 80.000.000 100.000.000 120.000.000 140.000.000 2009 2010 2011 2012 2013
OECD total wireless broadband subscriptions by dedicated mobile data
also registered the lowest value in 2013 (around 42 thousand subscriptions). When it comes to the highest values, the prize goes to Korea in the year of 2009, 2010, 2011 and 2012 (it is important to notice that there are no values for the wireless broadband subscriptions by dedicated mobile data for the United States of America). In 2013, Japan reached the highest value, 24 million subscriptions (approximately).
For Portugal, there are values only for 2012 and 2013, and contrary to what happened with OECD total, a decrease of about 5% was observed, going from 2 735 102 to 2 598 316 subscriptions.
2.5. Mobile Basket Prices
The Mobile Basket prices were obtained from the “OECD Digital Economy Outlook 2015”9, containing prices for five mobile baskets, for 2012 and September
2014 for all 34 OECD countries (the values are presented in USD PPP).
For the purpose of my analysis it was only necessary data for 2013 (since this variable is analyzed in the second equation where the time period is the year of 2013). The Mobile basket prices information, as previously mentioned, contained data for September 2014 and since the 2013 prices were not available I assumed the mobile basket prices on September 2014 were the same as in 2013.
The five mobile baskets considered were the ones that the OECD considers in its analysis as “Handset use (data volumes + voice/SMS basket)”, where they use as a methodology for the calculation of prices a “basket approach”. They are defined as follows (OECD, 2015):
9
Basket 1: 30 calls + 100 MB Basket 2: 100 calls + 500 MB Basket 3: 300 calls + 1 GB Basket 4: 900 calls + 2 GB Basket 5: 100 calls + 2 GB
In their analysis, the OECD also considers two other types of baskets, laptop use (data volume) and tablet use (data volume), but in this approach, I only used the handset use and the other two were not considered. These data volumes include both upload and download, so it is not necessary to discriminate these two types of data volume (OECD, 2015).
These baskets are different in the sense that they represent different types of consumers and, consequently, their different types of usage. So, the OECD’s mobile basket prices correspond to the “least expensive offer per operator and per country for each usage profile” (OECD, 2015).
In terms of operators, the OECD adopted the approach of choosing the two biggest operators in each country. The dimension of these operators was measured through their market shares, that is, the two operators with the highest number of mobile broadband subscribers were chosen. Also, if such information was not available or reliable, the OECD decided the corresponding operators through the number of mobile subscribers (including voice, SMS and data). Additionally, if after choosing the two operators the sum of their market shares was lower than 70%, the third largest operator would be chosen (it is important to mention that no more than three operators were chosen) (OECD, 2015).
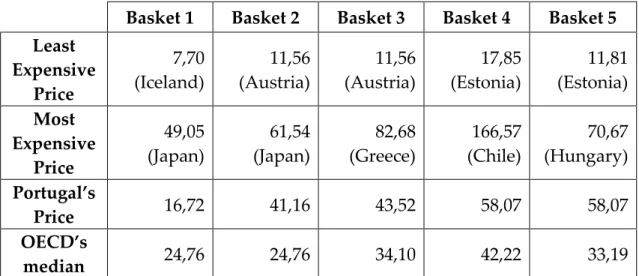
The first basket, 30 calls + 100 MB, is the basket with the least expensive prices, 7,70 USD PPP. This value corresponds to the price of this basket in Iceland and is the least expensive one for all 34 countries. The most expensive price is for Japan, with 49,05 USD PPP. Portugal can be seen, more or less, in the middle, with a price of 16,72 USD PPP, but it is above the OECD median (15,85 USD PPP).
In the second basket, 100 calls + 500 MB, the most expensive price also corresponds to Japan with 61,54 USD PPP and the least expensive price is 11,56 USD PPP for Austria. The median of this basket is 24,76 USD PPP and, again, Portugal is found above this value with a price of 41,16 USD (this price corresponds to the 6th more expensive price in OECD).
For the third basket, 300 calls + 1 GB, the median is 34,10 USD PPP and Portugal presents a price of 43,52 USD PPP (the 12th most expensive price in
OECD). Regarding the least expensive price, the value belongs to Austria with a price of 11,56 USD PPP and the most expensive one belongs to Greece with 82,68 USD PPP.
The fourth basket, 900 calls + 2 GB, presents the highest prices of all baskets, with a median of 42,22 USD PPP. The cheapest price amounts 17,85 USD PPP and it belongs to Estonia, while the most expensive price is 166,57 USD PPP and it belongs to Chile. Regarding our country, we are in the 10th position of the most
expensive price, with a price of 58,07 USD PPP.
Finally, in the fifth basket, 100 calls + 2 GB, the cheapest price also corresponds to Estonia and amounts 11,81 USD PPP. Portugal has the 8th most expensive price
when comparing to all 34 OECD countries, which corresponds to 58,07 USD PPP (also above the OECD median, 33,19 USD PPP). Regarding the most expensive price, the value is 70,67 USD PPP and it belongs to Hungary.
Basket 1 Basket 2 Basket 3 Basket 4 Basket 5 Least Expensive Price 7,70 (Iceland) 11,56 (Austria) 11,56 (Austria) 17,85 (Estonia) 11,81 (Estonia) Most Expensive Price 49,05 (Japan) 61,54 (Japan) 82,68 (Greece) 166,57 (Chile) 70,67 (Hungary) Portugal’s Price 16,72 41,16 43,52 58,07 58,07 OECD’s median 24,76 24,76 34,10 42,22 33,19
Table 1: Information about the mobile baskets' prices (values for 2014 in USD PPP) (Source:
OECD, 2015)
It is possible to conclude that Portugal is always above the OECD’s median and, with the exception of the first basket, has always one of the most expensive prices when compared with the other 34OECD countries.
For the purpose of this thesis it was used the logarithm of mobile basket prices and in the following table, table 2, I present the OECD average prices and the corresponding logarithm.
Basket Average OECD price Ln(Price)
30 calls + 100 MB 17,72 USD PPP ln(17,72)= 2,87
100 calls + 500 MB 28,07 USD PPP ln(28,07)= 3,33
300 calls + 1 GB 37,79 USD PPP ln(37,79)= 3,63
900 calls + 2 GB 51,22 USD PPP ln(51,22)= 3,94
100 calls + 2 GB 37,76 USD PPP ln(37,76)= 3,63
Table 2: Mobile Baskets OECD average price and the corresponding logarithm (Source:
OECD, 2015)
In the following subchapters, I explain the three variables (GDP per capita, number of 3G cellular mobile subscriptions and public telecommunication investment) that are present in the second equation and can influence Mobile Basket prices (these variables were treated as control variables).
I was used the logarithm of GDP per capita as a control variable for mobile basket prices.
The data for this variable was obtained in OECD’s website10, for the year of
2013. GDP per capita is presented in USD, constant prices, 2010 PPPs, and corresponds to “GDP per head of population”11.
2.5.2. 3G cellular mobile subscriptions
The control variable 3G cellular mobile subscriptions was obtained from the OECD’s website, namely from the “OECD Digital Outlook 2015”12. The
corresponding table is 2.13 “3G cellular mobile subscriptions in the OECD area”, with data from 2001 to 2013 for all 34 countries in units. It also contains the compound annual growth rate (CAGR) between 2011 and 2013.
For the purpose of this dissertation, I only used the information for 201313.
2.5.3. Public telecommunication investment
The data for the variable public telecommunication investment was obtained from table 2.31 “Public Telecommunication investment per capita”. The information is presented in units for all 34 OECD countries between 1997 and 2013. Also, it contains an average between 1988-90, 1991-93, 1994-96, 1997-99, 2011-13 and a monthly average for 2013.
For the purpose of this dissertation, I only used the information for 201314.
2.6. Market Structure
10 http://stats.oecd.org/index.aspx?DataSetCode=PDB_LV 11 The values for GDP per capita 2013 can be found in Appendix. 12 http://www.oecd.org/sti/DEO-tables-2015.htm
13 The values of 3G cellular mobile subscriptions of 2013 can be found in Appendix.
The market structure for this analysis was measured through the market shares of each of the 34 OECD countries and through the Herfindahl-Hirschman index (HHI). I used the information on table 4.10 “Market share of mobile network operators in the OECD, end 2013”15, containing the market share values
for each country and for each operator (the number of maximum operators for each country is five). I then computed the HHI, by summing the squares of the market shares:
𝐻𝐻𝐼𝑖 = ∑ 𝑠𝑖𝑗2 𝑁𝑖
𝑗=1
Essentially, I calculate the HHI for country 𝑖 by summing the square of the market share of each of the 𝑁𝑖 operators in country 𝑖. This index can go from
almost 0 points (or zero percent) until 10.000 points (or 100 percent) (this last value means that the industry only has one competing firm, i.e., it is a monopoly; and, conversely, if the result is zero it means that the industry is occupied with many competing firms). So, the HHI has an inverse relation with the number of firms in a certain market or industry: as the number of firms increases, the value of HHI decreases (US Department of Justice, 2017).
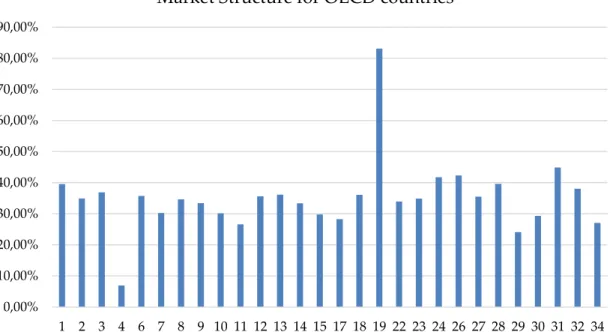
Regarding the 34 OECD countries the top three countries with the highest HHI are Korea (with 83,09%), Switzerland (44,89%) and Portugal (42,34%). Regarding the lowest HHI values, the top three are Canada (6,94%), Spain (24,09%) and Germany (26,59%).
In the graphic below it is possible to see the HHI for all 34 OECD countries in the end of 2013.
Graphic 5: Market Structure for OECD countries calculated through HHI (in percentage)
(Source: OECD, 2015)16
The median HHI for the OECD countries is 34,89%.
16 The missing countries (5, 16, 20, 21, 25 and 33) were not placed in the graphic because their values are missing.
The values that support this graphic can be found in Appendix.
0,00% 10,00% 20,00% 30,00% 40,00% 50,00% 60,00% 70,00% 80,00% 90,00% 1 2 3 4 6 7 8 9 10 11 12 13 14 15 17 18 19 22 23 24 26 27 28 29 30 31 32 34
Chapter 3
Empirical Framework
With the purpose of evaluating the impact of broadband in the mobile telecommunication industry, two different equations were developed. Firstly, equation 1 is presented, which relates mobile broadband subscriptions with mobile telecommunications revenues and adopts a panel data approach (corresponding to all 34 OECD countries between 2009 and 2013). Secondly, equation 2 is very similar to the first equation of Genakos et al. (2017), since it relates mobile baskets prices to market structure. The main difference in the specification of this second equation is that in my approach I used a cross section data (meaning the data is referring to the year of 2013 for all 34 OECD countries) and Genakos et al. (2017) used a panel data approach. Afterwards, some common problems with the models are addressed. This is explained by the fact that unlike Genakos et al. (2017) I only had mobile basket prices for a single year: 2013.
3.1. Equations
For my empirical analysis between mobile broadband subscriptions and mobile telecommunication revenues the following equation was developed:
(1) 𝑀𝑇𝑟𝑒𝑣𝑖𝑡 = 𝛼0+ 𝛼1𝑞𝑢𝑎𝑛𝑡𝐶𝑒𝑙𝑀𝑜𝑏𝑖𝑡+ 𝛼2𝑞𝑢𝑎𝑛𝑡𝑆𝑡𝑀𝑜𝑏𝑖𝑡+ 𝛼3𝑞𝑢𝑎𝑛𝑡𝐷𝑒𝑑𝑖𝑀𝑜𝑏𝐷𝑖𝑡+ 𝛼4𝑦𝑒𝑎𝑟 + 𝛼5𝑦𝑒𝑎𝑟 × 𝑞𝑢𝑎𝑛𝑡𝐶𝑒𝑙𝑀𝑜𝑏𝑖𝑡+ 𝜀𝑖𝑡
𝑀𝑇𝑟𝑒𝑣𝑖𝑡 is the dependent variable, which represents the Mobile Telecommunication Revenues for country i in year t (the data is presented in USD PPP). The main independent variables are 𝑞𝑢𝑎𝑛𝑡𝐶𝑒𝑙𝑀𝑜𝑏𝑖𝑡, 𝑞𝑢𝑎𝑛𝑡𝑆𝑡𝑀𝑜𝑏𝑖𝑡 and
𝑞𝑢𝑎𝑛𝑡𝐷𝑒𝑑𝑖𝑀𝑜𝑏𝐷𝑖𝑡,which represent the number of cellular mobile subscriptions
in country i in year t, the number of total wireless broadband subscriptions of standard mobile for country i in year t and the number of total wireless broadband subscriptions of dedicated mobile data for country i in year t, respectively. All variables are presented in units. 𝛼4𝑦𝑒𝑎𝑟 is also an independent
variable (although not for all regressions, as it will be further explained) and represents a dummy variable for the years used in this analysis. 𝛼5𝑦𝑒𝑎𝑟 ×
𝑞𝑢𝑎𝑛𝑡𝐶𝑒𝑙𝑀𝑜𝑏𝑖𝑡 is also an independent variable (and just like the previous
variable, it is not present in all regressions, as it will be further explained) and represents an interaction between a dummy variable (year) and a continuous variable (quantCelMob).Finally, 𝜀𝑖𝑡constitutes the error term.
For this equation, I conducted three different linear regressions: in the first regression, I estimated a simple regression with all the relevant independent variables (the variable years and the interaction variable were not used). In this manner, it was possible to study the effect of the three main variables without any effects and interactions. In the second regression, I introduced dummy variables for years, and since there were five different levels (number of years - 2009, 2010, 2011, 2012 and 2013), four dummy variables were created (for 2010, 2011, 2012 and 2013). Through this method it was possible to control temporal effects. A dummy variable (that can also be called indicator variable) only takes two values, 0 or 1, and it is normally used to assess qualitative explanatory variables. In this regression, for example, the dummy variable of 2010 takes the value 1 if the corresponding data is referring to 2010 and 0 if otherwise (the other dummy variables follow the same approach).
The third and last regression introduces an interaction between the dummy variable year and the number of cellular mobile subscriptions. These variables will express any connection and relation between years and the number of cellular mobile subscriptions. As mentioned in Data Description chapter, the number of this last variable in terms of OECD total increased over the years, but in many countries, a decrease was registered, mainly due to the emergence of new technologies and the increased importance of broadband. Consequently, a decrease over the years is expected for the coefficient of these variables.
As I mentioned before, this regression method is based on panel data, and since an analysis is conducted for different years, the possibility exists that country-specific trends could be accounted in the model (Genakos et al, 2017). Although I also tried to include such country-specific dummy variables in the equation, I ultimately decided not to present or include them in my analysis. In fact, my analysis only focuses on relating mobile revenues with the number of subscriptions of various mobile services, controlling for time effects.
For the analysis of the relationship between mobile broadband prices and market structure, the following equation was developed:
(2) 𝑙𝑛𝑀𝐵𝑝𝑟𝑖𝑐𝑒𝑖 = 𝛾0+ 𝛾1𝑀𝑘𝑆𝑡𝑟𝑖+ 𝛾2𝐶ℎ𝑎𝑟𝑖 + 𝜗𝑖
The dependent variable is 𝑙𝑛𝑀𝐵𝑝𝑟𝑖𝑐𝑒𝑖 and represents the logarithm of the
Mobile Basket Prices for country i in 2013 (the data is presented in USD PPP). The main independent variable is 𝑀𝑘𝑆𝑡𝑟𝑖, which represents the Market Structure of
country i in 2013 (this variable was measured differently for each of the different regressions that were developed, as explained below). 𝐶ℎ𝑎𝑟𝑖 represents various
control variables that may influence the mobile basket prices, vary across countries and include the following variables: the logarithm of the GDP per
capita for country i in 2013; the number of 3G cellular mobile subscriptions for each country i; and the Public telecommunication investment per capita in 2013 in country i. Finally, the last variable, 𝜗𝑖 represents the error term of country i in
2013.
For this equation, I conducted five different regressions, each one differing in the MkStr measuring method. Namely, in the first regression, market structure was measured through the number of operators each country had (varying from 1 to 5). In the second regression, for measuring market structure, I used two dummy variables: one for countries with four operators and another one for countries with five operators (Genakos et al., 2017, also use this approach). So, for this regression the comparison base was countries with one, two or three operators. For the third regression, as a measure of market structure I used the Herfindahl-Hirmschman Index (explained in the Data Description chapter). The forth regression included the highest market share of each country as a measure of market structure (often referred to as CR1) and, finally, the fifth regression
introduced the sum of the two highest market shares of each country as a measure of the market structure (often referred to as CR2). For all regressions, the
vector Char (which includes the control variables) was the same and included always the same variables.
Market structure can be defined in different ways so, in order to be able to account for these different measures I took the Genakos et al (2017) method of measuring market structure differently. The countries studied have different regulations, rules and trends for mobile telecommunication market and all of that can influence the number of competitors and, consequently, their market shares.
There are some problems that might occur with the models, especially with equation 2 and its main independent variable, market structure.
A classical regression model requires the satisfaction of five assumptions (known as classical assumptions):
1. The Linearity Assumption: which states that the relationship between the dependent variable and the independent variables is linear;
2. The Strict Exogeneity Assumption: which is related to the error term of the model and states that it needs to be uncorrelated with all the independent variables and have a zero mean for all observations;
3. No Multicollinearity: this assumption assumes that the independent variables are not highly correlated with each other;
4. Spherical Error Variance: which also related to the error term and states that the variance of the error term is similar across the independent variables, meaning it is homoskedastic;
5. Normality Assumption: which establishes that the distribution of the error term is jointly normal.
Given these assumptions, a common problem that might occur in the regression model is the fact that market structure can be influenced by other factors that are not accounted in regressions (like the emergence of new entrants in the market; the type of regulation in each country; demand particularities; among other factors).
These factors may be “caught up” by the error term (since the error term would be related to one of the independent variables) and there’s a failure in Assumption 2 – The Strict Exogeneity Assumption; the variable market structure is endogenous.
Chapter 4
Main Results and Discussion
In this chapter, the main results and their discussion will be introduced for both equations and for all the regressions. Firstly, the results and discussion of equation 1 are presented (the relationship between mobile broadband and mobile telecommunication revenue). Subsequently, the results and discussion of equation 2 are presented and discussed (the relationship between mobile baskets prices and market structure).
4.1. Equation 1
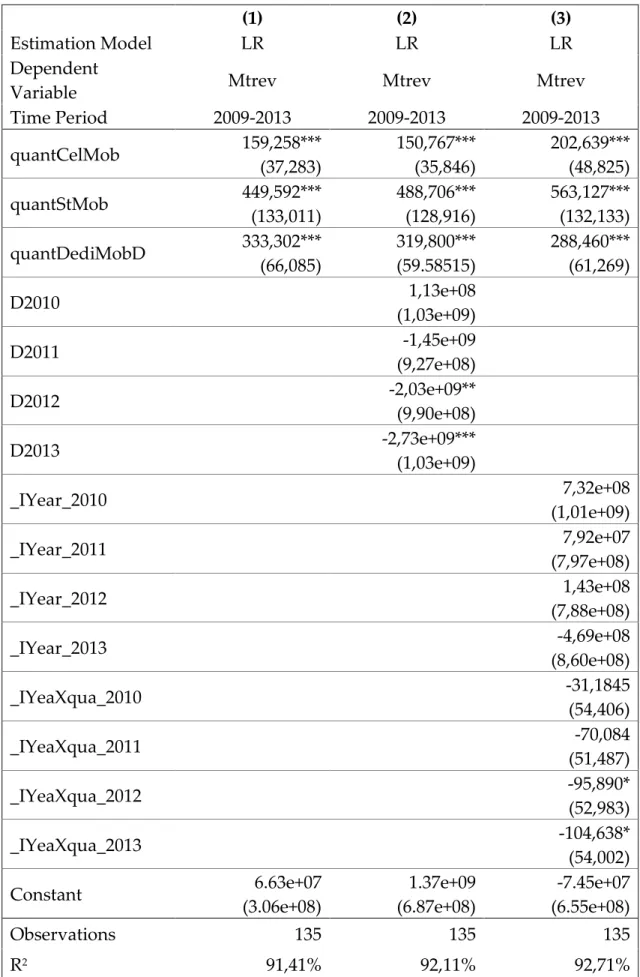
Table 3 presents the results of equation 1 for all the different regressions. The database that supports this equation encompasses information between 1997 and 2013, for all 34 OECD countries, but, due to the lack of data in some countries in given years, the time period analyzed was between 2009 and 2013. As explained before, mobile telecommunication revenues are in USD PPP and the remaining variables are in units.
Column one in Table 3 presents the regression results including only the three independent variables (cellular mobile subscriptions, total wireless broadband subscriptions of standard mobile and total wireless broadband subscriptions of dedicated mobile data) and mobile telecommunication revenues as a dependent variable. The obtained results indicate that for one additional subscription of
cellular mobile the mobile telecommunication revenue increases by 159,258 USD PPP, ceteris paribus; for one additional total wireless broadband subscription of standard mobile, the mobile telecommunication revenue increases by 449,592 USD PPP, ceteris paribus; and for one additional total wireless broadband subscription of dedicated mobile data, the mobile telecommunication revenue increases by 333,302 USD PPP, ceteris paribus. These marginal effects show how much more revenue, per year, an operator would receive from an additional service subscriber.
With these results, it is possible to conclude that total wireless broadband subscriptions of standard mobile are the category of service with the highest impact on mobile telecommunication revenue, followed by subscriptions of dedicated mobile data and cellular mobile subscriptions. Consequently, it is possible to recognize that mobile broadband is gaining some importance in the mobile telecommunication industry, since it generates a higher annual revenue for a mobile operator from each broadband client.
Column 2 in Table 3 introduces dummy variables for the years analyzed, with the objective of controlling temporal effects. With this introduction, all the independent variables decrease their impact on mobile telecommunication revenue, except total wireless broadband subscriptions of standard mobile, which presents a higher impact on mobile telecommunication revenues. Namely, in 2009, for one additional subscription of cellular mobile the mobile telecommunication revenue increases 150,767 USD PPP, ceteris paribus; for one additional total wireless broadband subscription of standard mobile, the mobile telecommunication revenue increases by 488,706 USD PPP, ceteris paribus; and for an additional subscription of dedicated mobile data the mobile telecommunication revenue increases by 319,800 USD PPP, ceteris paribus. As in the previous regression, the most important service is standard mobile, followed by dedicated mobile data and finally cellular mobile. With time fixed effects, it is
possible to understand that only 2012 and 2013 had significant alterations, in comparison to 2009. Namely, the country’s mobile revenue decreases in 2012 and 2013 (compared to 2009) by 2,03e+09 and 2,73e+09, respectively.
This decrease can be explained by various factors, such as cost changes, competition from other communication technologies (e.g., fixed access technologies), a decrease in the number of subscribers or even a substitution effect between services. This service substitution can be, for example, a substitution between voice calls for internet calls, which increases the use of wireless internet and mobile data. As these services became more popular, people realized that they did not have to pay for the exact minutes they stayed on the phone, meaning that they could spend hours talking with someone else using wireless internet or their mobile data. They had to pay the monthly fee of these services and could enjoy hours and hours of voice calls. This also changed the way people communicate abroad, since they realized that it was not necessary to pay roaming to use the internet and to talk on the phone. They could simply turn on wi-fi and use mobile applications to call someone else (the only disadvantage is the fact that it is necessary for both parties to have internet access and the same applications). These factors may have impacted the subscriptions of these services and consequently, mobile telecommunication revenues.
Column 3 of Table 3, instead of dummy variables for years, introduces an interaction between those dummy variables and the number of cellular mobile subscriptions. This interaction allows an analysis of the number of cellular mobile subscriptions through the years and a better understanding of its decrease. In this column, the time effect is not statistically significant and, so, the year effect in column 2 of Table 3 can be explained by the revenue reduction of voice call clients. The results of the independent variables indicate that in 2009 an additional subscriber of cellular mobile increased mobile telecommunication revenue by 202,639 USD PPP, ceteris paribus. When compared to this value, in
2010 and 2011 the interaction is not statistically significant, but in 2012 the significance level is 10% and for each country the mobile telecommunication revenue per an additional voice call client decreases 95,890 USD PPP. Consequently, in 2012, an additional subscriber of cellular mobile increases mobile telecommunication revenue by 106,749 USD PPP (202,639 – 95,890), ceteris
paribus. As for 2013, an additional subscriber of cellular mobile increases mobile
telecommunication revenue by 98,001 USD PPP (202,639 – 104,638), ceteris
paribus. This means that as the years went by, the impact of cellular mobile
subscribers in mobile telecommunication revenue is lower. This is consistent with the fact that people are using those internet applications for making calls without paying (such as WhatsApp, FaceTime, Viber, Skype, among others), using only wireless or mobile data. This result supports the growing importance of mobile broadband for operators’ revenues.
In respect to the other two variables, the results suggest that an additional subscriber of standard mobile increases mobile telecommunication revenue by 563,127 USD PPP, ceteris paribus, and that an additional subscriber of dedicated mobile data increases mobile telecommunication revenue by 288,460 USD PPP,
ceteris paribus.
All the regressions present a r-squared higher than 91%, which indicates that the independent variables explain more than 91% of the variance in mobile telecommunication revenue. In fact, the regression with the highest r-squared is column 3 in Table 3, followed by column 2 in Table 3 and then column 1 in Table 3. This suggests that the last regression (column 3, Table 3) is the one that best explains the model, when compared to the other regressions.
These results allow me to understand that mobile broadband has a positive impact in mobile telecommunication revenues and that the impact of cellular mobile subscriptions in mobile telecommunication revenue is decreasing over
time. This trend can lead to an emergence of new mobile services that are related to broadband, mobile data and wireless.
(1) (2) (3)
Estimation Model LR LR LR
Dependent
Variable Mtrev Mtrev Mtrev
Time Period 2009-2013 2009-2013 2009-2013 quantCelMob 159,258*** (37,283) 150,767*** (35,846) 202,639*** (48,825) quantStMob 449,592*** (133,011) 488,706*** (128,916) 563,127*** (132,133) quantDediMobD 333,302*** (66,085) 319,800*** (59.58515) 288,460*** (61,269) D2010 1,13e+08 (1,03e+09) D2011 -1,45e+09 (9,27e+08) D2012 -2,03e+09** (9,90e+08) D2013 -2,73e+09*** (1,03e+09) _IYear_2010 7,32e+08 (1,01e+09) _IYear_2011 7,92e+07 (7,97e+08) _IYear_2012 1,43e+08 (7,88e+08) _IYear_2013 -4,69e+08 (8,60e+08) _IYeaXqua_2010 -31,1845 (54,406) _IYeaXqua_2011 -70,084 (51,487) _IYeaXqua_2012 -95,890* (52,983) _IYeaXqua_2013 -104,638* (54,002) Constant 6.63e+07 (3.06e+08) 1.37e+09 (6.87e+08) -7.45e+07 (6.55e+08) Observations 135 135 135 R2 91,41% 92,11% 92,71%
Table 3: Results of Equation 1 (standard errors are presented in parenthesis bellow the
4.2. Equation 2
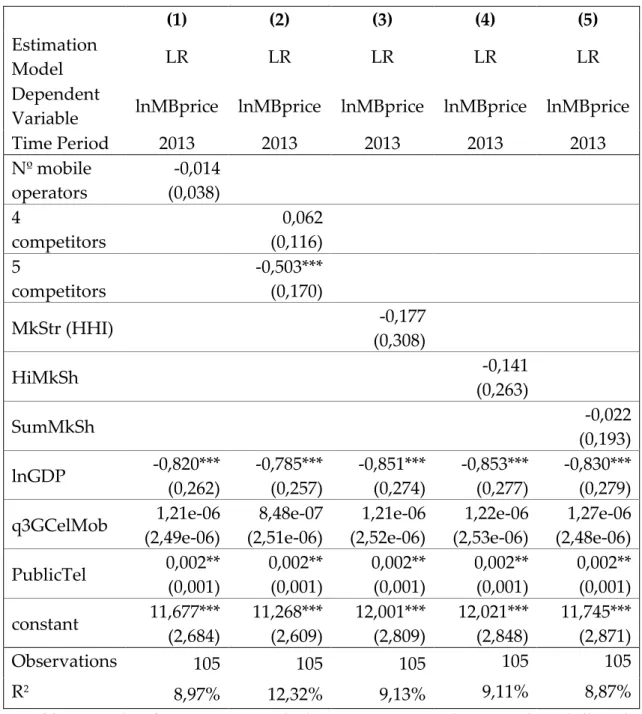
Table 4 presents the results of equation 2 for all different regressions. The database that supports this equation has information for 2013, for all 34 OECD countries. As explained before, the dependent variable is the logarithm of mobile baskets prices and the independent variables are market structure and the control variables: logarithm of GDP per capita, number of 3G cellular mobile subscriptions and public telecommunication investment per capita.
In column 1 of Table 4 the regression uses the number of mobile operators as a measure of market structure. The number of mobile operators varies from 1 to 5, but as it is possible to see in table 4, the variables are not significant, making it possible to say that this measure of market structure does not have any impact on mobile baskets prices. Looking at the control variables, it is possible to perceive that there is only one variable that is not statistically significant: 3G cellular mobile subscriptions. The other two variables are statistically significant and their results suggest that when GDP per capita increases by one percent, mobile baskets prices decrease by 0,820%, ceteris paribus and that when public telecommunication investment increases by one USD PPP mobile baskets prices increase by 0,2% (0,002*100), ceteris paribus.
Column 2 of Table 4 uses two dummy variables as a measure of market structure, namely, a dummy variable for countries that have 4 operators and a dummy variable for countries with 5 operators. So, this method suggests that the comparison group are countries with one, two or three operators. The results show that in markets with four competitors mobile baskets prices increase by 6,2%, compared with the comparison group, ceteris paribus, but this result is not statistically significant. In the meanwhile, in markets with five competitors, mobile baskets prices decrease by 50,3%, compared with the comparison group,
Like in the previous regression, regarding the control variables, only 3G cellular mobile subscriptions is not statistically significant. The other two are statistically significant and their results suggest that when GDP per capita increases by one percent, mobile baskets prices decrease by 0,785%, ceteris paribus and that when public telecommunication investment increases by one USD PPP mobile baskets prices increase by 0,2%, ceteris paribus.
Column 3 of Table 4 uses the Herfindahl-Hirschman Index as a measure of market structure. The results show that an increase of one percent in market structure corresponds to a decrease of 0,177% in mobile baskets prices, ceteris
paribus. But, in the meanwhile, these results were found as not statistically
significant. Similarly, 3G cellular mobile subscriptions is also a variable not statistically significant. The results also show that an increase of one percent in GDP per capita (with a significance level of 1%) corresponds to a decrease of 0,851% in mobile baskets prices, ceteris paribus and that an increase of one USD PPP (with a significance level of 5%) corresponds to an increase of 0,2% in mobile baskets prices, ceteris paribus.
In column 4 of Table 4 the measure of market structure is the highest market share of each country. Namely, this measure shows that an increase of one percent in the highest market share corresponds to a decrease of 0,141% in mobile baskets prices, ceteris paribus. Like in the previous regression, this result is not statistically significant and, also, 3G cellular mobile subscriptions is not statistically significant. Regarding the other two variables, an increase of one percent in GDP per capita corresponds to a decrease of 0,853% in mobile baskets prices, ceteris paribus and an increase of one USD PPP corresponds to an increase of 0,2% in mobile baskets prices, ceteris paribus.
The last column, column 5 of Table 4, uses the sum of the two highest market shares of each country as a measure of market structure. The results show that an increase of one percent in the sum of the two highest market share