International competitiveness of Portuguese
jewellery industry cluster
January 4th, 2018
In requirement to complete the Msc. in Management from Nova School of Business and Economics
Author: João Rosmaninho
Thesis Advisor:
2
Abstract:
This workproject analyzes the Portuguese jewelry cluster by assessing Portuguese firms’ competitiveness in relation to the European industry through data-based analysis followed by an in-depth inquiry of the competitiveness factors of the Portuguese cluster. The author concludes that Portuguese firms are not able to compete internationally, and that the factors that are more likely to explain this lack of competitiveness are related with firms’ strategy, structure and other industrial characteristics, giving some recommendations to improve these factors. Keywords: Intenational Competitiveness, Cluster, Porter, Jewellery
3
Abstract: ...2
Introduction ...4
Literature Review ...5
2.1. Salient issues in measuring international performance ...5
Cluster definition ...7
Cluster mapping and identification of clusters ...8
Cluster outcomes ...8
Antecedents and cluster’s development: some explanatory models ... 10
Literature Review Conclusion ... 11
Research Methodology ... 12
Methodology ... 12
Empirical Data and database ... 12
Is the Portuguese jewellery industry less competitive than the rest of the European jewellery industry? ... 13
Introduction ... 13
Measuring Competitive Performance ... 13
Measuring Competitive Potential ... 14
Measuring management process ... 15
Conclusion ... 16
Analysis of the Porto’s Jewellery cluster ... 16
Identification of clusters in Portugal ... 16
Porto jewellery cluster ... 17
Cluster analysis framework ... 18
Conclusion and Recommendations ... 25
Bibliography ... 27
List of figures and tables... 29
4
Introduction
Globalization has become more and more of a hallmark of our world, where, independently of size, companies work across borders to reach their clients. This thesis started as a discussion between how could small companies and small countries, such as Portugal, gain competitive advantages to fight in this global arena. To produce a more focused work I decided to focus on the Portuguese jewellery industry due to the sector concentration in the north region of Gondomar (Porto), and the prevalence of small local companies and well developed techniques such as filigree. Besides, the international setting of the industry is also interesting, today, the jewellery industry is still primarily local. According to Mckinsey, the ten biggest jewellery groups capture a mere 12 percent of the worldwide market. The industry’s expectation is that the movement to international markets will happen in the upcoming years. This movement might represent a huge threat to smaller companies which will be acquisition targets by larger companies, as industry consolidation intensifies, or be less able to reach the marketspace. To understand if the Portuguese jewellery industry can increase its competitiveness, the work project was broke into 2 smaller questions:
1) Is the Portuguese jewellery industry less competitive than the rest of the European jewellery industry?
2) Does the Portuguese jewellery industry have the necessary conditions to compete in the international stage?
To answer these questions, this work begins by tracing the literature on cluster identification and development as well as cluster performance and management, in chapter 3. On the fifth chapter an analysis is made comparing the Portuguese industry with the remaining European industry on several standard metrics of competiveness competitive performance, competitive to assess the current level of competitiveness of the Portuguese industry.
5 In chapter 6, a review of the current factors of competition of the Portuguese jewellery cluster is conducted by analysing interviews and survey data on companies located in Porto’s metropolitan area.
Finally, the work is concluded with major actions that can be adopted by the Portuguese jewellery clusters stakeholders in order to improve their performance, their ability to export and internationalize. Including the definition of the major skills and competency gaps in the Portuguese industry, and determination of the priorities of the improvements for strategic competition, such as the industry reorganization and shared competencies.
Literature Review
The topic of international competitiveness has been a reason of study for several years by the academic literature (Chabowski and Jeannette, 2017). As such, several models and theories have been proposed to measure and explain this topic. Being the focus of the thesis to provide an explanation to the source of competiveness in Portuguese jewellery, the approach chosen was to review more thoroughly Cluster theory and geographical co-location theories (such as satellite platform theory). Cluster theory approach was chosen, for being considered the best model for business and regional development, being the basis of EU analysis and policies. In this review, it will be discussed the theory’s different vectors: cluster formation, cluster benefits and sustainability factors for good long term cluster performance. Nonetheless, another model to measure and analyse international competitiveness will be presented to improve the discussion.
2.1. Salient issues in measuring international performancei
Competitiveness is a concept that is hard to define which has not reached yet consensus in academia, balancing from level of analysis, varying from productivity to cost perspectives (Ketels, 2016). One possible definition can be the ability to provide products and services as or
6 more effectively and efficiently than the relevant competitors (Enright et al, 1996). Competitiveness would then be the ability to sell products that meet demand requirements (price, quality, quantity) and, at the same time, ensure profits sustainability by having superior performance than other competing firms. Measuring such competitiveness in directly competing companies, is a difficult task since one has to balance the several sources of competitiveness, at firm level, regional and national resources, competencies and governance. Moreover, firms compete in a diversity of variables including price, quality and accessibility, which might render comparison between metrics unfit, and not representing an actual difference. An example is to compare a firm’s margins, in a luxury competitive country with an imitation jewellery competitive country. Such limitations act as constraints to the analysis, which often lead academia and international institutions to compare amongst potential factors of competitiveness, then actual performance, such as the World Economic Forum.
To minimize this limitations, several approaches have been proposed such as Buckley et al, 1985, which assesses 3 groups of metrics (see annex 9.2):
Competitive Performance: measures the outcome of firms’ resources and competencies. Competitive Potential: describes the inputs firms receive on which they are restricted
on their current and future performance.
Management Process: measures the ability of management to generate sustainability and capture existing market opportunities efficiently.
Nonetheless, Buckley et al. recognize that comparative international statistics at the company level are limited. Industries, especially in small countries, often lack mechanisms to collect the data needed for industry level strategic management and thus his approach should only be a guidance to understand international competitiveness.
7
Cluster definition
There are several definitions across the literature and depending on their origins they either focus on relationships and connections, such as DeBresson (1996) with “ (…) not just a simple concentration of independent economic agents but display at industry level, underlying networks of interrelated cooperating businesses”, the definitions proposed by network theory and social capital theory; or focus on the geographical proximity between businesses such as Enright’s definition (1996), “A regional cluster is an industrial cluster in which member firms are in close proximity to each other”, which lies with Marshall’s agglomeration theory. In “Clusters and the new economics of competition” (Porter, 1998ª, pp78) Porter defined a more mixed definition which has been the most consensual approach to date, and combines the location proximity and relationship focus. As such cluster is defined as “geographic concentrations of interconnected companies and institutions in a particular field. Clusters encompass an array of linked industries and other entities important to competition. They include, for example, suppliers of specialized inputs such as components, machinery, and services, and providers of specialized infrastructure. Clusters also often extend downstream to channels and customers and laterally to manufacturers of complementary products and to companies in industries related by skills, technologies, or common inputs”.
Other Cluster definitions have been proposed, which provides one of the main reasons for why it is difficult to identify clusters. However, they essentially refer to the tightening or loosening of the 3 base concepts that are pointed out in this definition by Porter (and also highlighted in bold), proximity (geographic or virtual), level of relationships (transactional or knowledge-based) and scope of approach (industry, sector or regional). The perspective adopted on this work project is porter’s cluster definition.
8
Cluster mapping and identification of clusters
As seen before, since a cluster is a concentration of economically related players, the necessary conditions to do any kind of systematic empirical work on clusters require finding which economic activities belong to the cluster, and the minimum critical mass of meaningful economic externalities which indicate the presence of a cluster (Ketels, 2003). Identifying such critical masses is a very complex exercise, so the majority of research on cluster mapping aims grouping the consequences of cluster effects, and if such effects are to large an extent, than it is assumed that a cluster exists to cause such effects (see more on annex 9.1.2).
Cluster outcomes
According to the literature there are two main ways to generate added value when joining a cluster. The first, through economies of network, obtained gains in transaction cost reduction, knowledge sharing and innovation derived from improved collaborative business, organizational and personal connections.. Such statement implies that clusters and cluster advantages can be formed without even existing cluster members’ geographic proximity. Furthermore the economies of network also generate better business formation with more resilience and lower cost of failure (Ketels, 2003). The other point of view states that clusters’ advantages are driven by economies of agglomeration, that is economic gain obtained through closer proximity between related firms, such as economies of scale, value chain integration, economies of scope, specialized assets, suppliers with shorter reaction times and reduction in other transaction costs.
3.4.1. Economics of network and relationships
To detail all the factors mentioned before, 3 theories perspective on economies of network will be explored: network and social capital theories, and triple helix model.
9 According to the network theory the key advantage obtained from cluster formation is information and knowledge sharing, which lowers transaction costs, (Granovetter, 1973). Those can be through 3 mechanisms by increasing transactive memory, improve the absorption capacity and accessibility of knowledge. The essential is that cluster proximity allows for more transactions to occur, which by being maintained and nurtured generate good quality relationships that generate positive spillovers.
Similarly, the social capital theory, focus on the increased gains for the company, derived from the increased social capital of the individuals, thus a higher social capital of the firm. According to Lin (1999), connected individuals have superior access to power, information and more solidarity, and if they are able to revert all these knowledge into the cluster, it generates overall economic gains.
Finally, the last theory (the triple helix) states that in order for cluster advantages to be created, there has to be a tight relationship between government agencies, research institutions and public and private firms (Leydesdorff and Etzkowitz, 1998). On this model, the public sector assumes a predominant role by acting as mediator, and both knowledge and performance gatekeeper, distributing innovation and acting as a mediator between firms, which increases innovation generation and thus added value.
3.4.2. Economies of agglomeration
On the other hand, the agglomeration theory, on which the majority of developments and public policy focus on, states that cluster firms’ geographical proximity promotes both economies of scale and scope. The primary reasons for the benefits of concentration are the reduced transaction costs, availability of specialized inputs and input suppliers and information spill-overs (Malmberg et al. 1996). Another reason explaining the phenomena is that concentration
10 promotes comparisons among competitors, which leads to an improved product differentiation (Johansson and Quigley, 2005).
Thus it is important to understand which factors drive cluster advantage (if any) on the case in study to determine which policies are more suitable to escalate cluster growth and performance.
Antecedents and cluster’s development: some explanatory models
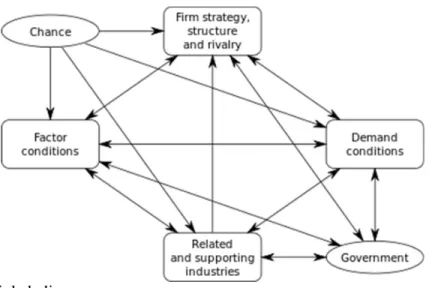
The formation and development of clusters is an area where several approaches have been developed successfully, with varying models across regions. This is justified by different development processes, history, degree of institutional intervention and people’s culture (Ketels, 2003). Thus, a model that fits in a certain region might not be appropriate for other. There are several theories and models, of cluster development, which either focus on the required endogenous conditions and factors for development, while other focus on the required relationships so that clusters competency is built over time as an outcome of interactive learning, resulting in an increased production and innovation. To further elaborate on these models, I will present, with more depth, Porter’s Diamond model, which focus on development of endogenous conditions, since it was going to be used to characterize the Portuguese jewellery cluster, due to its relevance as one of the most referenced models. Others models, such as triple Helix and System Dynamics can be found in annex 9.
3.5.1. Porter’s Diamond Model
Porter’s Diamond model states that a regional cluster will only be internationally competitive if there is a synergetic mix among 4 conditioning factors, which are often derived from national advantage determinants (see figure 12 in annex 10.1.2):
a) Firm strategy, structure and rivalry: Strong competition between locally-based rivals, which force business to find ways of increasing production, reach new markets and be more innovative.
11 b) Related and Supporting Industries: refers to lateral, upstream and downstream industries that facilitate innovation through exchanging ideas and improving supply chain infrastructure and conditions.
c) Demand Conditions: are the quality and quantity of the local customer base which acts as base demand but also as a source of product development and improvement against international customer needs.
d) Factor Conditions: elements such as local labour, availability of capital, natural resources or physical, administrative and technological infrastructures, which a country can create and that are the basis for business fixation and competiveness.
Besides these 2 conditioning factors there are 2 influencing factors: the luck/chance factor and Government factor. The first refers to the presence of an opportunity for cluster development, where supply conditions can be improved and/or the appropriate demand exists. An example might be given about the Italian jewellery cluster which was developed great part in the Italian renaissance period, supported by the cultural movement of the arts with a large patronage movement, but also a period where several merchants, acquired wealth from trading and from a need to show it. The last factor is the importance of the government role, which comprise all political and legal institution that have an impact in setting the cluster policies and initiatives, as well as regional incentives.
Literature Review Conclusion
In conclusion, cluster theory presents several models on which a cluster may be developed and such it is a good model for regional industrial development. Nonetheless, to be effective a cluster needs to develop characteristics or take advantage of existing factors to develop economies of network and economies of agglomeration. Therefore, a cluster requires geographical concentration, which provides economic transaction benefits and economies of scale, due to shared services and supplier and buyer concentration. A cluster also requires that
12 companies relate between themselves, both laterally and across the supply chain, this can be via economic transaction or knowledge transaction. Finally, clusters require specialization on particular field, which can be by product, service, process or people specialization. All these factors have demonstrated to create several benefits for the improvement of firms’ competitive advantage whilst also being a powerful tool for regional policy development. In spite of this factor understanding, the factors that condition cluster development as well as the circumstances are not yet explored in depth.
Research Methodology
Methodology
To investigate the questions proposed in this thesis, a combination of methodologies was used. For question 1, database analysis was used, complemented by the use of other sources such ITC and EUROSTAT. I classify the existent data, according to the criteria established in 3.2.. Then the analysis will follow a summarized version of the methodology proposed by Buckley et al., in 1985 to measure international competiveness with the choice of some representative indicators. The purpose is to compare Portuguese companies with the European ones with the same size (# of employees) and belonging to the same country size segment.
For the second question, 4 in–depth exploratory interviews were conducted, to industry association - AORP secretary general, an industry expert consultant and 2 businessman, As well as 39 surveys, which both survey results and sample characterization can be seen in annex chapters 9.4 and 9.5., respectively.
Empirical Data and database
The data was obtained from Amadeus, a Bureau Van Dijk database which contains financial information of European companies, on April 2018. The sample for the analysis includes
13 information of 6197 companies which were listed as active in 2016 and have declared their primary activity to be, under NACE code 3212, the production of jewellery and other ferrous metals and which data about their exports is available.
Is the Portuguese jewellery industry less competitive
than the rest of the European jewellery industry?
Introduction
To measure the competitiveness in the jewelry industry, the approach used was Buckley’s model, due to its relevance as discussed before. To do the analysis some variables were defined, according to importance of each variable to assess the 3 parameters of the model. Then each variable was analyzed in a cross tabular form subdividing the producers in clusters of total amount of revenue (see notes in the annex 10.2.1.).
Measuring Competitive Performance
5.2.1. Operating Revenue
One measure to describe the industry is its operating revenue, which is an indicator of volume. This is a good measure to comprehend the competitiveness of an industry since increased revenue reflects the companies’ ability to understand market demands. Analysing the data in table 1 (see annex 10.2.2) we can see that Portugal’s average revenue per company is very small in comparison with other producers and that the gap widens as the number of employees increase. Another highlight is that second tier producers have very consolidated industries with a small number of companies, enabling them to direct resources appropriately, and have an increased efficiency.
5.2.2. Profitability
Profitability, is a comprehensive measure that encompasses the results of efficiency, strategy and type of addressed markets (luxury vs. imitation). As such, a company with high levels of
14 profitability is expected to be competitive. As it can be seen, in table 2 (see annex 10.2.2) a large distinction between first tier producers and the rest, is the high levels of profitability across company sizes. The Portuguese industry is generally not competitive, especially at large company sizes, with -9% profitability where profitability rates are high. On the other hand, the Portuguese group medium-small firms (11-50 employees) has good profitability ratios in comparison with the industry.
Measuring Competitive Potential
5.3.1. Geographical concentration
To observe the top 10 European jewelry firms’ agglomeration, a ranking was made with the average of 3 subranking of 3 criteria, Turnover per NUT3 region, #employees per NUT3 region and # companies per NUT3 region. The resulting process yielded the top 10 regions in the European Union, as described in table 3 (see annex 10.2.2)
As observed, Portugal is high above in the ranking, especially represented by Área Metropolitana do Porto (#6). This is important for the competitive potential as it was seen before in the literature, a requirement for effective clusters and cluster benefits is geographical concentration. However, as we can see Porto is a region with small turnover concentration when comparing with other regions, being ranked as the 16th region. Another highlight from the analysis is that Italy, the top producer, holds 6 out of the 10 most geographically concentrated regions.
5.3.2. Assets per employee
This measure is a metric of productivity capacity. Companies with high levels of assets per employee are deemed more capital intensive and as such, are expected to be more efficient. This corresponds to a better capacity to compete in a sustainable fashion. As it can be observed in table 4 (see annex 10.2.2), small Portuguese firms (0-10) seem to be competitive with
15 international peers, however as firm size increases the gap widens. This may be a signal of lack of capital or inefficient technology, which may hinder the competitive potential, nonetheless other factor factors such as the segments where firms operate could be explaining the difference
Measuring management process
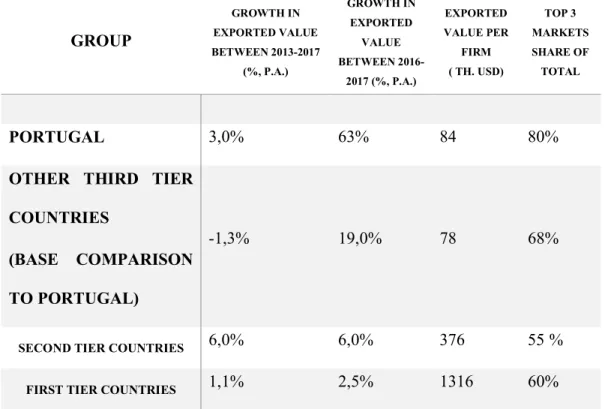
5.4.1. Export Orientation
A country’s propensity to export is a relevant measure to assess the country’s management capacity. The reason so is that a country’s export capacity depends highly on factors that management assures, such as export involvement (Diamantopoulos and Inglis, 1988), marketing/strategy (Dean et al., 2000), firms' resources (Rynning and Andersen, 1994), export experience (Hart et al., 1994; Williams, 2006), and business networking (Babakus, 2006). Thus, if Portuguese firms have a high level of exports consequently will have a higher likelihood of better management practices to be in effect. On the table 5 (see annex 10.2.2), it is shown 4 indicators of export orientation. Portuguese firms’ exported value per firm is small (84th USD) against other international competitors, however it is in line with other third tier countries. Nonetheless this indicator must be seen carefully since no other measure to isolate the effect of size is available. Analyzing other indicators such as the concentration of top 3 exporting markets share, we see there is a huge concentration of the exported markets, especially when comparing with other competitors. Facing these results and combined with an increasing growth of exports (on average above competitors), shows existing demand and capability to serve demand. Thus, a potential factor hindering internationalization might be the lack of management focus and vision, or even skill, ability and knowledge to internationalize. 5.4.2. Management training and employee training
Dedicated schools for craftsmanship, support of craftsmanship and relative strength of business school, are some of indicators which contribute for highly educated and productive workers
16 that can improve the managerial process. Another measure can be the participation rate in education and training (last 4 weeks), since it evaluates the effort of adult training. In table 6 (see annex 10.2.2) we can see that Portugal is in line with other third tier producers (6-7% range) but is behind target when facing larger producers which is around 10%.
Conclusion
Summing up the analysis, we see that Portuguese industry in general does not seem as competitive as the European industry, as seen in both operating revenues and profitability ratios showed. However, it shows good indicators when we measure competitive potential, where the analysis points that scale is an important issue for an increase in international competitiveness. Finally, on managerial process it is possible to perceive that there might be parity between Portuguese industry and their peers, however when comparing to higher tier producers we note that ineffective managerial process can be a source blocking international competitiveness. As such, it is important to uncover more thoroughly which factors are contributing to the lack of competitiveness.
Analysis of the Porto’s Jewellery cluster
Identification of clusters in Portugal
To identify Portuguese clusters, this thesis used the European Cluster mapping tool, which classifies industries according to their relevance on a 0-4 scale. Their focus is on measuring the relative importance of an industry, both at regional and European levels, in terms of employment. As seen in figure 10, in the annex, the North Region is home to the Portuguese industry. To further narrow the area to the NUT 3 level, we will focus on the area of Porto’s Metropolitan Area, since, as we have seen before, is the most highly concentrated area in Portugal of the jewellery industry.
17
Porto jewellery cluster
6.2.1. Cluster Development at the light of Porter theory
Portuguese jewellery cluster fits with Porter’s Diamond theory and also with the system Dynamics approach to cluster formation. Throughout its history (see annex 10.6.2), we can see a great influence of 5 out of 6 factors of Porter’s Diamond, namely in Factor conditions with the quality and amount of the workforce, availability of supplies and the port infrastructure, in Related and supporting industries with the commerce and shipping industries, in Firm Rivalry with the competition among small workshops in special quarters such as the one close to São Bento and also the society agreements that led to these changes. Also the 2 influencing factors played a role: chance, since Portugal took advantage of the Discoveries’ enterprises to position itself as a leading player in the European market, and also the Government factor, due to the laws passed by the city hall of the major cities which helped to guarantee a stable and thriving environment for the industry. All those were responsible for building enduring economies of agglomeration while also leveraging, the economies of network between players. With the passage of time, as effect of the endogenic conditions decreased in comparison with international firms, also the decline of cluster strength.
6.2.2. Characterization of cluster Firms
From the interviews conducted it was possible to identify for 4 types of firms: specialized firms, designers firms, integrated player and retail players. The players work across different parts of the value chain, with the exception of the integrated players which work all across, as seen in the annex 10.6.4. In result of the different characteristics, players make different usages of the cluster, as the industry expert pointed out, with the prevalence of economies of agglomeration due to the economies of scale, value chain integration, economies of scope and specialized assets. Economies of network are mostly felt at the designer firms, which are led by younger people and have recent business and such take support on the network to improve their
18 processes and products. Nonetheless the potential for further economies of network still exist as people with the industries know each, even though they don’t commonly use these relations for business development.
6.2.3. 5.2.3. Governing actors - Industry association - AORP
AORP (Associação de Ourivesaria e Relojoaria de Portugal), is a non-profit Employer association, located in Porto, with the aim to develop and lobby for the jewellery sector. The association has been pivotal in commanding a strategy for internationalization, product development and sector qualification. According to the organization, such initiatives were essential for the development of technical skills in the jewellery companies but also to the collective sentiment of collaboration between companies. In that sense, further strategies are being developed to improve firm management skills, promote digital marketing skills and promote young artists (namely with the Jewellery Newborn initiative).
6.2.4. Qualification Stakeholders
CINDOR - Professional Training Center for the Jewelery and Clockmaking Industry was created in 1984 with the help of AORP to respond to the needs training in the jewellery and watchmaking sector. It has also the mission to support the adoption of technologies
Cluster analysis framework
To evaluate why the cluster is performing below other international jewellery we will analyse in depth the factors identified in the Porter’s Diamond model, breaking down when necessary in order to identify which ones are creating a positive impact in cluster development and that ultimately will be responsible for creating the cluster benefits and increased international competitiveness. To help understand the analysis, the level of competitive advantage will be highlighted in bold.
19 6.3.4. Factor conditions
1) Local labour (medium): There are 4 types of employees necessary to develop a successful and innovative jewellery company: the technicians/artisans, the designers, the profession management, and researchers. In the metropolitan region of Porto there is an abundance of technicians/artisans which are specialized personnel and have long been taught by previous generations. They are one of the key sources of cluster advantage since the knowledge of the craft is not typically shared and is hard to replicate, besides taking several years to master the handcrafted pieces produced. Moreover, the existence of schools of crafts allows for the preservation of jewellery’s crafts, and ensures a continuous supply of employees. Besides technicians/artisans, jewellery designers are also required, a function previously conducted by artisans. Unlike artisans this personnel is more dedicated to study the market and develop jewellery brand collections, making them essential for industry growth. As stated by AORP secretary general, the offer of these personnel it is still scarce. The reasons so are the lack of training offer that is provided essentially by ESAD, and people’s awareness to the profession which is still small. On the contrary, Professional management staff is available in Porto’s metropolitan region, derived from the several business schools in the area, such as Porto Business School. However, due to industry structure where the majority of companies are small and family owned, they are not yet employed extensively by the industry. Lastly, the availability of researchers in Porto’s region is wide, although due to industry structure, they are not employed by the industry, as they would require research budgets that low scale companies do not have. This setting has also made impossible for researchers to specialize in the industry and improve current industrial tools and materials. Nonetheless, it’s possible to observe from the survey results (annex-table 9) that firms consider that exists sufficient pool of workers from them to recruit from, both for management related activities and productive activities.
20 2) Availability of financial capital (low): Two factors are essential regarding capital: the existence of capital and the type of capital that exists (Engels, 2015). Regarding availability, we see that in spite of Porto being the North’s Region financial capital, different sources of financing are still scarce, such as private investment (venture capitalist, private equity firms and business angels) which means that the majority of firms can only find financing among industry pairs, personal contacts or financial institutions (table 9 –survey). On the first two cases, the capital available to invest is usually small whilst on third one we face the risk aversion of banks, and thus the high lending rates and small capital made available. These factors are only mitigated by the availability of public funding through Portugal 2020 programs and the appreciation of the gold reserves in the financial markets that traditional family owners have and act as the source of capital. Regarding capital, the need for a mature industry of private investors is essential to capitalize the firms, so they can begin the development, since companies in the industry have currently high Book D/E ratio (avg.: 104%, median: 63%) against for example the US industry where ratios are 21% (Damodoran, 2018).
3) Natural resources (low): The Portuguese industry supplies itself on international markets, since precious metals are commodities. Furthermore, since they act as reserves for the world’s monetary systems they can be sourced not only from extracting countries but also from any holding country, thus usually no major advantage ican be derived from this factor.
4) Physical infrastructure (low): The metropolitan region of Porto is supplied by the Porto’s airport and Leixões port, which are structural infrastructures at national level. Despite this advantage, the specificities of the product, such as value (usually few quantities shipped) and small volume, make it easy to transport and thus the benefit of having such infrastructure give a small source of advantage, and rather just act as business facilitator.
21 6) Technological infrastructure (low): Although Norte’s region has important research centres nearby, in Aveiro, Braga and Porto, with several scientific fields there isn’t any infrastructure dedicated to the jewellery industry. In opposition, other clusters have dedicated specialized technological infrastructures such as GIA research centre in Antwerp, Belgium (US based company), AGS laboratories in USA or IGI research centre in Italy. The institutions are responsible for developing new processes and techniques, but also for developing new products namely new synthetic materials (especially in gems) which can be used for a diversified offer. 7.3.2. Demand Conditions
7) Demand Conditions (low): As Porter states the home market demand is essential to understand market needs and improve the product development. To do so, it is essential that home market is very interested in the product supplied. This is seen in 2 ways, cultural traditions and jewellery consumption. In terms of gold tradition there are several festivals such as Nossa Senhora da Agonia, in Viana do Castelo that express the love for gold. This expresses the enjoyment of jewellery, however it’s not helpful for the industry to set future trends and improve jewellery consumption, as they differ from typical offer. Furthermore, a major disadvantage for the Portuguese industry is that Italian consumes 5 times more jewelleries and Belgium consumes 3 times more jewelleries than Portuguese consumers (Euromonitor, 2018). 7.3.3. Firm Strategy, Structure and Rivalry
8) Individual firms’ competitive advantage and strategy (medium): Resulting from extensive tradition, Portuguese firms possess specialized competencies in handcrafting at the best value for money. Moreover, the international setting conditions, namely industrialization, increased these factors, since large traditional players have invested in industrial production, artisanship’s traditions have been decreasing. Since new players do not yet possess skills in handcrafting, they turned it into a valuable and scarce competency. This shift is an important part for the
22 revival of the industry, since it sets the potential market positioning for Portuguese companies to operate on. However, other factors are still necessary to create effective strategy, namely, capabilities in brand creation, product development and internationalization, which are very little and a key bottleneck for the industry to grow beyond the small domestic market. This lack of expertise and vision, often generated misaligned strategies, and led to firms operating below expected results. Furthermore, there is a lack of coopetition (table 9 - Q9-Q12), on several areas which would have allowed companies with small scale, to leverage each other’s capabilities and resources to improve their competitiveness ability.
9) Industry Rivalry: (low): According to the literature, strong competition among locally-based rivals is essential for an innovative environment. However, in the current setting of the industry, rivalry among competitors is still small. The most prominent examples might be Flamingo and Fernando Rocha Joalheiros, two large companies with the same market positioning but don’t compete against each other to conquer new markets. One reason to explain this idleness of the industry, is national market protection but also companies’ vision, goals and familiar roots that don’t aim at acquiring more market share. Other sources for this lack of rivalry can be industry stagnation, which did not stimulate the presence of innovators and new companies creation. The presence of new designers entering the industry however might increase the aggressiveness of some companies and start a sustained process of rivalry-led innovation.
7.3.4. Related and Supporting Industries
10) Related and Supporting Industries (medium): Associated with the jewellery industry are usually fashion related industries, such as apparel and clothing, as for example in Tuscany Fashion cluster. These are essential to develop a combined approach to the market but also as trend setting industry. These 2 industries are extremely developed in the northern region of Portugal, nonetheless they still haven’t been fully explored (Table 9 - Q3). Other industries
23 could also be explored such as the furniture industry. The problem though is regarding supporting industries, namely on retail side, jewellery stores. And the reason to do so is the fragmentation of the industry, both nationally and internationally, such conditions make it ideal to develop own brand stores, as international players have been doing so, such as Cartier’s or Swarovski. However, when there is a lack of competency in that field it, such as the case, it becomes a hurdle for cluster development.
12) Academia Relationships (low); The small amount of academia relationships is a result of a lack of specialized technical infrastructure, low scientific qualification levels among the industry, where tradition has been the source of knowledge, but also as result of lack of concern and investment in R&D activities (table 9 - Q4). Furthermore they are the result of an inexistent/small platform that bridges scientific knowledge research to company knowledge, the only door being the CINDOR.
7.3.4. Government
5) Administrative/legislative setting (medium): We can divide this factor in general environment conditions and specific industry settings. In general administrative environment, Portugal fairs well with the 34th position in the 2019 Doing Business Ranking however not at good enough level to provide a competitive advantage against other advanced economies, with several factors such as ease of paying taxes or creating a company contributing to this result. On the other side, the action of the government conditions, the sector two-folded, the first by action of the INCM “contrastaria” the official institution that certifies all product made in precious metals, it forces all products above certain weight to be certified in order to be sold in Portugal, creating a higher end cost for the final product and also an increased time to deliver the product to the market. The process is meant to assure the precious metal pureness, and provide consumers the guarantees of authenticity, however with a lack of recognition by
24 consumers and high costs of certification this law increased the parallel economy. Secondly, until recently all products made with precious stones could only be sold in specialized jewellery stores, this created an intrinsic protectionism to the system that generated idleness in the industry and not allowing the development of multichannel marketing or digital business models.
11) Government Relationships (medium): This factor refers to the ability of the government to set policies that lead to improved cluster organization and competitiveness. In Portugal such role is usually delegated to industrial associations, an example of such is APICAPPS but also AORP. AORP has been through the process of renovation, with shifts to its core, and although it has started to solve severe industrial problems such as the excess of stock in stores, and creating an internationalization program (table 9 - Q13), it has still not created a cohesive policy for the entire industry to act upon. This in turn is still contributing for the disorganization of the cluster (table 9 - Q13), with low levels of collaboration (table 9 - Q9-Q12) and low levels of promotion of the sector especially at the national level (table 9 - Q13).
6.3.5. Opportunity:
As explained before, the current competiveness of Portuguese firms is being driven by large industrial shifts. Moreover, they are being derived from market conditions, since B2B buyers are increasingly demanding smaller volumes of batches for more focused and exclusive collections, hand production has become cheaper than developing a mould for a small batch, so they turned it more cost effective than industrial production. Also, the current shift in production of precious metals to China, India and Turkey through offshore production has reduced the quality of final product offered, and thus turned well-crafted pieces more valuable. Another factor is that previous players that have outsourced the production to Asian countries have lost handcrafting knowledge, rendering them unable to compete with the Portuguese industry. But they left industry with excess production capacity, which entrapped them as they are not now
25 able to compete with large batch Chinese and Indian produced jewellery but also aren’t able to compete in small handcrafted batch delivery. Thus these players can only resort to the brand they hold.
Conclusion and Recommendations
In conclusion, it is verified that the Portuguese cluster is in fact a very concentrated cluster when compared with other European counterparts, especially, in terms of business and people. However, when we analyse the performance of the cluster against international competitors in all of the 3 vectors analysed, we saw that the Portuguese jewellery cluster had severe shortcomings, rendering the Portuguese industry less competitive than international peers. Furthermore, we also determine that size was essential to improve performance and the fact that Portuguese companies lacked scale could be a major explanatory factor. Further analysis on competitiveness factors showed that 8 out of the 13 factors contribute to low levels of international competitiveness. This fact also exposes a large space for improvement and industry growth, especially, due to current market settings. The only determinant is the choice of the right factors to be improved and generate more competitiveness.
In order to conduct a strategy to improve clusters factors, this thesis proposes an analysis on factor improvement opportunities derived from a discussion between AORP Secretary General and an industry specialist on the potential costs and impacts in the industry:
The analysis points out that improvements, in qualification (qualified labour availability), industry strategy, structure and organization are the most effective to harness the current competitive opportunity. As such, 4 axis were identified to be the focus of a comprehensive strategy to improve international competitiveness:
Another consideration to be taken into account for strategy execution is the enforcer. As pointed out by the secretary general, the cluster is characterized by micro-firms and large companies
26 don’t have enough strength to shape the industry characteristics. To deal with such environment it is necessary that AORP takes the lead in promoting these measures to improve the cluster organization and thus setting an effective cluster development policy. Other clusters such as the Glashutte Watch cluster (Kery, Brown et al) or by the Asturian TIC cluster have been governed under a defined policy by business associations, with good outcomes. Although general government enforcement (municipalities or government team) are more common in handling cluster polices, like in Dubai, Czech Republic or Poland, this model allows for quicker reaction times and more directed measures, while often lacking resources to implement more structural business environment policies.
The first objective is to design multiple programs, to improve companies’ strategies via business transformation (promoting specialization on specific processes of the industry, and focus in trades in reach of companies’ resources and competencies), improvement of capabilities through qualification (namely brand development, process creation, sales and product development) and faster growth with internationalization roadshows. Also, an improvement in industry structure by promoting consolidation of inneffective businesses and the intermediation in the capitalization of businesses. Furthermore, since this strategy assumes that AORP has limited resources, while having multiple measures to implement, an action framework is proposed. It aims to classify companies according to their performance, setting them on 3 levels in relation to a predefined industry standard, which in the end, defines the target companies to implement the different programs. Additionally, this framework has the upside of promoting industry rivalry by bolstering bragging rights, while at the same time developing a new vision and objectives for the industry through prearranged milestones, as well as boosting inclusiveness and cooperation among stakeholders, setting the stage for further developments.
27
Bibliography
Journal Articles
Buckley, P., Pass, C., Prescott, K. 1988. ”Measures of international competitiveness: A critical survey.” Journal of Marketing Management, volume (4).
Chabowski, Brian .,A. Mena, Jeannette. 2017. “A Review of Global Competitiveness Research: Past Advances and Future Directions." Journal of International Marketing, volume (25). 10.1509/jim.16.0053.
DeBresson, C., Why innovative activities cluster. In C. DeBresson (Ed.), Economic Interdependence and Innovative Activity: An Input-Output Analysis. Cheltenham: Edward Elgar, 1996.
Glaeser, Edward L., Kerr, William R. October 2008. “Local Industrial Conditions and Entrepreneurship: How Much of the Spatial Distribution Can We Explain?”, NBER Working Paper No. 14407.
Glaeser, Edward L., Kerr, William R., Ponzetto, Giacomo A.M. January 2010. “Clusters of Entrepreneurship” Journal of Urban Economics.
Granovetter, Mark. 1973. “The Strength of Weak Ties.” American Journal of Sociology, Vol. 78, Issue 6, p. 1360-13.
Johansson, B., Quigley, J. 2005. “Agglomeration and networks in spatial economics.” Papers in Regional Science.
Ketels, C. 2003. “The Development of the Cluster Concept—Present Experiences and further Developments.” Paper prepared for the NRW Conference on Clusters.
Kyvik, O., Saris, W., Bonet, E., Félicio, J. A. June 2013. “The internationalization of small firms: The relationship between the global mindset and firms’ internationalization behaviour” Journal of International Entrepreneurship.
Porter M. 1998 Nov-Dec. “Clusters and the new economics of competition.” Harvard Business Review 76(6):77-90.
Leydesdorff, Loet., Etzkowitz, Henry. 1 June 1998. “The Triple Helix as a model for innovation studies” Science and Public Policy, Volume 25, Issue 3, Pages 195–203.
28 Lin, N. 1999. “Building a Network Theory of Social Capital.” Connections, 22, 28-51.
Ketels, Christian. March 2016. “Competitiveness Frameworks Review” Analysis Conducted for the National Competitiveness Council of Ireland.
Lin, C., Huang C., and Tung, C. April 2006. “Elucidating the industrial cluster effect from a system dynamics perspective”, Technovation, Elsevier.
Malmberg, M., Sölvell, Ö., and Zander, I., Spatial Clustering. 1996. “Local Accumulation of Knowledge and Firm Competitiveness.” Geografiska Annaler. Series B, Human Geography Vol. 78, No. 2.
Porter, M. 2003. The Economic Performance of Regions. Regional Studies, 37(6&7): 549-478. Su, L., Adams, J. 2010. "Export capacity impact factors on Chinese SMEs: A survey analysis of Fujian Province." Journal of Chinese Economic and Foreign Trade Studies.
Book chapters:
Enright, M. Frances, A., and Scott-Saavedra, E. 1996. "The Challenge of Competitiveness in the Modern World Economy", Chapter 3, St. Martin’s Press.
Other resources:
Dauriz, L., Remy, N. and Tochtermann, T. “A multifaceted future: The jewelry industry in 2020”, McKinsey and Co., February, 2014
Sousa, Gonçalo V., Lopes, Carlos R. S., Estudos de história da ourivesaria, Gab. de Estudos de Artes Decorativas da Univ. Católica Portuguesa, Porto, 2005
Data:
Amadeus Database, Bureau Van Dijk, 2016 - 2017, International financial ratios EUROSTAT, 2016, Export Orientation and Education activities
29
List of figures and tables
Figure 1 - Bucley's 3P's Model. ... Error! Bookmark not defined. Figure 2 - Porter Reviewed Diamond TheoryFigure 1 - Bucley's 3P's Model. ... Error! Bookmark not defined.
Figure 2 - Porter Reviewed Diamond Theory ... Error! Bookmark not defined. Figure 2 - Porter Reviewed Diamond Theory ... Error! Bookmark not defined. Figure 3 - Triple Helix Model. ... Error! Bookmark not defined. Figure 4 - System Dynamics Model. ... Error! Bookmark not defined. Figure 5 - Competitive Factor Analysis. ... Error! Bookmark not defined. Figure 6 - AORP Action Framework. ... Error! Bookmark not defined.
Figure 7 - System Dynamics Industrial Cluster Effect. ...35
Figure 8 - Regions of Europe: Level of Clustering and Prosperity. ...34
Figure 9 - Jewellery clusters accros Europe. ...42
Figure 10 - Cluster Analysis Framework Overview. ...46
Figure 11 – Distribution of respondent companies based on employee size ...41
Figure 12 -Distribution of Companies based on turnover (in Euros) ...41
Figure 13 - Distribution of companies based on export revenue over turnover ...42
Figure 14 - Distribution of Companies based on brand distribution ...42
Table 1 - Operating Revenue Comparison (th. Euros) .... Error! Bookmark not defined. Table 2 - Profitability Comparison ... Error! Bookmark not defined. Table 3 - Geographical Concentration comparison ... Error! Bookmark not defined. Table 4 - Assets per employee comparison ... Error! Bookmark not defined. Table 5 - Export Orientation comparison ... Error! Bookmark not defined. Table 6 - Management and employee training comparisonError! Bookmark not defined. Table 7 - Specific Axis Programs ... Error! Bookmark not defined. Table 8 - Country tiers Classification ...36
30
Annex
10.1. Chapter 3 – Literature Review
10.1.1. Salient issues in managing international competitiveness
10.1.2. Cluster Identification and Mapping
With such goal in mind, 3 approaches will be presented, which are the most explored: geographic concentration mapping or co-location based techniques, relationship mapping (or input-output) techniques and knowledge creation mapping. The first set encompasses techniques such as Gini´s Spatial coefficient, location coefficient, Spatial Correlation index, the Carrol’s model, Ellison and Glaeser – natural advantages model or the M function. They analyse a certain concentration of a sector by measuring the levels of wealth, the total employment and the employment of certain sector in comparison with the general sector, or between spatial distances. The second set of approaches focuses on mapping relationships. An example of said techniques are Markusen’s visual technique or Porter’s Model and Feser and Bergman’s model approaches, that take into consideration input-output tables to identify relationships among sectors and then factor in spatial concentration indicators to identify clusters. Lastly, knowledge mapping approaches take into consideration the increasing knowledge production and research
31 activities from cluster existence. An example is the patent approach (Jaffe et al, 1993). In spite of the different techniques briefly presented, only two major and broad initiatives have been conducted, the US cluster mapping, supported by the Institute for Strategy and competitiveness of Harvard Business School, and the EU Cluster mapping by the EU cluster observatory (supported by VDI/VDE/IT). The first methodology uses the techniques exposed in the paper Defining clusters of related industries (Delgado, Porter and Stern 2016), an extension of the model proposed in the Economics of Regions (Porter 2003), which is a combination of spatial and relationship approaches. The second approach is inspired on the American model, although, due to the lack of data, it was simplified being a combination of Specialisation and size measures, Performance measures (wages, productivity indicators, new business formation), Regional context (General competitiveness landscape via Regional Competitiveness Scoreboard and the presence of related clusters), as well as collaboration factors (presence and strength of cluster initiatives and regional social capital).
10.1.3 Porter Diamond Model
10.1.4. Triple helix
The triple helix model asserts that clusters are built as a result of the collaboration effort between 3 entities: the government, the academia and the industry. As such, the model core is
32 that public-private partnership and relations enable an increase in regional knowledge and better innovative processes, which would not be possible by individual firms as they have limited knowledge or market knowledge and specially for smaller firms that lack capital to pursue R&D activities.
On this model, a large emphasis is given to the public sector as its role in supporting private enterprises. From the part of academia, the models set that it should be concerned in disseminating new knowledge and research, but also provide courses for training of workers within the cluster. The government which encompasses the country level government to the
association responsible to manage the cluster, is responsible to set fiscal incentives, improve factor conditions such as infrastructure and financing schemes, generate policy strategy and initiatives as well as providing general advisory services. The industry boosted by the support of the public sector is thus more responsible to set the conditions to provide the public sectors and to develop innovation and products which are superior in international markets.
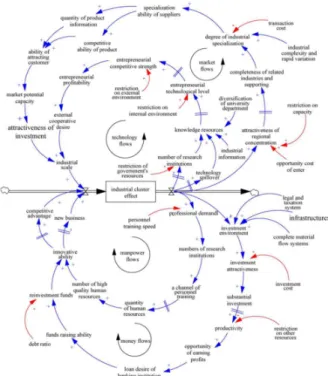
10.1.5. System Dynamics Cluster Development Model Figure 5 - Triple Helix
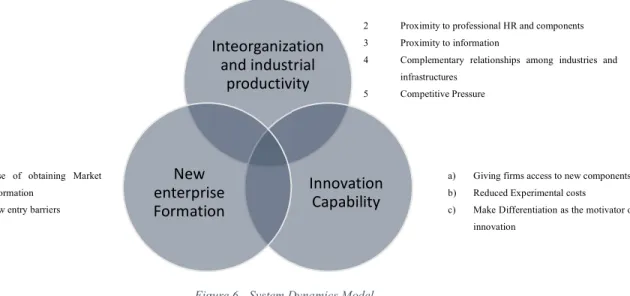
33 The system Dynamics (SD) approach establishes a model in that clusters improve competitiveness by developing 3 necessary conditions: interorganization and industrial productivity, advancing innovation capability and surging new enterprise formation (Lee et al., 2006). They state that each of these conditions is influenced by a smaller subset of conditions (see figure 3 in annex 9.2)
One of the core differences between SD and Porter’s theory is the direct reference to New enterprise formation, a very explanatory factor for entrepreneurship and rivalry (Glaesar and Kerr, 2008), but also innovation capability factor per se and not an explanatory factor of strategy and infrastructure. Furthermore, these 3 conditions factors operate across 4 distinct positive causal loops (positive correlation relations) as system dynamics terminology dictates, which explain the industrial cluster effect: the manpower flow, the technology flow, the money flow and the market flow (see annex 9 figure 8). Thus, clusters live on an evolutionary stage where deterministic forces (legacy, culture, history, structure), or called, industrial cluster effect are affected by constructive forces.
2 Proximity to professional HR and components 3 Proximity to information
4 Complementary relationships among industries and infrastructures
5 Competitive Pressure
a) Giving firms access to new components b) Reduced Experimental costs c) Make Differentiation as the motivator of
innovation 1. Ease of obtaining Market
information 2. Low entry barriers
Inteorganization and industrial productivity Innovation Capability New enterprise Formation
34 Figure 7 - Regions of Europe: Level of Clustering and Prosperity.
The 4 flows express the relationships which are impacted by a high number of quality human resources (manpower flow), the key effects of technology (technological flow), capital, infrastructure, taxation (money flow) geographical concentration and specialization (market flow) in cluster development. It expresses the importance that technical and higher education institutions have on cluster development, namely in providing specialized resources, added information, innovativeness ability and entrepreneurship skills which increase the competitive stance of a cluster. This model has several advantages, since it establishes a causation pattern, and a clearer route for policy makers to set objectives for developing the cluster effect.
The technological flow explains the key effects of technology spillovers between clustered companies and the impact of public and private institutions to provide an increased knowledge. This knowledge is then transformed by cluster players in increased productivity and competitive strength and thus, as more cooperation increases, the cost of acquiring new technologies will also increase.
Thirdly, the money flow or capital flow clarifies how taxation, regulation, infrastructure, and existence of raw materials supply chain contribute to an improvement of investment attractiveness and increased capital to increment productivity and develop new projects.
35 Lastly, the market flow explains the effect of geographical concentration and specialization effects to produce better and more attractive products. Each enhances the ability of the cluster to attract customers, which furthers emphasizes the cluster effect through increased production and concentration effects.
36 10.2 Chapter 5
10.2.1 Country tiers
The country tier grouping was made by compiling closely related countries revenue range, resulting in the following table:
Table 1 - Country tiers Classification
10.2.2 International competiveness Comparison
Table 2 - Operating Revenue Comparison (th. Euros)
Table 3 - Profitability Comparison
Country group Countries Total Industry Sample Revenue group Other Third tier
countries
Czech Republic, Poland,
Sweden 80M€-93M€
Second tier countries
Belgium, Germany,
Denmark, Austria 150M€-320M€
First tier countries Russia, France, Spain, Italy, Turkey, United Kingdom 720M€-4670M€
GROUP\COMPANY SIZE (Nº EMPLOYEES) 0-10 11-50 50-250 >250
PORTUGAL 166 1195 2628 n.a.
OTHER THIRD TIER COUNTRIES (BASE COMPARISON TO PORTUGAL)
201 2074 6807 n.a.
SECOND TIER COUNTRIES 5041 4630 23204 128973
FIRST TIER PRODUCERS 516 2520 20774 67341
TOTAL 345 2286 17115 63974
GROUP\COMPANY SIZE (Nº EMPLOYEES) 0-10 11-50 50-250 >250
PORTUGAL -0,5% 5,6% -9,0% n.a.
OTHER THIRD TIER COUNTRIES (BASE COMPARISON TO PORTUGAL)
-1,2% -3,6% 8,0% n.a.
SECOND TIER COUNTRIES -4,5% -0,1% 11,7% -5,0%
FIRST TIER PRODUCERS 4,3% 6,6% 2,1% 3,4%
37 Table 4 - Geographical Concentration comparison
Table 5 - Assets per employee comparison
TOP 10 EUROPEAN CLUSTER
REGION (NUT III) TOTAL RANKING TURNOVER RANKING EMPLOYEE RANKING COMPANY RANKING
ITI18 - AREZZO 1 1 1 1
ITH32 - VICENZA 2 2 3 3
ITC18 - ALESSANDRIA 3 3 2 5
FR101 - PARIS 4 4 5 4
ITC4C - MILANO 5 6 7 7
PT11A - AREA METROPOLITANA DO PORTO 6 16 8 2 ES511 - BARCELONA 7 7 4 16 ES613 - CORDOBA 8 12 9 6 ITF33 - NAPOLI 9 17 19 9 ITI14 - FIRENZE 10 11 12 23 GROUP GROWTH IN EXPORTED VALUE BETWEEN 2013-2017 (%, P.A.) GROWTH IN EXPORTED VALUE BETWEEN 2016-2017 (%, P.A.) EXPORTED VALUE PER FIRM ( TH. USD) TOP 3 MARKETS SHARE OF TOTAL PORTUGAL 3,0% 63% 84 80%
OTHER THIRD TIER COUNTRIES
(BASE COMPARISON TO PORTUGAL)
-1,3% 19,0% 78 68%
SECOND TIER COUNTRIES 6,0% 6,0% 376 55 %
38 Table 6 - Export Orientation comparison
Table 7 - Management and employee training comparison
GROUP\COMPANY SIZE (Nº
EMPLOYEES)
0-10 11-50 51-250 >250
PORTUGAL 116 86 55 n.a.
OTHER THIRD TIER COUNTRIES
(BASE COMPARISON TO
PORTUGAL)
110 74 161 n.a.
SECOND TIER COUNTRIES 634 134 105 48
FIRST TIER PRODUCERS 151 102 737 615
TOTAL 116 93 202 103
GROUP PARTICIPATION RATE IN EDUCATION AND TRAINING
(LAST 4 WEEKS) AGE -18-64 OF MANUFACTURING
PORTUGAL 6,9%
OTHER THIRD TIER
COUNTRIES
(BASE COMPARISON TO
PORTUGAL)
6,5%
SECOND TIER COUNTRIES 10,1% FIRST TIER COUNTRIES 9,6%
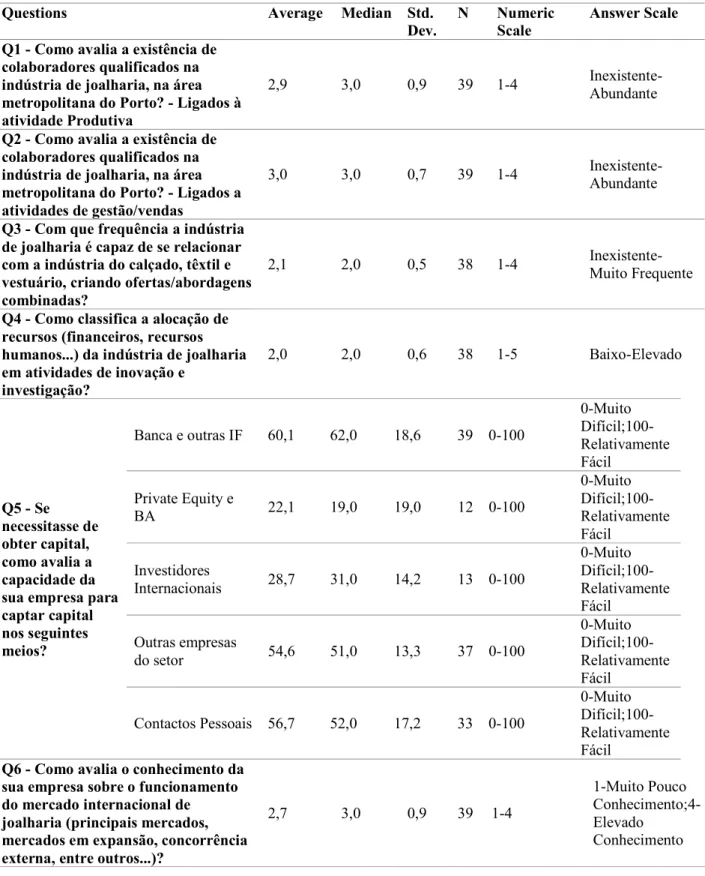
39 10.3. Survey Results
Table 8 - Survey Results
Questions Average Median Std.
Dev.
N Numeric Scale
Answer Scale Q1 - Como avalia a existência de
colaboradores qualificados na indústria de joalharia, na área metropolitana do Porto? - Ligados à atividade Produtiva
2,9 3,0 0,9 39 1-4 Inexistente-Abundante Q2 - Como avalia a existência de
colaboradores qualificados na indústria de joalharia, na área metropolitana do Porto? - Ligados a atividades de gestão/vendas
3,0 3,0 0,7 39 1-4 Inexistente-Abundante Q3 - Com que frequência a indústria
de joalharia é capaz de se relacionar com a indústria do calçado, têxtil e vestuário, criando ofertas/abordagens combinadas?
2,1 2,0 0,5 38 1-4 Inexistente-Muito Frequente Q4 - Como classifica a alocação de
recursos (financeiros, recursos humanos...) da indústria de joalharia em atividades de inovação e investigação? 2,0 2,0 0,6 38 1-5 Baixo-Elevado Q5 - Se necessitasse de obter capital, como avalia a capacidade da sua empresa para captar capital nos seguintes meios? Banca e outras IF 60,1 62,0 18,6 39 0-100 0-Muito Difícil;100- Relativamente Fácil Private Equity e BA 22,1 19,0 19,0 12 0-100 0-Muito Difícil;100- Relativamente Fácil Investidores Internacionais 28,7 31,0 14,2 13 0-100 0-Muito Difícil;100- Relativamente Fácil Outras empresas do setor 54,6 51,0 13,3 37 0-100 0-Muito Difícil;100- Relativamente Fácil Contactos Pessoais 56,7 52,0 17,2 33 0-100 0-Muito Difícil;100- Relativamente Fácil
Q6 - Como avalia o conhecimento da sua empresa sobre o funcionamento do mercado internacional de joalharia (principais mercados, mercados em expansão, concorrência externa, entre outros...)?
2,7 3,0 0,9 39 1-4
1-Muito Pouco Conhecimento;4- Elevado
40 Q7 - De 1 a 5, como classifica o
esforço da sua empresa em promoção e vendas?
3,2 3,0 0,8 39 1-5 1- Baixo e 5- Elevado Q8 - De 1 a 5, como classifica o
esforço da sua empresa na construção de um produto
diferenciado, face à oferta existente no mercado nacional?
4,0 4,0 0,7 30 1-5 1- Baixo e 5- Elevado Q9 - Quantas relações empresariais
tem com outras empresas da indústria da joalharia e atividades conexas com sede na Área
Metropolitana do Porto?
8,2 3,0 8,8 39 1-4 1-5;>25
Q10 - Como classifica essas relações
quanto à sua durabilidade? 2,1 2,0 0,8 39 1-3
Curta duração (<2 anos) - Longa duração (>5 anos) Q11 - Classifique de 1-5, se no seu
ponto de vista estas relações são cruciais para o seu negócio?
3,5 4,0 1,2 39 1-5
"Não é crucial"-"Altamente crucial" Q12 - Considera a relação
naturalmente benéfica para ambas as partes? 2,6 3,0 0,5 39 1-3 Não - Sim Q12 - Com que frequência colabora com outras empresas nestes âmbitos? Inovação 2,0 2,0 0,8 39 1-5 Nunca-Muito Frequentemente Internacionalização 2,2 2,0 1,0 39 1-5 Nunca-Muito Frequentemente Marketing/Promoção 2,5 3,0 1,0 39 1-5 Nunca-Muito Frequentemente Vendas 2,6 3,0 0,9 38 1-5 Nunca-Muito Frequentemente Investigação 1,4 1,0 0,7 39 1-5 Nunca-Muito Frequentemente Logística/Procurement 1,7 1,0 0,9 39 1-5 Nunca-Muito Frequentemente Partilha de conhecimentos de mercado 2,4 3,0 0,7 39 1-5 Nunca-Muito Frequentemente Partilha de conhecimentos de produção 2,7 3,0 1,1 39 1-5 Nunca-Muito Frequentemente Q13 - Classifique 0-100 como avalia o esforço de promoção do setor por parte da AORP?
Ao nível nacional 33,4 26,0 21,7 39 0-100 0-Ineficaz;100-Excelente Ao nível internacional 42,7 40,0 10,9 37 0-100 0-Ineficaz;100-Excelente Relação entre
empresas do setor 18,9 12,0 18,6 31 0-100
0-Ineficaz;100-Excelente
41 10.4 Survey sample characterization
Figure 9 – Distribution of respondent companies based on employee size
Figure 10 -Distribution of Companies based on turnover (in Euros) 33 4 2 1-10 11-50 50-150 7 7 7 3 1-10k 50-100k 100-500k 0,5-1M 25 4 5 1 2 <21% 21-40% 41-60% 61-80% 81-100%
42 Figure 11 - Distribution of companies based on export revenue over turnover
Figure 12 - Distribution of Companies based on brand distribution
10.5 Chapter 6
10.5.1 Identifying the Portuguese Jewellery Cluster
Figure 13 - Jewellery clusters accros Europe. 12 12 6 9 27 Não 1 2 No Answer