A Work Project, presented as part of the requirements for the Award of a Masters Degree in Economics from the NOVA – School of Business and Economics
Linking Migration and Parent Academic
Involvement: Evidence from Angola
Sara Vaz
3130
A project carried on the Master’s in Economics Program under the supervision of:
Professor Teresa Molina Millán
I dedicate this thesis to my mom.
Linking Migration and Parent Academic
Involvement: Evidence from Angola
*
Sara Vaz
Lisbon, 23
rdMay, 2018
Abstract
This study examines the effect of past migration experience on the multiple facets of
parent involvement. We run OLS and two-stage least squares regressions on a representative
sample of catholic schools in the city of Luanda, Angola. Our results do not suggest a
different level of academic involvement by returned migrants. We find, however, that parent
level of education, wealth, family composition and school performance are strong predictors
of parent involvement. In addition, we find evidence of a quadratic relation of age with most
of the dimensions of parent involvement. Gender wise, we show that mothers are significantly
more involved with their children in relation to fathers, and that parent involvement is not
conditional on child gender, suggesting the nonexistence of a child gender bias.
Keywords: Parent Involvement; Migration; Parental Aspirations; Instrumental Variables;
Angola; Africa.
*
I am extremely grateful to my advisor, Professor Teresa Molina Millán, for her guidance, patience and vital motivation. I would also like to thank Giulia Caivano, Joana Cardim, Alexandre Mendonça and Francisco Monteiro for helpful comments.
1
Introduction
Parents are known to be one of the most important, if not the greatest, influencers in a child’s life. In developing countries, where individuals not only benefit from less years of education but also profit from a lower quality learning experience, increasing parent academic involvement could act as an important component of effective schooling. Still, caregivers often do not have the time or the resources available to invest and engage in their child’s education.
This paper investigates whether past migration experience induces parents to be more involved and through which means. The argument that the choice to migrate can increase academic engagement, and thus human capital investment, was first introduced by Stark, Helmenstein, and Prskawetz1997. The authors suggested a brain gain effect in the form of higher perceived returns on education from going abroad. Still, the nexus between international migration and human capital externalities remains a disputable topic. In particular, the influence it exerts on parent academic engagement is still unclear, with some studies reporting its positive externalities (Böhme
2015), while others find evidence of its negative impact (Kandel and Massey2002). Furthermore, by conceptualizing parent involvement as uni-dimensional or by focusing on a single dimension of its construct, present research has missed to determine the effect of migration on different parental behaviors and practices. We partially fill this gap by providing further evidence of how past migration status influences the multiple facets of parent academic engagement. Given the richness of our household survey, we were also able to examine the impact of other individual and household factors and thus provide support to the findings in the literature.
In this study, we use cross-sectional observational data from 888 parents of 1863 children, from 42 catholic schools in the city of Luanda, Angola. Our research paper is the first to address the issue of parent involvement in Angola, which has been mostly ignored due to the unavailability of data. Moreover, given the characteristics of the Angolan context that had migrants departing to different locations due to war events beyond their control, we were able to address the issue of unobservable self-selection bias of return migration. We estimate OLS and two-stage least squares (2SLS) regressions on four dimensions of parent involvement, as suggested in the literature. In particular, we distinguish the migration experience effect on parent-child communication, parental educational aspirations, parent-school contact, and home
supervision. Our OLS results do not take endogeneity into account and indicate that parents who have migrated in the past are less involved with the school of their offspring. The remaining parental involvement dimensions prove to be uncorrelated with migration. When we exclude the self-selection bias issue using a trustable 2SLS method, we no longer find evidence that past migration experience affects parent involvement. This is in line with findings in the literature which confirm that international migration effects remain unclear and can both lead to brain gain and brain drain situations. We find further evidence that supports existing literature, in particular a highly significant and positive effect of parental level of education across all parent involvement dimensions, along with an equally significant and positive effect of wealth on parental aspirations. We also confirm that family composition and school performance matter for aspirations, in the sense that parents who have more children and whose child is behind its school year report a lower aspiration level. In addition, and as expected, we find mothers to be significantly more involved with their children than fathers, suggesting that the notion that both parents should be equally involved in their child’s academic life may not be so well established in Angola.
Furthermore, we find evidence of a quadratic relation between age and school contact, edu-cational aspirations, and home supervision: as caregivers get older, their level of aspirations and contact with the school decreases. Interestingly enough, home supervision provides evidence of an opposing effect (i.e., as parents get older, their assistance with their child’s homework increases). Finally, as a robustness check, we apply fixed effect methods, and find that the level of parent academic engagement does not depend on the offspring’s gender, suggesting the absence of a child gender bias issue.
The remaining part of the paper is organized as follows. Section 2 provides a literature review on parent involvement, with a particular emphasis on its predictors. Section 3 presents a brief overview of Angola. Section 4 describes the conducted survey design and the data. Section 5 indicates the estimation and identification strategy and Section 6 reports the main econometric results. Section 7 provides limitations and robustness checks and Section 8 concludes.
2
Literature Review
The argument that education poses an important role in improving people’s livelihoods, partic-ularly in the context of developing countries, is not new. Becker1995claimed education could
be the most effective way to fight poverty. For African countries, where schooling often provides a way out of poverty, education could be the deal breaker. As a matter of fact, researchers and development practitioners alike argue that Africa’s capability of reversing years of social and economic marginalization in the near future will greatly depend on the emphasis and investment given to education (Ali et al.2000). But education does not occur solely in the context of school. Shifting parental behaviors and practices could be an effective mechanism to prioritize education, as they influence on the children’s level of academic achievement (Barnard2004; Fan and Chen
2001; Keith et al. 1993; Singh et al. 1995; Dauber and Epstein 1993) and their propensity to pursue additional education (Barnard2004; Macours and Vakis2014; Sheridan2001). In poor households, schooling investment decisions for a given child depend on the parents’ perceptions about the returns to schooling and that child’s ability (Akresh et al.2012). Because the poor often believe they do not have the capacity to make a difference or to aspire, they may limit investments in education (Macours and Vakis2014) or be less likely to engage in preparatory activities that encourage the pursuit of further education (Slaughter et al. 1989). Strengthening the capacity and desire to be involved may therefore produce more rapid results in increasing child education than waiting (a generation) for parents’ educational levels to improve, for example.
Parent involvement has been described and measured in various ways in the literature. Broadly defined, parent involvement refers to different parental behaviors and practices and its often simplistically perceived as an unidimensional concept (Fan and Chen 2001). In recent years, economic researchers have moved from using a single measure of parent involvement to acknowledge its multifaceted nature. For example, Keith et al. 1993 and Singh et al. 1995
construct their parent involvement measure using a four-dimension framework, while Epstein and Connors 1992 described six types of parent involvement. More recently, Fan and Chen 2001
grouped parent involvement in four main dimensions: (1) parent-child communication, (2) home supervision, (3) educational aspirations, and (4) school contact and participation.
Although the indicators used to measure parent involvement seem to be better established, there is evidence that some dimensions may pose a greater influence on educational achievement than others. In particular, it may be educational aspirations that actually drive the positive effects on academic success (Fan and Chen2001; Halle, Kurtz-Costes, and Mahoney1997; Singh et al.
achievement (Fan and Chen2001) and may even exert a negative effect (Singh et al.1995). Moreover, researchers have failed to consistently determine what predicts parent involvement (Arnold et al. 2008; Hill et al. 2004; Oketch, Mutisya, and Sagwe 2012). On top of this, by addressing parent involvement as an unidimensional approach, or by focusing on a single dimension of its construct, studies have failed to grasp how each dimension behaves under a given context (Böhme 2015; Grolnick et al. 1997). For example, individuals who have been exposed to new environments, such as return migrants, may have higher educational aspirations due to a brain gain effect, but simultaneously prove to be less engaged at the school-level because they have distanced themselves from the community. This said, researchers should address each dimensions in a separate manner.
2.1
Socioeconomic and Demographic Predictors
Socioeconomic features such as parent educational status and income have long been consistent predictors of educational investment. Recent literature has determined parental education (Lee and Bowen 2006), socioeconomic status (Grolnick et al. 1997; Singh et al. 1995; Arnold et al.
2008) and civil status (Arnold et al.2008) as key determinants of parent involvement. Arnold et al.
2008found that single parents are less academically involved than non-single ones. In that same study, better educated and wealthier parents were more engaged with their child’s schooling. As for parents from lower socioeconomic backgrounds, despite holding higher aspirations for their children, academic involvement did not translate into academic achievement (Hill et al.2004).
Demographic characteristics such as ethnicity, gender, and traditional values also influence parent involvement. Over recent years, attitudes on parenting have shifted towards the view that both fathers and mothers should be equally involved in their children’s lives. Still, mothers are the ones who continue to be the most present in child care (Pleck and Hofferth2008; Hawkins, Amato, and King2006). But this does not imply that mothers are engaged with all their children in an equal matter. Zhang, Kao, and Hannum2007found mothers in rural China to have higher aspirations for their sons relative to their daughters, and that this aspiration bias was stronger for mothers who hold traditional gender values. Conversely, Schoon, Martin, and Ross2007found that mothers in the United Kingdom tend to have higher aspirations for their daughters who, in turn, hold higher aspirations comparing to their brothers.
2.2
International Experience
The choice to migrate has been positively associated with human capital investment at the household level (Beine, Docquier, and Rapoport 2008). However, there is still no consensus on the role migration might have on parent involvement formation, particularly in the level of aspirations. First of all, the absence of a parent might have a harmful impact on its children’s educational attainment, in the form of a lack of guidance and encouragement (Böhme 2015). Secondly, it could be that past migrant parents, by perceiving that education is not necessary to migrate, might underestimate the return on investment of education. This, in turn, might lead to lower parent involvement in its child’s academic life. Kandel and Massey2002show that Mexican children who aspire to work in the U.S. are less likely to pursue additional education. Still, the exposure to new environments can lead to a brain gain in the form of increased educational aspirations by caregivers. Böhme 2015 showed that returned migrant parents in Moldova had higher parental aspirations than non-migrants. Opposed to this finding, a report by Kandel and Kao2001showed how children from migrant households had lower educational aspirations at all academic levels in Mexico.
These contradicting results give grounds to why migration and human capital formation still remains a disputed topic. Our study sought to address this gap by focusing on changes in parent academic involvement by virtue of returned migrant status. We argue that past international experience affects parent academic engagement through a change in the way parents perceive returns on education.
3
Angola Context
Angola, a country of 29.3 million inhabitants, has more than 40% of its population living below the poverty line, despite being one of Africa’s most resource-rich countries (World Factbook
2010).
Politically, Angola became independent from Portugal in 1975, after an independence war that began in 1961. It then faced serious transition problems, including a devastating civil war fought between the two former independent movements MPLA (Movimento Popular de Libertação de Angola) and UNITA (União Nacional para a Independência Total de Angola) that only ended in
2002, after the death of UNITA’s leader. MPLA has won all presidential elections since then. After independence, most Portuguese citizens residing in Angola returned to Portugal. During the civil war, migratory movements were characterized by rural-urban migration and large cross-border refugee flows. Official reports estimate that more than 4 million people were displaced and around 600,000 fled the country (UNHCR2011). During conflict, border countries Namibia, Zambia, Democratic Republic of Congo and the Republic of Congo were the main asylum destinations, receiving around 90% of refugees (European Comission2004). The most important camps refugees settled in were the Kondi-Mbaka camp in the Republic of Congo; the Maheda and Mayakwayukwa camps in Zambia; the Divuma, Kisenge and Tshimbumbulu camps in Zaire; and the Osiri camp in Namibia (ACNUR1997).
Around 75% of those who fled the country during war period have returned to Angola (UNHCR 2011), and around 19% of the Angolan population is currently living in the city of Luanda (World Factbook2010).
4
Data Description
The data used in this research paper comes from individual surveys that were conducted by field teams, recruited and trained by the author and colleagues in Luanda between 24 February and 21 April 2018. The core purpose of the conducted surveys was to measure the impact of an educational program named Aula Digital, promoted by Fundación Telefónica and the "La Caixa" Banking Foundation.1 The survey was administered to 888 parents or guardians of 1863 children2, from 42 catholic primary schools in Luanda, Angola. On average, 22 interviews were conducted per school.
4.1
Sampling
The data collection process followed the sampling choice of primary schools by the La Caixa and Telefónica institutions to participate in the program. Each school has, on average, 761 students, 19 teachers and 13 classrooms.3
1For information about the main research project behind the data collection, visit
http://novafrica.org/research/profuturo-evaluating-the-impact-of-the-technology-based-program-aula-digital-in-primary-schools/.
2For parents or guardians with more than one child, they responded for each child separately. 3Data provided by Profuturo, the institution behind Aula Digital.
Before interviewing the parents, 60 students from each school were surveyed. Students were selected following a standard two-stage clustered representative sampling procedure - first on classes from the 4t h, 5t h and 6t h grades, then on students. This sampling procedure implies that all students in the universe under consideration had the same probability of being sampled, and allowed us to have a representative sample of the catholic schools in Luanda. Then, each student was given an individual invitation they had to deliver to their parent/guardian, requesting their presence at the school in a given date and time to proceed with the surveys.4 Each subject was required to be the parent or guardian of the selected child.5 If this condition was not fulfilled, enumerators would not proceed with the interview and parents would be contacted again for a reschedule. No-shows should be mentioned as a source of imperfection in the sampling. To mitigate this problem, we called each caregiver to assure their child had delivered the invitation and to confirm their presence.6 For those who did not make an appearance, the survey was postponed. Due to time constraints, those surveys are not included in this research paper.
4.2
Survey Design
The survey instrument was tailored to accurately measure parent educational involvement at home and at school. As noted in Section 2, researchers often define parent involvement as a construct of four main dimensions: discussing topics with the child, home supervision, school contact and participation, and educational aspirations (Keith et al.1993; Fan and Chen2001; Singh et al.1995). We categorized survey measures that reflected parent involvement into composites measuring each of these dimensions.7 We also assigned past migrant status to members who lived or worked abroad for at least three months.
Most questions followed an underlying numerical rating (e.g., 1 to 4 for parent communication) to assess the frequency with which parents discussed school-related topics with their children,
4Each invitation had a succinct explanation of the aim of the meeting (i.e., to know the parent’s opinion about their children’s overall education), and indicated the name of the school it would be held and a specific date and time. 5We only considered as guardians family members that fulfilled one of the next two requirements: 1) parent was absent (e.g. lived in another province) and the self-proclaimed guardian was fulfilling the parenting role; 2) parent was currently living in the same household but was neither present in the child’s schooling nor close to its offspring. In either case, self-proclaimed guardians would answer a series of questions concerning their assiduity in school meetings and knowledge of the child’s schooling habits as a double-check.
6We called parents whose phone number was available (on average, we had phone numbers of 51% of the parents). Whenever a parent replied he would not be present, we asked for the reason. The two main reasons for no-shows were work-related or due to a funeral ceremony.
checked their homework, and attended school meetings. Response alternatives used ordinal scale qualifiers (e.g., "Never/almost never", "Once or twice a month", "Once of twice a week", "Everyday/almost everyday").
To measure parental aspirations, the following two questions were asked for each of their children: "Up to what level would you like him/her to study?" and "Now imagine that money was not a problem. Up to what level would you like him/her to study?". The second question aimed at getting a pure aspiration level, free of socioeconomic constraints, and it is our preferred aspiration measure. From the 3r d school, the structure of the questions changed slightly: we randomly assigned a new version of the questionnaire to half of the enumerators which included an introductory phrase that was read before asking the questions on aspirations.8 The other half remained with the original version. Additionally, enumerators stopped reading response options on aspirations and expectations out loud.9 Because this changed how parents answered, we control for whether answers differed significantly when options were not mentioned, and consistently find that the interaction terms and comparison means are statistically different from zero. This supports our argument that parents answered higher levels of education if schooling options were previously mentioned. It is not clear whether this is due to imperfect information or social desirability bias. Either way, to decrease the answering bias in the sample, observations from the survey version employed before the 3r d school were excluded.10 A caveat in our survey design structure is worth mentioning: apart from parental aspirations, the remaining three composites of parent involvement were solely measured for the child that delivered the invitation to the parent. As such, for some households, we were unfortunately unable to construct those composites for all siblings.
We standardized question-survey measures to create summary indices for the dimensions of parent involvement, apart from educational aspirations. Following the procedure used by Kling, Liebman, and Katz 2007, we computed z-scores indices to make outcomes comparable. For example, we create an index of parent-child communication that averages together six measures
8By adding the following introductory phrase Sometimes, due to financial constraints or lack of opportunities,
our future expectations do not match our highest hopes and dreams, we aimed at getting a pure aspiration effect
(i.e. goal setting under perfect information). This approach was chosen in line with the recommendations by Böhme (2015). Interaction terms and comparison means are not statistically different from zero. Thus, results are robust to the inclusion of both versions.
9It was hypothesized that reading the schooling options out loud could bias the respondents’ answers, misleading them to opt for the last option, which referred to highest level of schooling (PhD).
of parent interest and discussion with child about educational topics. Home supervision (in this case, homework monitoring) and school contact are composed of a single frequency indicator. Variable measures were standardized by subtracting the mean and dividing by the standard-error. Subsequently, we computed the equally weighted average of the normalized variables. We opted for this methodology as it allows the comparison of scores measured on different scales, and provides a clear perception of where an observation stands in the distribution relative to the entire sample.
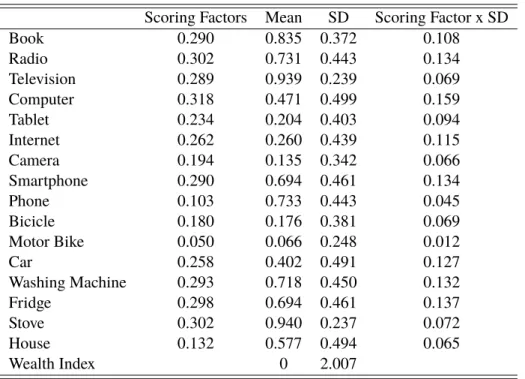
Additionally, as a proxy for economic status, we created a linear wealth index based on household asset ownership indicators, using the first principal component analysis, following the asset index by Filmer and Pritchett2001.11 This procedure determines the relative importance of each asset, by giving larger weight to assets that vary the most across households so that an asset found in all households is given a weight of zero.
5
Identification and Estimation Strategy
Given that the decision to migrate is subject to observed and unobserved characteristics of individuals, unobserved factors would be correlated with migration, thus violating one of the key assumptions of OLS in obtaining unbiased estimates. Particularly, we are concerned about reverse causality, selection bias and omitted variables. The first concern would arise if those that are more involved are also those who migrate (to afford providing their children with higher educational levels, for example). Selection bias stands because migrants can “self-select”, which means they can differ fundamentally from those that choose not to migrate. For example, more educated, motivated or able households could be the ones more likely to migrate (positive selection) or less likely (negative selection). Either way, these are characteristics that would potentially impact on their academic involvement. Finally, one finds omitted variable bias when migrants “self-select” based on unobserved characteristics (e.g. risk preferences).
5.1
Identification Strategy
Given the problem of self-selection, a convincing analysis of the causal link between parent involvement and migratory experience requires an exogenous source of variation in migration
choices. In this paper, we follow the methodology suggested by Batista, McIndoe Calder, and Vicente2013and argue that the proportion of time lived in a state of war, as well as the distance between the migrant’s province of birth and refugee camp areas, are potential sources of such exogenous variation. We further hypothesize whether there are within-household variations by running a fixed-effects estimation, which allows us to go around the selection bias problem by assuming that the unobserved component is constant across households, allowing for a limited form of endogeneity.
5.2
Estimation Strategy
We begin by estimating the impact of migration on the dimensions for parent involvement by running the following OLS regression form:
yi j = α + βMi+ θX
0
i j + εi j (1)
Where yi j is the outcome of interest (educational aspirations, parent-child communication, school contact, and home supervision of respondent i for child j), Miis a dummy variable equal to 1 if the parent has migrated in the past and 0 if otherwise, and X
0
i j denotes a set of observable
individual and household characteristics. εi j is the error term. Our coefficient of interest is β, which represents the effect of past migrating experience on each dimension for parent involvement. Standard-errors are clustered at school-level in all regressions.
To overcome the problem of selection bias previously mentioned, our second model follows a two-stage least square (2SLS) approach mentioned in our identification strategy. The structural equation of the first-stage is as follows:
Mi = γ + δ1Wi+ δ2Di+ ηX
0
i j + ui j (2)
Our first instrumental variable, Wi, is a dummy variable equal to 1 if a given individual is above the median percentage of time lived during civil war, and 0 if otherwise. The second instrumental variable, Di, is a continuous variable of distance in hundreds of kilometers between residence of birth12 and closest refugee camp in a neighbouring country.13
Contrarily to OLS, we are now estimating the local average treatment effect, where the predicted migration effect will apply to only a subset of participants whose choice to migrate was
12Residence of birth was equated to province of birth. For those born in Luanda province, information on municipality of birth was also available and was thus used for accuracy.
influenced by both variables. Hence, the interpretation of the estimated migration effect will be the average change in outcomes from a change in the estimated propensity score of migrating in the past due to ˆP(W ) or ˆP(D), holding other observed covariates fixed.
Our third and last model identifies whether parents’ involvement differs across siblings, and follows a fixed-effects regression estimation:
yi j = α + β1firsti j + β2firstsoni j + β3malei j+ β4agei j + β5behindi j+ εi j (3)
Where firsti j, firstsoni j, malei j and behindi j, are dummy variables equal to 1 if the child is a
first-born, first-born son, male, or behind his school year, and 0 if otherwise. agei j denotes three
dummy variables with child’s age intervals.14
6
Econometric Results
6.1
Descriptive Statistics
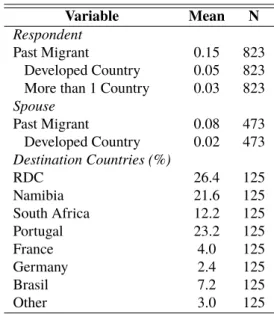
Table 1 depicts basic migration statistics. Out of all recruited respondents, 15% had lived or worked abroad for at least three months, of which 5% chose a developed country as destination. 8% had spouses who had migrated in the past. Preferred destinations include the Democratic Republic of Congo (26.4%), Portugal (23.2%) and Namibia (21.6%). About two-thirds of the migrants chose to migrate to African countries. This geographic pattern of migration implies that this research paper will mainly examine migration to close-by countries.
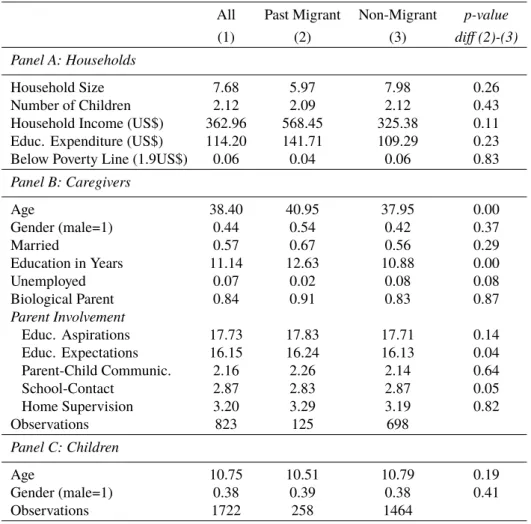
Table 2 reports a wide variety of household and individual characteristics that were used in the regression analysis that follows. On average, households have 7.68 family members and 2.1 children. Average household income is 12 US$/day, with 6% of the households living under 1.90 US$/day. Recruited respondents spend, on average, 114.20 US$/year on education. Respondents have, on average, 38.40 years, with returned migrants being significantly older (40.95 years) than non-migrants (37.95 years). Caregivers are predominantly females (56%), while most migrants are males (54%). Most recruited respondents were married (57%). Past migrants are significantly more educated (12.63 years) than non-migrants (10.88 years).
On average, respondents would like their children to complete 17.73 years of schooling,15 which is above the years of education necessary for holding a university degree. When taking
14Age dummy 1: 10-12 years; age dummy 2: 13-15 years; age dummy 3: over 15 years.
Table 1: Past migration experience statistics
Variable Mean N
Respondent
Past Migrant 0.15 823
Developed Country 0.05 823
More than 1 Country 0.03 823
Spouse Past Migrant 0.08 473 Developed Country 0.02 473 Destination Countries (%) RDC 26.4 125 Namibia 21.6 125 South Africa 12.2 125 Portugal 23.2 125 France 4.0 125 Germany 2.4 125 Brasil 7.2 125 Other 3.0 125
Note: Calculations based on the version employed after
the 3r dschool (remaining version excluded). Answers "Don’t know" and "Refused to answer" dropped. Obser-vations might deviate due to missing values.
the constraints they face into consideration, migrants have higher expectations (16.24 years) than non-migrants (16.13 years), which is still above a university degree. Overall, these are very high goals, considering that only 51% of children between the ages of 12-18 attend secondary school in urban areas of Angola (INE2017). Caregivers scored, on average, 2.16 out of 4 in educational topic discussions with their children, with no significant differences across comparison groups. Non-migrant parents contact the school more often (2.87 out of 5) than returned migrants do (2.83 out of 5). As for home supervision, respondents scored an average of 3.20 out of 4. Children have, on average, 10.75 years of age and are predominantly female (62%).
6.2
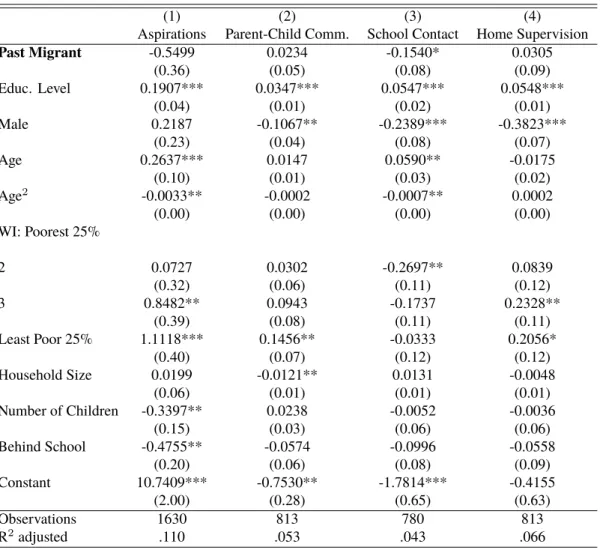
OLS Results
Table 3 reports the OLS estimation results. We find that having migrated does not affect educational aspirations caregivers hold for their children. If anything, returned migrant parents seem to have lower aspirations than non-migrant ones. Age does not have a linear effect on aspirations: older parents hold higher aspirations by more than a quarter of a school year but, as caregivers get older, their aspiration level decreases, on average, by -0.003 of an academic year (both significant at the 1% and 5% level, respectively). As expected, educational aspirations increase with parent/guardian level of education16 and wealth.17 As a matter of fact, being in the
16See Oketch, Mutisya, and Sagwe2012; Böhme2015.
Table 2: Descriptive statistics
All Past Migrant Non-Migrant p-value
(1) (2) (3) diff (2)-(3)
Panel A: Households
Household Size 7.68 5.97 7.98 0.26
Number of Children 2.12 2.09 2.12 0.43
Household Income (US$) 362.96 568.45 325.38 0.11
Educ. Expenditure (US$) 114.20 141.71 109.29 0.23
Below Poverty Line (1.9US$) 0.06 0.04 0.06 0.83
Panel B: Caregivers Age 38.40 40.95 37.95 0.00 Gender (male=1) 0.44 0.54 0.42 0.37 Married 0.57 0.67 0.56 0.29 Education in Years 11.14 12.63 10.88 0.00 Unemployed 0.07 0.02 0.08 0.08 Biological Parent 0.84 0.91 0.83 0.87 Parent Involvement Educ. Aspirations 17.73 17.83 17.71 0.14 Educ. Expectations 16.15 16.24 16.13 0.04 Parent-Child Communic. 2.16 2.26 2.14 0.64 School-Contact 2.87 2.83 2.87 0.05 Home Supervision 3.20 3.29 3.19 0.82 Observations 823 125 698 Panel C: Children Age 10.75 10.51 10.79 0.19 Gender (male=1) 0.38 0.39 0.38 0.41 Observations 1722 258 1464
Note: Calculations based on the version employed after the 3r d
school (remaining version excluded). Answers "Don’t know" and "Refused to answer" dropped. Observations might deviate due to missing values. Two-tailed t-tests with standard errors clustered at the school level. For simplicity, parent involvement dimensions (apart from aspirations and expectations) are presented as summary indices before being standardized using z-scores.
top quartile is associated with an increase in aspirations by, on average, 1.11 years of schooling (significant at the 1%). Family composition and the child’s school performance also matter: having an additional child and being behind the supposed school year is associated with a lower aspiration level (5% significance level).
Like parental aspirations, migration is not significantly correlated with parent involvement at home (columns 2 and 4), while level of education is positively associated with both dimensions (significant at the 1% level). At odds with the findings of Dauber and Epstein1993and column 1, we conclude that family composition and wealth matter for parent-child communication: increasing family size by one member is associated with less time dedicated to topic discussion by -0.012 standard deviations, while being in the top quartile increases discussion by, on average, 0.145 deviation points (both significant at the 5% level).
Table 3: OLS regression on parent involvement outcomes
(1) (2) (3) (4)
Aspirations Parent-Child Comm. School Contact Home Supervision
Past Migrant -0.5499 0.0234 -0.1540* 0.0305 (0.36) (0.05) (0.08) (0.09) Educ. Level 0.1907*** 0.0347*** 0.0547*** 0.0548*** (0.04) (0.01) (0.02) (0.01) Male 0.2187 -0.1067** -0.2389*** -0.3823*** (0.23) (0.04) (0.08) (0.07) Age 0.2637*** 0.0147 0.0590** -0.0175 (0.10) (0.01) (0.03) (0.02) Age2 -0.0033** -0.0002 -0.0007** 0.0002 (0.00) (0.00) (0.00) (0.00) WI: Poorest 25% 2 0.0727 0.0302 -0.2697** 0.0839 (0.32) (0.06) (0.11) (0.12) 3 0.8482** 0.0943 -0.1737 0.2328** (0.39) (0.08) (0.11) (0.11) Least Poor 25% 1.1118*** 0.1456** -0.0333 0.2056* (0.40) (0.07) (0.12) (0.12) Household Size 0.0199 -0.0121** 0.0131 -0.0048 (0.06) (0.01) (0.01) (0.01) Number of Children -0.3397** 0.0238 -0.0052 -0.0036 (0.15) (0.03) (0.06) (0.06) Behind School -0.4755** -0.0574 -0.0996 -0.0558 (0.20) (0.06) (0.08) (0.09) Constant 10.7409*** -0.7530** -1.7814*** -0.4155 (2.00) (0.28) (0.65) (0.63) Observations 1630 813 780 813 R2adjusted .110 .053 .043 .066
Note: * p<0.10, ** p<0.05, *** p<0.01. Sample includes all recruited respondents except those from the survey version
em-ployed before the 3r dschool. Observations might deviate due to missing values. WI denotes wealth index in quartiles, calcu-lated using Principal Component Analysis (PCA) as described by Filmer and Pritchett2001. Apart from aspirations, which is a continuous variable, the remaining dependent variables are equally weighted indices of z-scores. Controlling also in all speci-fications for neighborhood, marital status, unemployment, child gender and birth order; child age dummies included. Standard errors clustered at the school level in parenthesis.
The only evidence of a significant and negative correlation with migration is with school contact: being a past migrant is associated with a decrease of school contact by, on average, -0.154 standard deviations (significant at the 10% level). By being abroad, return migrants may have lost contact with the community and, thus, the school (as a matter of fact, more than half of the migrants are not originally from the province of Luanda, which could partly explain their apparent detachment from the community). In addition, individuals who experienced migration might underestimate the returns on schooling if they are under the impression that education is not necessary to migrate.18 Alternatively, one could argue that the children of past migrants perform better in school, and so there is less need to contact with the school. Moreover, we find once again evidence of a quadratic relation of age with school contact: the older parents become,
the lower their involvement with the school (significant at the 5% level).
Lastly, and in line with past research, we find evidence that mothers are significantly more involved with their children both at home and at school (significant at the 5% and at 1%).19
6.3
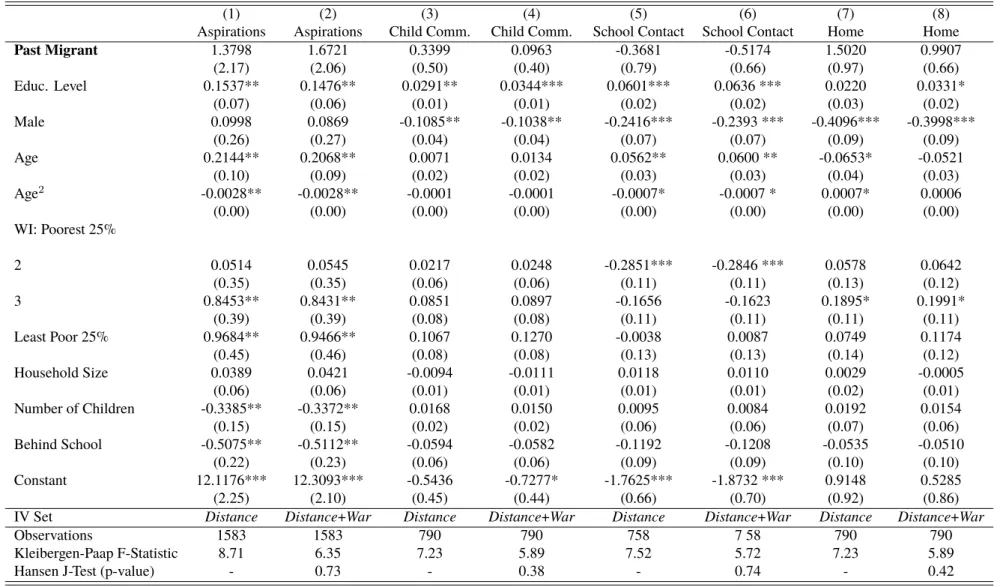
Instrumental Variable Estimation
Still, because our OLS model is likely to capture the effects of unobservables due to self-selection, we turn to our instrumental variable approach. The statistics obtained are displayed in Table 4. We find no evidence of a statistical significant impact of past migration on parent involvement, including the dimension of school contact. If anything, the effect of migration on parental aspirations has reversed its sign and it is now highly positive. This lack of significance is in accordance with the literature reviewed, which provides mixed evidence of the effect of international experience.20 Still, level of education of caregivers remains a strong and positive predictor for all dimensions, apart from column 7 of home supervision. In the same lines, wealth continues to positively predict parental aspirations (being in the top two quartiles increases educational aspirations by almost one school year, relative to poorest 25% - significant at the 5% level). As for family composition and school performance, respondents who have more children or whose child is behind its school year see a decrease in aspirations by, on average, -0.338 and -0.507, respectively (significant at the 5% level).
In line with the OLS results, we also find evidence of a quadratic relation of age with parental aspirations, school contact (both significant at the 5% level) and home supervision (significant at the 10% level). Interestingly enough, this relationship is reversed for assisting with homework, suggesting that, as caregivers get older, they help their children with homework more. It could be caregivers feel more confident with school topics and thus provide more assistance. Lastly, our results consistently support the argument that mothers are more engaged in the academic lives of their offspring, except in the case of aspirations, suggesting that mothers and fathers do not aspire different levels. These results are significant at 5% (columns 3-4) and at 1% (columns 5-8).
19See Pleck and Hofferth2008; Hawkins, Amato, and King2006.
Table 4: Two-stage least squares regressions
(1) (2) (3) (4) (5) (6) (7) (8)
Aspirations Aspirations Child Comm. Child Comm. School Contact School Contact Home Home
Past Migrant 1.3798 1.6721 0.3399 0.0963 -0.3681 -0.5174 1.5020 0.9907 (2.17) (2.06) (0.50) (0.40) (0.79) (0.66) (0.97) (0.66) Educ. Level 0.1537** 0.1476** 0.0291** 0.0344*** 0.0601*** 0.0636 *** 0.0220 0.0331* (0.07) (0.06) (0.01) (0.01) (0.02) (0.02) (0.03) (0.02) Male 0.0998 0.0869 -0.1085** -0.1038** -0.2416*** -0.2393 *** -0.4096*** -0.3998*** (0.26) (0.27) (0.04) (0.04) (0.07) (0.07) (0.09) (0.09) Age 0.2144** 0.2068** 0.0071 0.0134 0.0562** 0.0600 ** -0.0653* -0.0521 (0.10) (0.09) (0.02) (0.02) (0.03) (0.03) (0.04) (0.03) Age2 -0.0028** -0.0028** -0.0001 -0.0001 -0.0007* -0.0007 * 0.0007* 0.0006 (0.00) (0.00) (0.00) (0.00) (0.00) (0.00) (0.00) (0.00) WI: Poorest 25% 2 0.0514 0.0545 0.0217 0.0248 -0.2851*** -0.2846 *** 0.0578 0.0642 (0.35) (0.35) (0.06) (0.06) (0.11) (0.11) (0.13) (0.12) 3 0.8453** 0.8431** 0.0851 0.0897 -0.1656 -0.1623 0.1895* 0.1991* (0.39) (0.39) (0.08) (0.08) (0.11) (0.11) (0.11) (0.11) Least Poor 25% 0.9684** 0.9466** 0.1067 0.1270 -0.0038 0.0087 0.0749 0.1174 (0.45) (0.46) (0.08) (0.08) (0.13) (0.13) (0.14) (0.12) Household Size 0.0389 0.0421 -0.0094 -0.0111 0.0118 0.0110 0.0029 -0.0005 (0.06) (0.06) (0.01) (0.01) (0.01) (0.01) (0.02) (0.01) Number of Children -0.3385** -0.3372** 0.0168 0.0150 0.0095 0.0084 0.0192 0.0154 (0.15) (0.15) (0.02) (0.02) (0.06) (0.06) (0.07) (0.06) Behind School -0.5075** -0.5112** -0.0594 -0.0582 -0.1192 -0.1208 -0.0535 -0.0510 (0.22) (0.23) (0.06) (0.06) (0.09) (0.09) (0.10) (0.10) Constant 12.1176*** 12.3093*** -0.5436 -0.7277* -1.7625*** -1.8732 *** 0.9148 0.5285 (2.25) (2.10) (0.45) (0.44) (0.66) (0.70) (0.92) (0.86)
IV Set Distance Distance+War Distance Distance+War Distance Distance+War Distance Distance+War
Observations 1583 1583 790 790 758 7 58 790 790
Kleibergen-Paap F-Statistic 8.71 6.35 7.23 5.89 7.52 5.72 7.23 5.89
Hansen J-Test (p-value) - 0.73 - 0.38 - 0.74 - 0.42
Note: * p<0.10, ** p<0.05, *** p<0.01. IV set War: Median percentage of lifetime during civil war. IV set Distance: Distance between birth residence and closest refugee camp. WI denotes wealth index
in quartiles. Controlling also in all specifications for neighborhood, marital status, unemployment, child gender and birth order; child age dummies included. Standard errors clustered at the school level in parenthesis.
7
Robustness and Limitations
7.1
Fixed-Effects Estimation
Apart from migration, our model can be subject to other unobserved household characteristics that influence the way parents relate with their offspring. As a precaution, we run a fixed-effects model, which greatly reduces potential omitted variable bias from past migration and other unobservables.
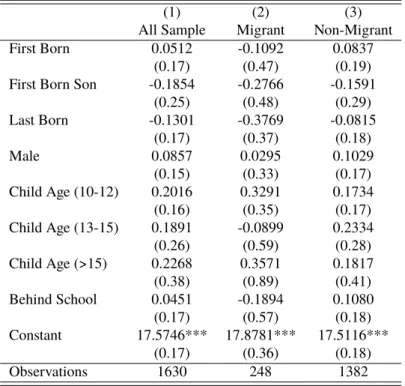
Statistics are reported in Table 5.21 We find no evidence that aspirations vary across siblings. Also, results do not show that parent engagement is conditional on child gender, suggesting the absence of a child gender bias, contrarily to the findings in the literature.22
Table 5: Fixed-effects regressions for educational aspirations
(1) (2) (3)
All Sample Migrant Non-Migrant
First Born 0.0512 -0.1092 0.0837
(0.17) (0.47) (0.19)
First Born Son -0.1854 -0.2766 -0.1591
(0.25) (0.48) (0.29) Last Born -0.1301 -0.3769 -0.0815 (0.17) (0.37) (0.18) Male 0.0857 0.0295 0.1029 (0.15) (0.33) (0.17) Child Age (10-12) 0.2016 0.3291 0.1734 (0.16) (0.35) (0.17) Child Age (13-15) 0.1891 -0.0899 0.2334 (0.26) (0.59) (0.28) Child Age (>15) 0.2268 0.3571 0.1817 (0.38) (0.89) (0.41) Behind School 0.0451 -0.1894 0.1080 (0.17) (0.57) (0.18) Constant 17.5746*** 17.8781*** 17.5116*** (0.17) (0.36) (0.18) Observations 1630 248 1382
Note: * p<0.10, ** p<0.05, *** p<0.01. Sample includes all recruited respondents
except those from the survey version employed before the 3r dschool. Observations might deviate due to missing values.
21As mentioned in Section 4, we can only provide results for parental aspirations because we have information on all siblings and, as a result, there is variation within a household.
7.2
Threats to Instrument Validity
7.2.1 Percentage of time lived in a state of war
Given the political context described in Section 3, it seems reasonable to assume that individuals who migrated at the outbreak of civil war did so due to events that were beyond their control. Thus, they were likely to be forced to migrate, independent of their characteristics. One could question this assumption, on the grounds that those who migrated to escape conflict did so because they were on the losing side (i.e., were siding with the independent movement UNITA) and so did not hold the Marxist views of the leading independent movement MPLA. Those who fled under such conditions could have faced socioeconomic repercussions upon return (e.g., had a harder time finding a job due to their political choices or refugee status). However, we could not find evidence that individuals migrated for political views in the first place (Brooke1987). In fact, it is more reasonable to assume terrorism, coups, and crime were the main drivers for leaving the country.
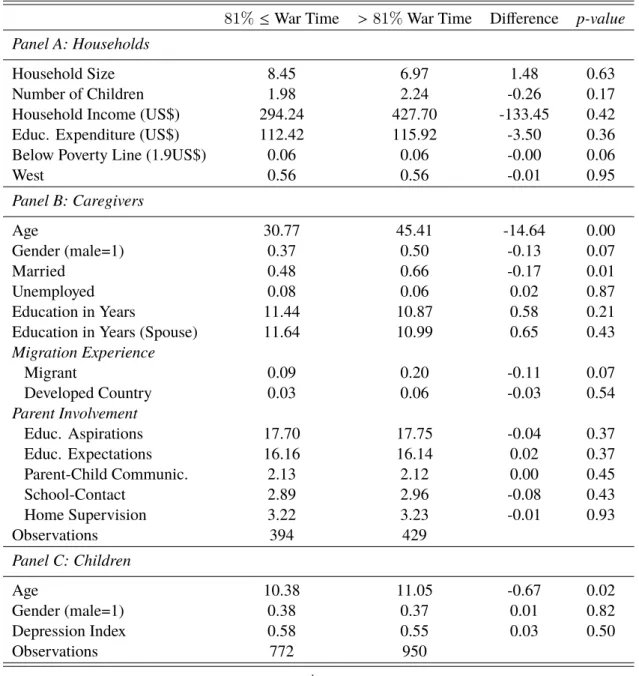
It could also be that parents who experienced civil war for a longer period of time have unobserved characteristics that affect parent involvement. Research has associated migrating experience due to conflict with parental depression and anxiety (Thabet et al. 2008) which, in turn, is associated with lower parent involvement (Kohl, Lengua, and McMahon2000). Similarly, Thabet et al.2008showed that parents who experience post traumatic stress disorder (PTSD) due to civil conflict contribute to children’s PTSD and anxiety symptoms. We hypothesize this by comparing depression, stress and anxiety levels of children whose parents are above or below the median percentage of time lived during war. We follow the methodology suggested by Witvliet et al.2010, Angold et al.1987and Muris et al.1998to construct a parent-reported child depression, anxiety and stress index.23
We find no significant differences across groups below and above the median time spent during civil war on child depression, anxiety and stress levels. As a matter of fact, both groups seem to be highly comparable. The only covariates that provide evidence of being significantly different across comparison sets are: probability of being below the poverty line (p-value=0.06),
23Refer to Table 6 for the construction of the index. Each item was answered on a 3-point Likert scale ("Not true", "Somewhat true", "Very true") to assess parent’s perception on their child’s behavior. Scores were then averaged across items and ranged between 0 and 2, with higher scores indicating more symptoms of depression, anxiety and stress.
age of caregiver (p-value=0.00) and child (p-value=0.02), being male (p-value=0.07), and being married (p-value=0.01).24 Since our instrumental variable is a linear transformation of the age variable of the respondent, and being age highly correlated with gender, civil status, child age and number of children, it is reasonable to assume that these covariates will be significantly different across groups.25 To rule out that what we are capturing is indeed age effects on the choice to migrate instead of exposure to war, we look at observations around the cutoff of our instrument (i.e., observations within the age group of 34 to 42 years old, since the median age is 38), assuming that they are very similar. We find that the discrete instrument has a significant and positive effect on migration, while coefficients for age and age2are non-significant.26
7.2.2 Distance between migrant province of birth and refugee camp areas
A possible threat to the exclusion restriction needed for distance to be a valid instrument is that individuals who were born closer to refugee camps in neighbouring countries would have lived in more isolated, less urban areas. If this makes them less able to be academically involved with their children, then we would expect a downward bias in the IV estimator, since it would be in part capturing the returns to less urban experience. To investigate this possibility, we regressed distance on log income and education level for the group of migrants (results not reported). The coefficient on level of education is 0.14 and insignificant (p-value=0.28). In terms of income, the coefficient of distance is 0.08 and also insignificant (p-value=0.23). Thus, there is no strong effect of being born closer to a refugee camp on labor income or education level.
A second potential threat is that the instrument could be capturing distance to the border opposed to distance to refugee camp areas, which is likely to affect outcomes in the home country and may be positively correlated with migration. To rule out this possibility, we regressed distance to urban areas in neighbouring countries on migration (results not reported). The coefficient on migration is negative (-0.03) and insignificant (p-value=0.63). Therefore, it is reasonable to assume that our instrument is, indeed, capturing distance to refugee camps.
24Refer to Table 8 in the Appendix for presentation of the results.
25Refer to Table 9 in the Appendix for the correlation matrix of the age variable. 26See Table 11 in the Appendix for first-stage regressions on migration.
7.2.3 Relevance and Validity Tests
The robustness of the reported IV estimates was also tested by performing relevance and exogeneity tests. Both instruments are correlated to the endogenous migration variable but only weakly, since first-stage Kleibergen-Paap F-Statistics for all specifications are bellow the rule of thumb of 10.27 Because errors are not assumed to be i.i.d., we further test for weak identification with a correspondingly-robust Kleibergen-Paap Wald F statistic and reject the null that instruments are not relevant (p-value=0.002). Still, results need to be interpreted with care since estimators can perform poorly when instruments are weak. In addition, we test for the validity of the overidentifying restrictions, by performing a a Hansen J-test. Results are reported in Table 4 and fail to reject the null that both instruments are exogenous.
Our preferred IV specification only uses distance as an instrument (columns 1, 3, 5 and 7), even though using both instruments can attenuate concerns regarding the local validity of each instrument when used separately. Still, when looking at the Kleibergen-Paap F-Statistic from Table 4 (and Table 10 in the Appendix), we find the exogenous variation of distance to be far more relevant than using both or an interaction of both.
7.3
Limitations and Further Research
Several potential caveats remain in our estimation strategy. First, since our sample is repre-sentative of the catholic schools in Luanda, we might be capturing a different bias compared to previous literature that uses administrative samples. It could be that the catholic schooling system provides a better quality learning experience and promotes parent engagement, independent of the parents’ characteristics. This would partially explain the non-significant effect of past inter-national experience and the surprising high level of aspirations/expectations parents hold for their children, given the educational context in Angola. As a matter of fact, it would be interesting to see whether the observed high levels of aspirations lead to higher effort in the future (and thus, increased academic achievement), or frustration (due to unrealistic hopes). Conditional on data availability, looking at future academic performance would also provide insight on the efficacy of parent involvement in Angola.
Secondly, despite the lack of significance in both the OLS and 2SLS results, the difference in magnitude in the estimated coefficients should be noted. Readers should keep in mind that the 2SLS estimates only represent the local average treatment effect of those responsive to the instruments (i.e., displacement caused by war), which may not be representative of the overall population. Our mean comparison analysis did not provide grounds to assume groups are not comparable,28 but do not capture differences in unobservable effects intrinsic to migration. It could be that compliers (i.e., past war migrants) did not consider migration as an opportunity. Instead, the pressure they were under led them to reject the norms and values of the receiving country and thereby left their parental aspirations and involvement in school matters unchanged. A final caveat worth mentioning in our model refers to disclosure effects. Since the completion of surveys required the presence of an enumerator, respondents’ answers could suffer from social desirability bias. If this were the case, mean reports from both migrant and non-migrant groups are likely to be distorted. This could explain, in part, the high levels of reported aspirations and expectations.
8
Conclusion
Educational researchers, and society in general, have long been interested in parent academic engagement and its powerful influence on child school performance. In this study, we provide the first estimation of parent involvement in Angola, by arguing past international experience can work as an important mechanism to effective schooling, through a change in the perception of returns on education. Given that the decision to migrate is subject to unobservable self-selection bias, our estimation results are based in the most reliable method, the two-stage least squares method. In particular, we employ displacement caused by wars and distance to refugee camps as different sources of variation to identify migrant self-selection.
The most remarkable finding is that past migrating experience does not influence parent involvement. Our results are in line with past literature that confirm why migration and human capital formation still remain a disputable topic. Despite the insignificance of the results, the opposing signs and diverging magnitudes of the coefficients on the various facets of parent involvement demand further research in the topic. One can also argue that the true impact of
having migrated in the past will be felt later on, when investment decisions are made (e.g., upon the decision to enroll in secondary school or college) and the pressure of parents to encourage their children to pursue additional education is felt.
Still, we find that caregivers’ level of education exerts a positive and highly significant effect on all the dimensions of parent involvement. Moreover, our results show that mothers are more involved in their child’s academic life than fathers, suggesting that the view that both fathers and mothers should be equally engaged in their child’s lives may not be so well established in Angola. Interestingly enough, when it comes to the child itself, we find no evidence of a gender bias, suggesting that parents’ engagement is not conditional on child gender. In addition, we find evidence of a positive effect of wealth on parental aspirations. This supports the argument by Appadurai 2004, who defends the poor lack the capacity to aspire. Moreover, results indi-cate family composition and school performance matter for educational aspirations: having an additional child and being behind school year translates into a lower level of aspirations.
Finally, and adding to the literature, we found evidence of a quadratic relation between age of caregiver and educational aspirations, school contact, and homework supervision. In particular, our results show as caregivers get older, their aspiration and school contact levels decrease. The opposite happens with homework supervision: by getting older, parents assist more with their child’s homework.
Overall, even though we were not able to provide evidence of a significant impact of past migration on parent involvement, this research is only the starting point. Angola still has a long way to go when it comes to educational levels, and it has been proven by previous research that increasing parent involvement, particularly by shaping educational aspirations, can lead to significant increases in school performance and human capital investments. This said, we hope our research stimulates economists and policymakers alike to provide further research on measures that shift parent academic engagement and increase overall human capital accumulation.
References
ACNUR. 1997. “Repatriamento e Reintegração de Refugiados Angolanos”.
Akresh, Richard et al. 2012. “Child ability and household human capital investment decisions in Burkina Faso”. Economic Development and Cultural Change 61 (1): 157–186.
Ali, Ali Abdel Gadir et al. 2000. “Can Africa claim the 21st century?” World Bank Group. Angold, Adrian et al. 1987. “Parent and child reports of depressive symptoms in children at low
and high risk of depression”. Journal of Child Psychology and Psychiatry 28 (6): 901–915. Appadurai, Arjun. 2004. “The capacity to aspire”. Culture and public action : 59–84.
Arnold, David H et al. 2008. “Parent involvement in preschool: Predictors and the relation of involvement to preliteracy development”. School psychology review 37 (1): 74.
Barnard, Wendy Miedel. 2004. “Parent involvement in elementary school and educational attain-ment”. 26 (1): 39–62.
Batista, Catia, Tara McIndoe Calder, and Pedro Vicente. 2013. “Return migration, self-selection and entrepreneurship in mozambique”.
Becker, Gary Stanley. 1995. Human capital and poverty alleviation. World Bank, Human Re-sources Development and Operations Policy.
Beine, Michel, Frederic Docquier, and Hillel Rapoport. 2008. “Brain drain and human capital formation in developing countries: winners and losers”. The Economic Journal 118 (528): 631–652.
Böhme, Marcus H. 2015. “Migration and educational aspirations–Another channel of brain gain?” IZA Journal of Migration 4 (1): 12.
Brooke, James. 1987. “Angolans flee both sides in civil war”. The New York Times.
Dauber, Susan L and Joyce L Epstein. 1993. “Parents’ attitudes and practices of involvement in inner-city elementary and middle schools”. Families and schools in a pluralistic society : 53–71.
Epstein, Joyce L and Lori J Connors. 1992. “School and family partnerships.” Practitioner 18 (4): n4.
Fan, Xitao and Michael Chen. 2001. “Parental involvement and students’ academic achievement: A meta-analysis”. Educational psychology review 13 (1): 1–22.
Filmer, Deon and Lant H Pritchett. 2001. “Estimating wealth effects without expenditure data—or tears: an application to educational enrollments in states of India”. Demography 38 (1): 115– 132.
European Comission. 2004. “Humanitarian aid to facilitate the repatriation to Angola of Angolan refugees in Zambia”.
World Factbook. 2010. “The world factbook”. See also: https://www. cia. gov/library/publications/the-world-factbook.
Grolnick, Wendy S et al. 1997. “Predictors of parent involvement in children’s schooling.” Journal of educational psychology 89 (3): 538.
Halle, Tamara G, Beth Kurtz-Costes, and Joseph L Mahoney. 1997. “Family influences on school achievement in low-income, African American children.” Journal of Educational Psychology 89 (3): 527.
Hawkins, Daniel N, Paul R Amato, and Valarie King. 2006. “Parent-adolescent involvement: The relative influence of parent gender and residence”. Journal of Marriage and Family 68 (1): 125–136.
Hill, Nancy E et al. 2004. “Parent academic involvement as related to school behavior, achieve-ment, and aspirations: Demographic variations across adolescence”. Child development 75 (5): 1491–1509.
Kandel, William and Grace Kao. 2001. “The impact of temporary labor migration on Mexican children’s educational aspirations and performance”. International Migration Review 35 (4): 1205–1231.
Kandel, William and Douglas S Massey. 2002. “The culture of Mexican migration: A theoretical and empirical analysis”. Social forces 80 (3): 981–1004.
Keith, Timothy Z et al. 1993. “Does parental involvement affect eighth-grade student achievement? Structural analysis of national data.” School psychology review.
Kling, Jeffrey R, Jeffrey B Liebman, and Lawrence F Katz. 2007. “Experimental analysis of neighborhood effects”. Econometrica 75 (1): 83–119.
Kohl, Gwynne O, Liliana J Lengua, Robert J McMahon, et al. 2000. “Parent involvement in school conceptualizing multiple dimensions and their relations with family and demographic risk factors”. Journal of school psychology 38 (6): 501–523.
Lee, Jung-Sook and Natasha K Bowen. 2006. “Parent involvement, cultural capital, and the achievement gap among elementary school children”. American educational research journal 43 (2): 193–218.
Macours, Karen and Renos Vakis. 2014. “Changing households’ investment behaviour through social interactions with local leaders: Evidence from a randomised transfer programme”. The Economic Journal 124 (576): 607–633.
Muris, Peter et al. 1998. “The screen for child anxiety related emotional disorders (SCARED) and traditional childhood anxiety measures”. Journal of Behavior Therapy and Experimental Psychiatry 29 (4): 327–339.
Oketch, Moses, Maurice Mutisya, and Jackline Sagwe. 2012. “Parental aspirations for their children’s educational attainment and the realisation of universal primary education (UPE) in Kenya: Evidence from slum and non-slum residences”. International Journal of Educational Development 32 (6): 764–772.
Pleck, Joseph H and Sandra L Hofferth. 2008. “Mother involvement as an influence on father involvement with early adolescents”. Fathering 6 (3): 267.
Schoon, Ingrid, Peter Martin, and Andy Ross. 2007. “Career transitions in times of social change. His and her story”. Journal of Vocational Behavior 70 (1): 78–96.
Sheridan, Jennifer. 2001. The Effects of Parent’s Unrealized Educational Aspirations on Children’s Educational Outcomes. Center for Demography and Ecology, University of Wisconsin. Singh, Kusum et al. 1995. “The Effects of Four Components of Parental Involvement on
Eighth-grade Student Achievement: Structural Analysis of NELS-88 Data.” School psychology review 24 (2): 299–317.
Slaughter, Diana T et al. 1989. “Who gets involved? Head Start mothers as persons”. The Journal of Negro Education 58 (1): 16–29.
Stark, Oded, Christian Helmenstein, and Alexia Prskawetz. 1997. “A brain gain with a brain drain”. Economics letters 55 (2): 227–234.
Thabet, Abdel Aziz et al. 2008. “Exposure to war trauma and PTSD among parents and children in the Gaza strip”. European Child & Adolescent Psychiatry 17 (4): 191.
UNHCR. 2011. “Donor Update: Voluntary Repatriation of Angolan Refugees”.
Witvliet, Miranda et al. 2010. “Early adolescent depressive symptoms: Prediction from clique isolation, loneliness, and perceived social acceptance”. Journal of abnormal child psychology 38 (8): 1045–1056.
Zhang, Yuping, Grace Kao, and Emily Hannum. 2007. “Do mothers in rural China practice gender equality in educational aspirations for their children?” Comparative Education Review 51 (2): 131–157.
A
Appendix
Table 6: Parent involvement and child depression indicators
Measured Variable Item Used and Coding
Parent Involvement Indicators
Parental Aspirations Options for parent educational aspirations included: "I would like him/her not to
complete primary school"; "I would like him/her to complete primary school"; "I would like him/her to complete 9thgrade"; "I would like him/her to complete high shool"; "I would like him/her to complete a college degree"; "I would like him/her to complete a masters degree"; "I would like him/her to complete a PhD". Each educational level was associated with an underlying numerical scale, following the Angolan educational system. To avoid loss of information, this variable is treated as continuous instead of being standardized.
Parent-Child Communication Respondents were asked how often they did the following activities with the child who gave them the invitation (coded 1 if "Never/Almost never", 2 if "Once or twice a month", 3 if "Once or twice a week", and 4 if "Everyday/Almost ev-eryday"): Read books with him/her; discuss about his/her school performance; talk about the possibility of him/her attending university; discuss with him/her political and social issues; use the computer to search together school-related topics; use the computer to search together university-related topics.
School Contact Respondents were asked how often they met with the director or professor of
the child who gave them the invitation to discuss his/her school performance in the last academic year (coded 0 if "Never met with either one", 1 if "Once a year", 2 if "Once every six months", 3 if "Once every three months", 4 if "Once of twice a month", and 5 if "Every week").
Home Supervision Respondents were asked how often they assist the child who gave them the invitation with homework (coded 1 if "Never/Almost never", 2 if "Once or twice a month", 3 if "Once or twice a week", and 4 if "Everyday/Almost everyday").
Child Depression, Anxiety and Stress Indicators
Respondents were asked on the veracity of the following sentences, based on his child’s behavior in the last six months (coded 1 if "Not true", 2 if "Somewhat true", 3 if "Not true"): "He/She tends to isolate himself/herself, prefers to play alone"; "He/She has many worries, seems always worried"; "He/She is many times sad, depressed or tearful"; "In new situations, he/she is apprehensive, very clingy and unsure"; "He/She gets better along with adults than children".
Wealth Index Household assets were obtained by asking whether the recruited respondent
owned any of the following: books, radio, tv, computer, tablet, internet, digital camera, smartphone, phone, bike, motorbike, car, washing machine, freezer, stove, and house. Variables were first dichotomized to indicate the ownership of each household asset. The principal components analysis identified four factors with eigenvalues greater than 1, with the first factor accounting for 25.2% of the variance. The PCA score was then categorized into wealth quartiles.
Table 7: Summary statistics for first principal component
Scoring Factors Mean SD Scoring Factor x SD
Book 0.290 0.835 0.372 0.108 Radio 0.302 0.731 0.443 0.134 Television 0.289 0.939 0.239 0.069 Computer 0.318 0.471 0.499 0.159 Tablet 0.234 0.204 0.403 0.094 Internet 0.262 0.260 0.439 0.115 Camera 0.194 0.135 0.342 0.066 Smartphone 0.290 0.694 0.461 0.134 Phone 0.103 0.733 0.443 0.045 Bicicle 0.180 0.176 0.381 0.069 Motor Bike 0.050 0.066 0.248 0.012 Car 0.258 0.402 0.491 0.127 Washing Machine 0.293 0.718 0.450 0.132 Fridge 0.298 0.694 0.461 0.137 Stove 0.302 0.940 0.237 0.072 House 0.132 0.577 0.494 0.065 Wealth Index 0 2.007
Note: Each variable takes the value of 1 if the recruited respondent owns the asset, and 0 if otherwise.
Scor-ing factor is the "weight" attributed to each variable (normalized by its mean and standard deviation) and corresponds to the linear combination of the variables of the very first component. The first factor accounts for 25.2% of the variance. The first eigen value is 4.03, and the second is 1.74.
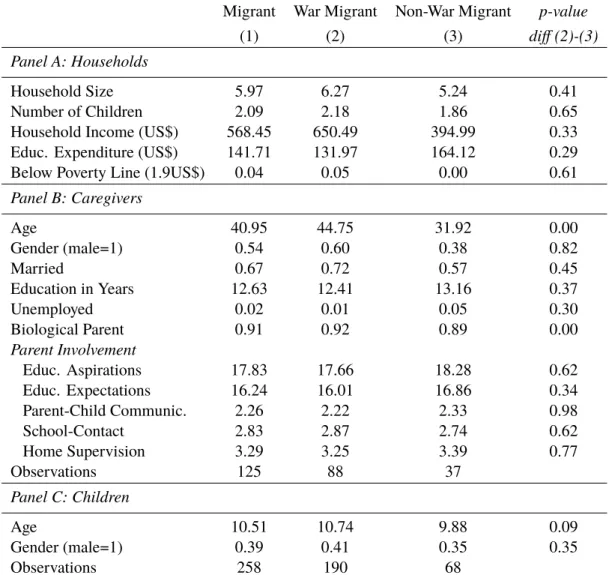
Table 8: Descriptive statistics (returned migrants)
Migrant War Migrant Non-War Migrant p-value
(1) (2) (3) diff (2)-(3)
Panel A: Households
Household Size 5.97 6.27 5.24 0.41
Number of Children 2.09 2.18 1.86 0.65
Household Income (US$) 568.45 650.49 394.99 0.33
Educ. Expenditure (US$) 141.71 131.97 164.12 0.29
Below Poverty Line (1.9US$) 0.04 0.05 0.00 0.61
Panel B: Caregivers Age 40.95 44.75 31.92 0.00 Gender (male=1) 0.54 0.60 0.38 0.82 Married 0.67 0.72 0.57 0.45 Education in Years 12.63 12.41 13.16 0.37 Unemployed 0.02 0.01 0.05 0.30 Biological Parent 0.91 0.92 0.89 0.00 Parent Involvement Educ. Aspirations 17.83 17.66 18.28 0.62 Educ. Expectations 16.24 16.01 16.86 0.34 Parent-Child Communic. 2.26 2.22 2.33 0.98 School-Contact 2.83 2.87 2.74 0.62 Home Supervision 3.29 3.25 3.39 0.77 Observations 125 88 37 Panel C: Children Age 10.51 10.74 9.88 0.09 Gender (male=1) 0.39 0.41 0.35 0.35 Observations 258 190 68
Note: Calculations based on the version employed after the 3r dschool (remaining version excluded). Answers "Don’t know" and "Refused to answer" dropped. Observations might deviate due to missing values. War Migrant refers to recruited respon-dents who have migrated in the past and are above the median percentage of time lived under a state of civil war (i.e., 81%). Two-tailed t-tests with standard errors clustered at the school level. For simplistic reasons, parent involvement dimensions (apart from aspirations and expectations) are presented as summary indices before z-score standardization.
Table 9: Descriptive statistics
81% ≤ War Time > 81% War Time Difference p-value Panel A: Households
Household Size 8.45 6.97 1.48 0.63
Number of Children 1.98 2.24 -0.26 0.17
Household Income (US$) 294.24 427.70 -133.45 0.42
Educ. Expenditure (US$) 112.42 115.92 -3.50 0.36
Below Poverty Line (1.9US$) 0.06 0.06 -0.00 0.06
West 0.56 0.56 -0.01 0.95 Panel B: Caregivers Age 30.77 45.41 -14.64 0.00 Gender (male=1) 0.37 0.50 -0.13 0.07 Married 0.48 0.66 -0.17 0.01 Unemployed 0.08 0.06 0.02 0.87 Education in Years 11.44 10.87 0.58 0.21
Education in Years (Spouse) 11.64 10.99 0.65 0.43
Migration Experience Migrant 0.09 0.20 -0.11 0.07 Developed Country 0.03 0.06 -0.03 0.54 Parent Involvement Educ. Aspirations 17.70 17.75 -0.04 0.37 Educ. Expectations 16.16 16.14 0.02 0.37 Parent-Child Communic. 2.13 2.12 0.00 0.45 School-Contact 2.89 2.96 -0.08 0.43 Home Supervision 3.22 3.23 -0.01 0.93 Observations 394 429 Panel C: Children Age 10.38 11.05 -0.67 0.02 Gender (male=1) 0.38 0.37 0.01 0.82 Depression Index 0.58 0.55 0.03 0.50 Observations 772 950
Note: Calculations based on the version employed after the 3r dschool (remaining version excluded). Answers "Don’t know" and "Refused to answer" dropped. Observations might deviate due to missing values. 81% corresponds to the median time lived during civil war. Two-tailed t-tests with standard errors clustered at the school level. For simplistic reasons, parent involvement dimensions (apart from aspirations and expectations) are presented as summary indices before z-score standardization.
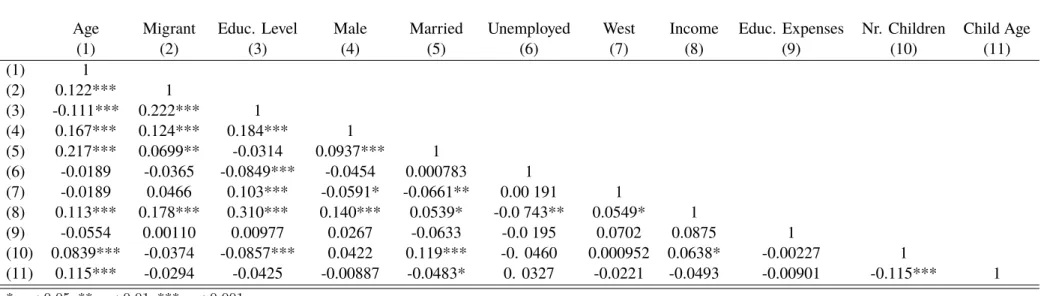
Table 10: Correlation matrix
Age Migrant Educ. Level Male Married Unemployed West Income Educ. Expenses Nr. Children Child Age
(1) (2) (3) (4) (5) (6) (7) (8) (9) (10) (11) (1) 1 (2) 0.122*** 1 (3) -0.111*** 0.222*** 1 (4) 0.167*** 0.124*** 0.184*** 1 (5) 0.217*** 0.0699** -0.0314 0.0937*** 1 (6) -0.0189 -0.0365 -0.0849*** -0.0454 0.000783 1 (7) -0.0189 0.0466 0.103*** -0.0591* -0.0661** 0.00 191 1 (8) 0.113*** 0.178*** 0.310*** 0.140*** 0.0539* -0.0 743** 0.0549* 1 (9) -0.0554 0.00110 0.00977 0.0267 -0.0633 -0.0 195 0.0702 0.0875 1 (10) 0.0839*** -0.0374 -0.0857*** 0.0422 0.119*** -0. 0460 0.000952 0.0638* -0.00227 1 (11) 0.115*** -0.0294 -0.0425 -0.00887 -0.0483* 0. 0327 -0.0221 -0.0493 -0.00901 -0.115*** 1 * p < 0.05, ** p < 0.01, *** p < 0.001 31
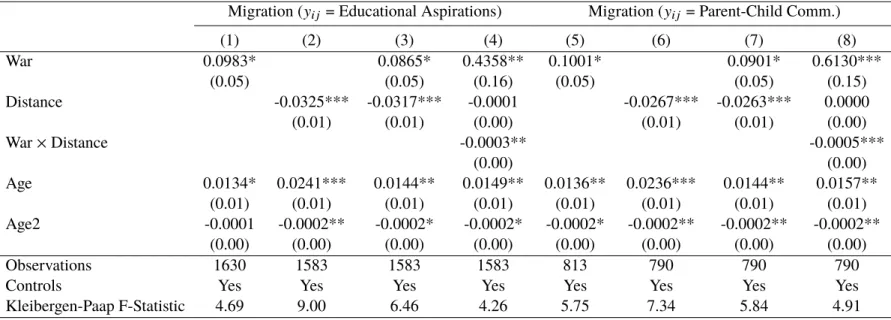
Table 11: First-stage regressions
Migration (yi j = Educational Aspirations) Migration (yi j= Parent-Child Comm.)
(1) (2) (3) (4) (5) (6) (7) (8) War 0.0983* 0.0865* 0.4358** 0.1001* 0.0901* 0.6130*** (0.05) (0.05) (0.16) (0.05) (0.05) (0.15) Distance -0.0325*** -0.0317*** -0.0001 -0.0267*** -0.0263*** 0.0000 (0.01) (0.01) (0.00) (0.01) (0.01) (0.00) War × Distance -0.0003** -0.0005*** (0.00) (0.00) Age 0.0134* 0.0241*** 0.0144** 0.0149** 0.0136** 0.0236*** 0.0144** 0.0157** (0.01) (0.01) (0.01) (0.01) (0.01) (0.01) (0.01) (0.01) Age2 -0.0001 -0.0002** -0.0002* -0.0002* -0.0002* -0.0002** -0.0002** -0.0002** (0.00) (0.00) (0.00) (0.00) (0.00) (0.00) (0.00) (0.00) Observations 1630 1583 1583 1583 813 790 790 790
Controls Yes Yes Yes Yes Yes Yes Yes Yes
Kleibergen-Paap F-Statistic 4.69 9.00 6.46 4.26 5.75 7.34 5.84 4.91
Note: * p<0.10, ** p<0.05, *** p<0.01. IV set War: Median percentage of lifetime during civil war. IV set Distance: Distance between birth residence and closest refugee camp. Controlling
also in all specifications for level of education, gender of respondent and child, civil status, unemployment, neighborhood, wealth index and household composition; child age dummies included. Standard errors clustered at the school level in parenthesis.