(How) Do Non-Cognitive
Skills Programs Improve
Adolescent School
Achievement?
Experimental Evidence
Pedro S. Martins
Working Paper
# 614
2017
(How) Do Non-Cognitive Skills Programs Improve Adolescent
School Achievement? Experimental Evidence
∗Pedro S. Martins†
Queen Mary University of London & NovaSBE & IZA
August 14, 2017
Abstract
Non-cognitive skills programs may be an important policy option to improve the aca-demic outcomes of adolescents. In this paper, we evaluate experimentally the EPIS pro-gram, which is based on bi-weekly individual or small-group non-cognitive mediation short meetings with low-performing students. Our RCT estimates, covering nearly 3,000 7th-and 8th-grade students across over 50 schools 7th-and a period of two years, indicate that the program increases the probability of progression by 11% to 22%. The effects are stronger amongst older students, girls, and in language subjects (compared to maths).
Keywords: Student achievement, Non-cognitive skills, RCT, Gender. JEL Codes: I20, I24, J08.
∗
I thank Ana Balc˜ao Reis, Nuno Crato and participants at a seminar in Queen Mary University of London and the EPIS 2017 conference for comments, Diogo Sim˜oes Pereira and Andreia Jaqueta Ferreira for many discussions, and Bruno Leal for information about the data.
†
Email: [email protected]. Address: School of Business and Management, Queen Mary, Univer-sity of London, Mile End Road, London E1 4NS, United Kingdom. Phone: +44/0 2078827472. Web: http://webspace.qmul.ac.uk/pmartins.
1
Introduction
Low achievement levels at basic schooling can have significant negative effects upon one’s hu-man capital, labour market outcomes, and children (Heckhu-man & Carneiro 2003, Black & Dev-ereux 2011). From a macroeconomic perspective, economic growth can also suffer greatly from low (and low quality) schooling achievement (Krueger & Lindahl 2001, Hanushek et al. 2015). A number of programs have consequently been launched by governments around the world to enhance the outcomes of those at the bottom of the schooling achievement distribution, in particular in the case of socially disadvantaged pupils. These programs typically involve some form of remedial education, based on additional tuition, revision sessions, computer-aided learning, etc. However, the causal effects of many of these programs have been shown to be very disparate, including cases of large effects (Lavy & Schlosser 2005, Dobbie & Fryer 2011, Cortes et al. 2015), small effects (Machin et al. 2004), mixed findings (Jacob & Lefgren 2004, Taylor 2014), or insignificant (Leuven et al. 2007). Similar varied findings have been obtained for the case of developing countries (Glewwe & Kremer 2006, Banerjee et al. 2007).
While all programs above focus on cognitive skills (e.g. revising class room material), economists have over the last few years devoted more attention to the potential of a non-cognitive approach (Heckman & Rubinstein 2001, Heckman et al. 2006). In fact, such harder to measure aspects of one’s profile - motivation, discipline, tenacity, self-esteem, self-control, confidence, patience, etc - may be equally important in shaping one’s success at school and beyond. In this context, school interventions based on non-cognitive skills may be at least as - or even more - effective than the more traditional remedial programs, as the ones listed above. As argued by Heckman & Kautz (2012), ‘soft skills causally produce success in life’, so that ’programs that enhance soft skills have an important place in an effective portfolio of public policies’. Moreover, as the relative payoff of investments in hard and soft skills tends to tilt towards the latter with age (Heckman & Cunha 2007), despite their substitutability and complementarity, adolescence may be a key juncture when non-cognitive interventions can lead to better outcomes.
This paper sheds empirical light on these issues as one of the first to evaluate experi-mentally the effects of a large soft-skills program for adolescents (see Kautz et al. (2014) for a description of the existing literature). Moreover, we also investigate on the mechanisms behind such effects, in particular the role played by the individuals that deliver the program.
We consider the case of EPIS, a large program that seeks to improve student achievement and reduce grade retention and early school leaving of lower-secondary students in Portugal by strengthening their non-cognitive skills. On top of the emphasis placed on non-cognitive skills, EPIS is also original due to its rigorous screening of all potential student participants. Such screening ensures that the resources invested by the program - mostly the time of the staff (mediators) that conduct the interventions, typically based on a number of 20-minute small-group or one-to-one sessions with selected students, every two or three weeks during term time - are spent exclusively on the youngsters that are likely to need the support the most. Indeed, although many remedial education programs have been shown to have small or insignificant effects, ‘inputs specifically targeted to helping weaker students may be effec-tive’, in particular ‘if they address specific unmet needs in the school’ (Banerjee et al. 2007). Although such screening typically raises challenges in the identification of the causal effects, here we draw on evidence from a randomised controlled trial, launched in 2014, and driven by restrictions in the number of staff available in a large number of participating schools. By selecting randomly the students that participate out of all those who are eligible following the screening process, we are able to establish a rigorous counterfactual in the impact of interest. We also complement our earlier quasi-experimental evidence, that considers a different set of schools and the 2007-09 period (Martins 2017).
Our RCT results indicate that, unlike many remedial programs, an intervention based on non-cognitive interventions such as EPIS can have a significant positive effect in improving the school achievement levels of the treated students. According to our findings, the probability that a student has a satisfactory performance over a period of two years (defined here as no retention over the period) increases by 5 to 10 percentage points or, equivalently, by 11 to 22 percent. However, we also find that the effects of the program on specific modules that may be more intensive in cognitive skills (e.g. maths) tend to be smaller, even if still significant in some specifications. This latter result may highlight the limitations of an approach based almost entirely on non-cognitive skills; it may also reconcile our results with those of the only other large and recent case-study of non-cognitive skills for adolescents we are aware of (Holmlund & Silva 2014), which find insignificant results in a quasi-experimental analysis.
We also provide evidence on the mechanisms behind the emergence of these effects, results which may also be relevant for the improvement of this and other programs. For instance, the
program is also more successful in languages than in maths, perhaps because of the stronger cognitive content of the latter subject, and that girls and older students tend to benefit more. We also find that a range of mediator characteristics that we consider do not appear to make a significant difference. While the gender matching of the mediators and the students initially appears to matter (Dee 2007, Antecol et al. 2015), this is largely driven by the facts that most mediators are women and that girls tend to benefit more from the non-cognitive intervention delivered by EPIS.
The structure of the remainer of the paper is as follows: Section 2 describes the main characteristics of the program studied in the paper and its institutional context. Section 3 presents the matched school-student panel data set used here and a number of descriptive statistics. Section 4 describes the main results and several robustness checks and extensions. Finally, Section 5 concludes.
2
The EPIS program
The main goals of the EPIS program are to reduce early school leaving and to promote student achievement.1 These are important policy goals in many countries, including in Portugal, where at the time when the program was introduced, 2007, 39.1% of 18-24 year olds had at most a lower secondary school degree and were not enrolled in any training. This was related to the high levels of grade retention rates (the percentage of students not allowed to progress to the following grade at the end of the school year due to low achievement), of about 15% in each of the three years of the lower secondary cycle (7th, 8th, and 9th grades).
The goals of program are pursued through an original intervention in that EPIS aims to strengthen the non-cognitive skills of students - in striking opposition to a more standard remedial approach, based on cognitive skills. As mentioned before, there is growing awareness about the potential effects of such non-cognitive skills - motivation, discipline, tenacity, self-esteem, self-control, confidence, patience, etc - in terms of different socio-economic outcomes (Heckman & Rubinstein 2001, Heckman et al. 2006) but also evidence that the effects of these programs in terms of student achievement may be poor (Holmlund & Silva 2014).
From a practical point of view, one important dimension of the EPIS program is its
1
The program’s name is ‘Mediators for school success’. However, we refer to the program using the name of the organisation that is responsible for it (EPIS, ’Entrepreneurs for Social Inclusion’), a private, not-for-profit body, established in 2006.
adoption of a targeted approach. Specifically, EPIS spends considerable effort in identifying the 7th- and 8th-grade pupils (typically 13-15 year-olds) most at risk of failing their year and or dropping out. This process involves at least two rounds of screening that take place at the beginning of the school year (first term), first when students are interviewed individually by EPIS staff, and second through a number of meetings of EPIS staff (mediators) with teachers, headteachers and parents for further information about the students. A detailed questionnaire is applied to each student, which leads to the assignment of the student to one of three different levels of students’ low achievement and potential drop out likelihood. Students that are in the highest risk group (in terms of low achievement) are then assigned to the program (on average about one third of all 7th and 8th grade students in each school). Students that are in the intermediate group are referred to their teachers for further monitoring. The remaining group of students are disregarded by the program, except that their grades are also recorded, up to their graduation from lower secondary school (9th grade) or when they leave school (whichever the earliest).
Once the students’ parents agree on the participation of their children in the program (which approximately 95% do), then a mediator and a specific set of interventions is assigned to each student. The specific context of each intervention will depend on the individual non-cognitive, behavioral or other issues that are flagged during the screening process. The interventions will be based on individual techniques (motivational discussions, self-control, problem-solving techniques) or group techniques (study methods, social competences training, management of criticism, anxiety self-control), depending on the individual assessment of each student. These meetings typically start in the second term, following the screening stage that takes place in the first term, and last for one or more years.
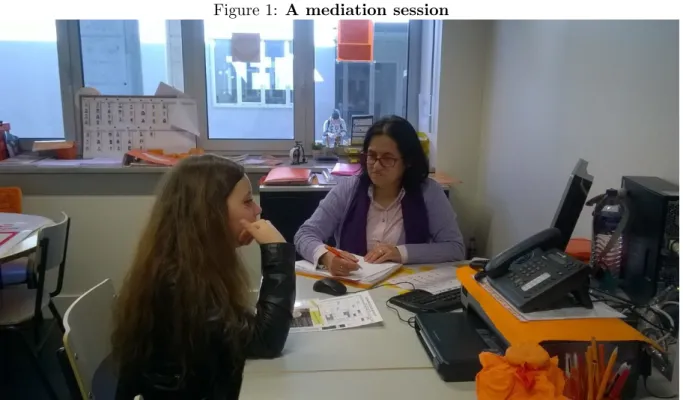
These one-to-one or small-group interventions are delivered by EPIS staff (mediators) that work full- or part-time in the program and are based permanently at the participating schools for the duration of the intervention (see Figure 1 for an illustration of a one-to-one session in progress in a participating school). EPIS staff also seek to keep in frequent contact with the parents or other relatives and teachers of the participating students and, in some cases, their local councils, to monitor the progress of each intervention pupil as closely as possible. In fact, EPIS staff not only meet their students individually or in very small groups but they also do so on a relatively frequent basis (e.g., every two weeks). Many such staff are young
graduates in psychology or education sciences; in the case of the schools which we evaluate in this paper, the program is delivered by tenured teachers that have reduced teaching duties on account of demographic reasons.
During the first meetings, staff and students agree on goals with respect to each student’s future performance in school. Meetings typically do not overlap with classes, in particular in the core subjects of Maths and Portuguese, so to minimise negative effects on class attendance. Furthermore, the program seeks to promote a stable mediator-student relationship, as that can strengthen the effect of the intervention, given its non-cognitive nature and individualised approach. Over the period and sample studied here, there are 57 EPIS staff working in 53 schools. Each full-time mediator holds a portfolio of approximately 60 students, typically in one school only. Part-time mediators will have the size of their portfolio reduced on a proportional basis. All mediators also take part in several training sessions before they are allocated to schools and during the program.2
On an administrative level, the program’s funding comes from approximately 100 large companies and organisations based in Portugal, each paying an annual contribution of 15,000 euros, in the context of their corporate social responsibility activities. (A small share of these funds are spent on additional initiatives, including traineeships, scholarships, and a training program for lower primary teachers.) In addition, a scientific council formed by academic experts in education, psychology and economics contributed towards the design of the program studied here, also meeting regularly to offer comments and suggestions to senior EPIS staff.3 The Ministry of Education and the local councils where the interventions are taking place also offer additional, generally non-financial support, namely in terms of facilitating coordination with headteachers and providing facilities and program staff at schools (the latter only in a number of cases, including the part of the program studied here). Indeed, in our evaluation, all mediators are teachers in the schools where the interventions take place. However, none of the mediators is also a teacher of the students they mediate.
2
See Pereira et al. (2008) for detailed information about the program, in particular the psychological contents of the interventions conducted in one-to-one or small-group meetings, and Martins (2017), which studies an earlier period of this program, drawing on quasi-experimental evidence and also provides an overview of the education system of Portugal. See also http://www.epis.pt (in Portuguese) for more detail about the program and data access.
3
The author has been an unpaid member of this scientific council since its inception, in 2006, and its president since 2014.
3
Data and descriptive statistics
The EPIS program adopted a sophisticated IT system that keeps detailed longitudinal records of students. In particular, all students from each school that takes part in the program have individual records with EPIS, including those that are not subject to the interventions, provided they are also enrolled in the 7th or 8th grades. Most information, including the students’ grades, is recorded for every one of the three terms per school year (September to December, January to March, and April to June). The data include several demographic variables about each student, such as gender and age, and different profile characteristics, in particular a number of proxies of socio-economic or psychological issues that may affect progression. Interviews with teachers result in additional information from previous school years of each student, including about potential earlier spells of retention. As all information is longitudinal, we create a matched multilevel panel, covering the student, the class (group of students that take the modules together during each school year), the EPIS mediator, and the school, with unique and time-invariant identifiers for each one of those four levels. Moreover, we also consider information on the meetings of the mediators with the students.
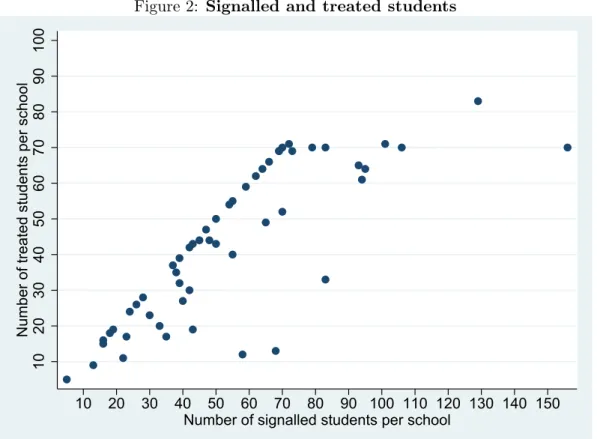
The randomised controlled trial conducted in this paper is based on a group of 53 schools followed over two school years, 2014/15 and 2015/16. As indicated above, these schools partic-ipated in the program following a partnership between EPIS and the Ministry (Department) of Education. Under this partnership, the Ministry of Education determined that a number of teachers whose teaching loads were not fully used should devote all or some of their available teaching time to the program, as EPIS mediators. However, in most cases, the number of teachers available - and the corresponding number of students that can be supported through their participation, on a basis of around 60 students per full-time teacher/mediator adopted by the program across the country - fell short of the number of students signalled as being in risk of low achievement or retention following the screening process conducted by EPIS at the beginning of the school year. This mismatch between resources and needs is described in Figure 2, which presents the number of signalled and treated students per school. The figure displays a set of (21) schools along a diagonal line that corresponds to cases in which available resources (teacher/mediator time) were enough to meet intervention needs. The figure also display non-diagonal schools, in which resources fell short of needs. The latter case corresponds to over two thirds of all, nearly 3,000, signalled students, and to 32 schools.
Given the above, our randomisation was conducted across the latter group of non-diagonal schools and their students, at the level of the school. Across all signalled students, in each school, we selected randomly those that could be supported given the mediator resources available. In some cases, namely in the 21 schools mentioned above, all signalled students were assigned to receive the intervention. In other cases, only 50% or less of the students did so. Moreover, as the randomisation was conducted at the school level, the number of treated students can also vary across classes within a school.
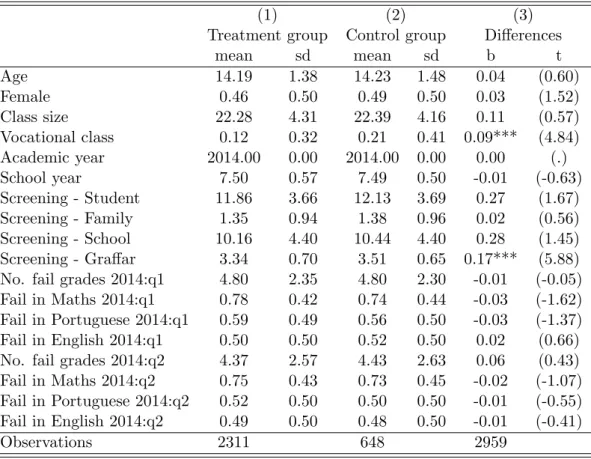
Table 1 presents descriptive statistics about the resulting treatment and control groups, composed of 2,311 and 648 students, respectively, and measured in the first term of the 2014/15 academic year (i.e. just before the interventions start, typically in March 2015). Focusing on the case of the treatment group, the students’ average age is 14, 46% are girls, the average class size is 22 and 12% of the students are in vocational classes (which have a more practical-oriented curriculum). The average school year is 7.5, indicating that half of the group is in the 7th grade and the remaining half is in the 8th grade.
A number of screening indicators is also presented, as well as a number of measures of student achievement, namely the number of fail grades in the first and second terms of 2014/15 as well as the specific (pass or fail) grades in the core subjects of maths, Portuguese and English. Out the twelve modules in which students are enrolled in both the 7th and 8th grade, we find that the students in the treatment group fail an average of 4.8 in the first term and 4.4. in the second term. These are very large numbers of fails, in particular given that, in general, students are retained (i.e. cannot progress) when they fail three or more modules in the third and final term of the year. Moreover, the assessment in the third term is supposed to reflect not only the student’s performance in that term but also the overall performance across the three terms. This implies that poor performance in the first and second terms will already create a (very) negative outlook for the final and decisive term in that year. In addition, when considering the key modules of maths, Portuguese and English, one finds that the performance of the students in the treatment group is also particularly poor, especially in maths, in which three quarters or more of the students fail.
One final but critical point in the table concerns the comparison between the character-istics of the treatment group and the control group. As expected given the randomisation of assignment, these characteristics are equal from a statistical perspective along most
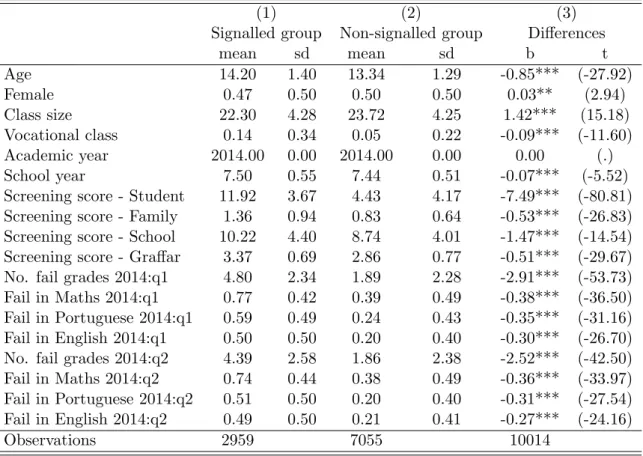
dimen-sions considered in the table. However, note that here the comparisons are conducted across the two groups in general whereas the randomisation was conducted within schools. Indeed, when considering each variable in turn in a regression with school fixed effects (the dimension at which the randomisation was conducted) we again find virtually no cases of statistically significant differences between treatment and control groups (results available upon request). We now turn to Table 2, which presents a similar comparison but between the signalled group of students (which corresponds to students in either the control or treatment groups) and the non-signalled students (i.e. those that are deemed to have relatively good prospects of achievement, following the same screening process conducted by EPIS mediators across all students in the participating schools). Although the latter are not considered in the main analysis in this paper, it is important to highlight the differences between the two groups, given the selection focus of the program. In striking contrast to the previous table, the comparison now indicates very marked and significant differences in virtually all variables. For instance, non-signalled students are nearly one year younger than their signalled counterparts. Non-signalled students are also in larger classes, with 23.7 students on average (compared to 22.3 in the case of signalled students) and less likely to be in vocational groups.Even more striking differences are observed in the screening scores and the indicators of student achievement. Focusing on the latter variables, where in the case of signalled students the average number of fail marks is 4.8, the equivalent number for non-signalled students is only 1.9. Where in the case of signalled students, 77% of them fail Maths, this percentage drops to 39% in the case of non-signalled students. Overall, these large differences in student characteristics including their school performance highlight the important of an experimental approach, to ensure one is able to focus exclusively on the role of the program and not of other observed or unobserved differences between treatment and control groups.
4
Results
We estimate the main effects of the EPIS program from student achievement equations, in the context of a linear probability model. Specifically, we estimate equations as follows:
in which, in most specifications, yi is a variable referring to student i that takes value
one if the student progressed over both the academic years 2014/15 and 2015/16 (i.e. if the student experienced no retention over those two academic years). Moreover, EP ISit is a
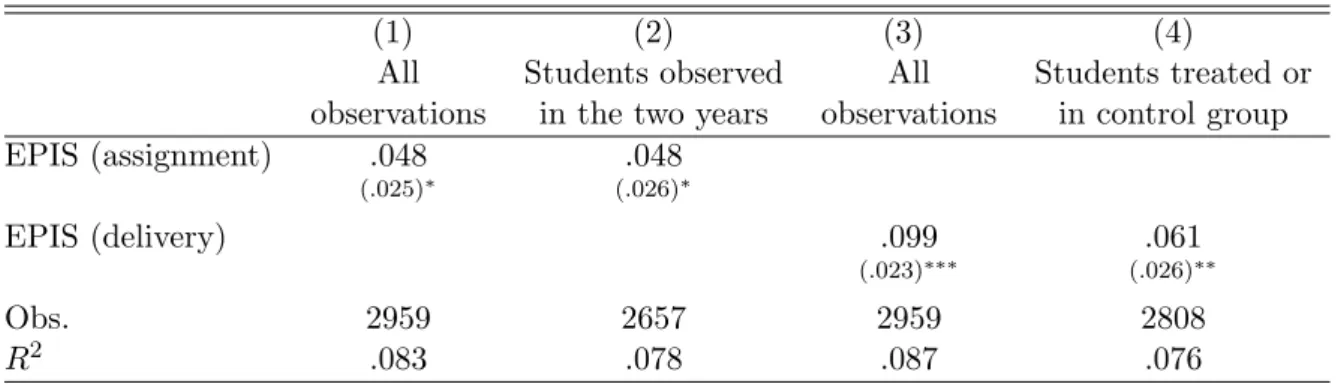
dummy variable equal to one if student i is assigned to the treatment group (intention to treat approach) or if the student participated in the program (following assignment), as explained below. Finally, α is a constant, γs(i) is a set of school fixed effects, the level at which the randomisation was conducted, as indicated above, corresponding to the school s of student i. Our main results are presented in Table 3, considering two alternative program indicator variables and three different samples, from specifications without any control variables other than the school fixed effects as in equation 1. In our main intention-to-treat estimates, we find that program assignment led to an increase in progression over the two years (from 2014/15 to 2015/16) of 4.8 percentage points (column 1). Given a reference probability of 45% of progression over the two years for the comparison group (eligible students that were not assigned to the program), this EPIS effect can be interpreted as an increase of 11% in the probability of progression. The coefficient is significant at the 10% level and almost at the 5% level (p-value of 6%). This result also holds when restricting the sample to students that are observed over the two-year period (column 2).
Table 3 also presents two complementary estimates, focused on program delivery, i.e. when we reassign from the treatment group the (151) treatment group students that, for a number of practical reasons, did not participate and move them either to the control group - column 3 - or that them out of the estimation sample - column 4. In these cases, the resulting estimates increase, to .099 or .061, and become significant at the 1% and 5% levels, respectively. In the case of the larger coefficient, the program has an effect of increasing progression by as much as 22% (.099/.45). Overall, these main experimental results indicate that the EPIS program has an important causal effect in terms of promoting student achievement, with effects of at least 11%, and of up to 22% in one specification.4
The following tables investigate the robustness of these main findings, considering different sets of control variables, different groups of students, different outcomes and, finally, the role of mediators. First, Table 4 presents a set of findings under the two EPIS variables (assignment
4These results cannot be strictly compared to our quasi-experimental evidence (Martins 2017) as the
lat-ter is based on a different specification, a different time period, and draws on different types of mediators. Keeping these caveats in mind, the experimental results appear to be stronger, more positive than their quasi-experimental counterparts.
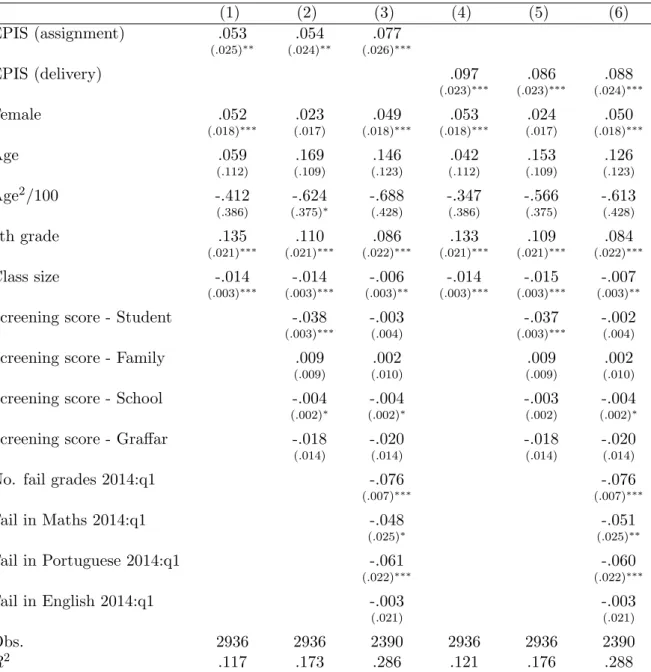
and delivery) and three sets of control variables. Here, we consider an extended model of equation 1, as follows:
yi = α + β1EP ISi+ Xi0β2+ γs(i)+ ui, (2)
in which X corresponds to different sets of control variables, including age, gender, class size, screening scores, and grades, and all other variables have the same definition as in equation 1.
Again, we find in all cases evidence of positive, large, and statistically significant results. These range between .053 and .077 in the case of the EPIS assignment variable and between .097 and .086 in the case of its delivery version. As expected under random assignment, while the magnitude of the EPIS coefficients is similar to the results of Table 3, the significance of the coefficients increases as we add regressors that help explain the outcome variable.
The coefficients of the control variables are of interest too, from the more general perspec-tive of the literature on the determinants of student achievement (Lazear 2001, 2003, Rivkin et al. 2005, Aaronson et al. 2007, Lavy 2009, Martins & Walker 2006). We find that girls have significantly better results, with effects of a magnitude similar to that of EPIS (in its assignment version), an issue that will be revisited at the end of the paper. Age (consid-ered using a quadratic specification) appears to have a moderate non-linear effect but the coefficients are in general not significant. Importantly, the progression probability is much higher for students in the 8th grade than their colleagues in the 7th grade, possibly because of the selection (grade retention) that takes place already in the 7th grade. Finally, class size appears to have a negative effect on student progression, with coefficients of about -1% per additional student. Taking the latter result at face value, i.e. ignoring any potential selection in class size, they imply that the EPIS program can be seen to be equivalent to a reduction of four to five students per class, in terms of their effects on the progression of the targeted students.
Finally, we consider the results of the screening variables (used for establishing eligibility, as described above) and that of student performance at the start of the program. We find that, as expected, the screening score is associated positively to a lower probability of progression, in particular its dimension related to the students themselves in contrast to the dimension rearding the family, the school and the region. However, most if not all screening score effects disappear when student performance variables are included (columns 3 and 6). This is to be
expected to some extent given that the screening scores are to a large extent based on the student’s past schooling achievement.It is also interesting to note the very strong effect of the number of failed modules in the first term of 2014/15 in explaining progression over that and the following academic year, with coefficients of -7.6% in both specifications. Moreover, we find that fails in Portuguese prove to be a stronger predictor of progression results than fails in Maths while fails in English have no predictive power at all. These differences across these three core modules may highlight the widely-used nature of the main language - good performance in Portuguese will be of help in all other modules - as well as the relatively smaller importance of maths, perhaps because of the widespread poor performance in this subject and resulting little variation in this indicator across students (recall the 77% fail percentage in the first term of 2014/15 for signalled students indicated in Table 2).
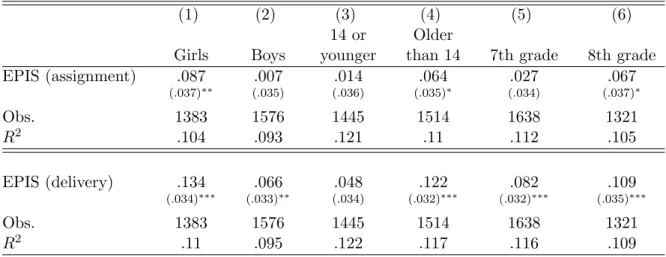
We now turn our attention to the potential differences in the effects of EPIS across different groups of students. This question is relevant not only from the perspective of the robustness of the findings but also in terms of understanding the mechanisms of the effects documented above. Tables 5 presents the results, considering three key dimensions of possible heterogene-ity in the impact of the program: gender, age and grade. Moreover, as before, we also consider the two types of program application (assignment and delivery), for the benefit of additional robustness. In the case of the gender dimension, we find consistent evidence that EPIS is of greater benefit to girls than boys. The contrast is particularly striking in the more conserva-tive assignment approach, in which the effect for girls increases to nearly 9 percentage points (significant at the 5% level) while the effect for boys become insignificant. When considering the case of delivery, the effect for boys is significant again and comparable to the benchmark estimates but the effects for girls nearly doubles to more than 13 percentage points.5 These gender findings may follow from the non-cognitive dimension of the intervention and its po-tential greater suitability for girls. Alternatively or complementarily, the stronger effects of EPIS amongst girls may be related to the gender of the mediator, which in most cases are women, an hypothesis we investigate below.
A second dimension that we analyse is age. Here we split our sample using the median value of 14 years, as measured in September 2014. We find that older students benefit more from EPIS, with significant coefficients of .064 (assignment variable) and .122 (delivery),
5
It is important to note that these gender-specific EPIS effects are in addition to the general gender differ-ences in student performance presented in Table 4, which already exhibit a significant independent head start for girls in progression perspectives.
contrasting to non-significant coefficients for younger students. Similarly, students that start their participation in the program in the 8th grade (when they will be older, in most cases) tend to benefit more from it (columns 5 and 6 of Table 5) - .067 vs .027, in the case of the assignment variable. These two sets of findings may indicate that the non-cognitive approach of EPIS is more suitable to older students. These findings also suggest that any expansion of the program towards different age ranges, if following similar intervention methodologies, would probably deliver better results if focused on upper secondary students than on their upper primary colleagues.
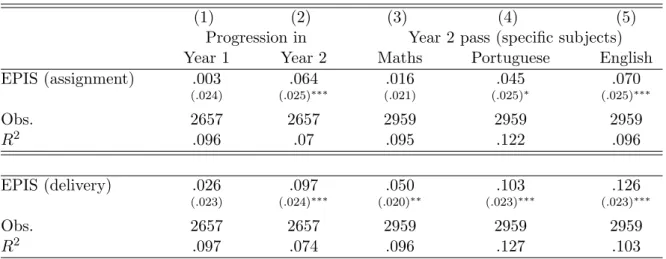
Our last robustness checks consider complementary outcomes variables to our benchmark measure of progression in both academic years (2014/15 and 2015/16). We now consider five alternative outcomes, presented in Table 6: progression in year 1 (2014/15), progression in year 2 (2015/16, independently of the outcome in year 1), and year 2 pass results in three modules - Maths, Portuguese and English. As before, we consider the two variants of the EPIS dummy variable (assignment and delivery). The results are, again, consistent across the specifications. They indicate that EPIS has a stronger impact on year 2 and that the impact in year 1 is generally negligible. This is consistent with the fact that the interventions only started in around March 2015 (i.e. three months before the end of the academic year) and the final grade of the year is determined also taking into account the performance over the entire year. Moreover, the impact of EPIS is stronger in English and Portuguese (the latter to a less extent), while the effect in Maths is either negligible or positive, depending on the version of the EPIS variable used, but in all cases smaller than in the cases of English and Portuguese. These findings may also highlight a relatively weak potential of non-cognitive interventions in improving achievement of ’harder’, cognitive-intensive subjects, such as Maths, compared to language subjects (see Cook et al. (2015) for an evaluation of a different type of program, delivering high-intensity individualized math tutoring). Our robustness findings also highlight the cumulative nature of the program, in the sense that a longer intervention is more likely to result in a stronger positive impact, unlike in the case of Hawthorne effects.
4.1 The role of the mediators
Besides providing a detailed analysis of the effects of EPIS, we are also interested in learning more about the ‘how’ dimension, i.e. about the specific drivers that explain the sucess of the
program. We have already contributed to this goal to some extent in the previous analyses, including through the consideration of different subgroups of students and different outcome variables. In this subsection we try to take this one step further by focusing on the specific contributions of mediators. They are, after all, a key part of the program, as they are ex-clusively responsible for the delivery of the interventions with the students. In particular, we consider a number of the mediators’ observable traits to understand if those aspects may play a role in the achievement of students and the effects of the EPIS intervention.
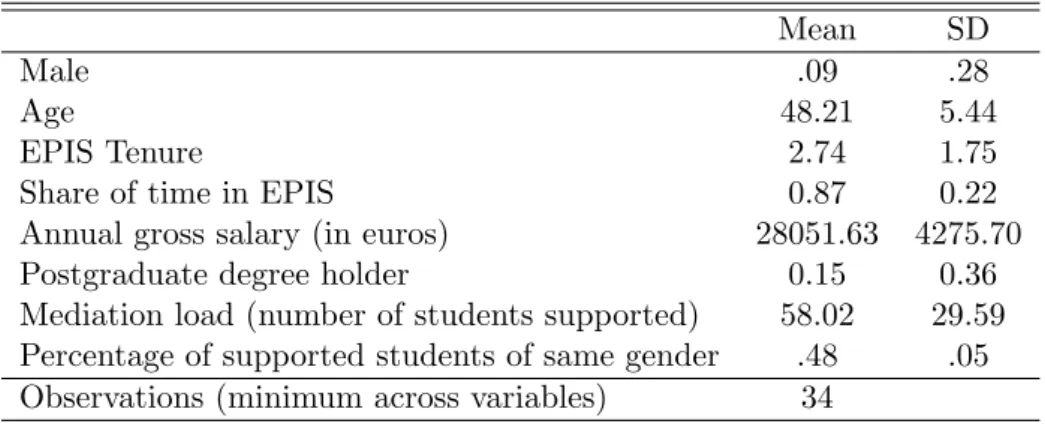
Table 7 presents descriptive statistics of the mediators, across the up to 51 mediators for which these data are available. We find that, in most cases, the mediators are women (91%). On average, they are 48 years old and have participated in the program for 2.7 years. The average percentage of their 40-hour weeks spent on EPIS (meetings with students plus related activities) is 87% (the remaining being spent on standard teaching activities). The annual salaries of the mediators (paid by the Ministry of Education) are 28,000 euros on average. 15% have a postgraduate diploma. Finally, their average mediation load is of 58 students. On average, 48% of their students are of the same gender. As indicated above, in almost all cases, a situation in which the mediator and the student will have the same gender will occur when both are female, given the predominance of women amongst the mediators (and teachers in general, in Portugal and many other countries).
We use these data on mediators to analyse their effects on student achievement by consid-ering interactions between program participation and each mediator’s attributes. Critically, we also draw on the fact that there is no selection in the assignment of mediators to students, in contrast to what is often the case in the assignment of teachers to classes in schools. In-deed, the mediator is a teacher that was already assigned to the school, even before the EPIS program started there. Moreover, virtually all treated students in each school are assigned to the same mediator as in nearly all cases there is a single mediator per school. We therefore consider the following version of equation 1:
yi = α + β1EP ISi+ β2EP ISi∗ M AAm(i)+ γs(i)+ ui, (3)
in which all variables are as before and M AAm(i) is attribute A (age, gender, etc) of mediator m that conducts the EPIS intervention with student i.
together. Table 8 presents the results, based on the delivery version of the EPIS dummy variable (very similar results are found when using the assignment variable - available upon request). Considering the isolated interaction coefficients, the results indicate that, on top of the positive overall effects of EPIS mediation, none of the individual mediator character-istics have a positive effect on student progression. If anything, age, EPIS tenure and salary have negative effects. However, male mediators or mediators with postgraduate diplomas do not have significantly different results, compared to women mediators or mediators without postgraduate diplomas, respectively.
On the other hand, the interaction with a dummy variable indicating cases in which the mediator is of the same gender as the student (.e. a female mediator and a female student) proves to have a positive effect. The magnitude of the effect is of a similar scale as that of the EPIS effect itself in several previous specifications, with a coefficient of .046 (column 6). Moreover, when pooling all interactions (column 7), it is this same-gender interaction the only that remains significant - all other variables (including age, tenure and salary) become or remain insignificant. The magnitude of the same-gender variable in the pooled interaction specifications (.063) is also similar to the specification of column 6. This gender result is also consistent with our informal discussions with a number of female mediators, who indicated they find it easier to engage with girls than boys during the mediation sessions and that this leads to stronger and more rapid results with girls than boys. However, it should be noted that, given the large percentage of mediators that are women, the same-gender variable is strongly correlated with the female student variable (correlation coefficient of 62%). When setting up a ’horse race’ between the two by adding an additional interaction between gender and program intervention to the regressions above, the same-gender regressor becomes insignificant while the female dummy is significant and large (results available upon request).
In conclusion, on top of the general EPIS effect, students have better progression results if they are supported by mediators of the same gender. However, one cannot necessarily conclude from this result that mediator-student same-gender status will matter in a context as ours in which most mediators are of the gender that also appears to benefit more from the program in general. This finding contributes to an emerging but conflicting literature on this issue, from the more general perspective of the role of teachers’ gender. For instance, Dee (2007) finds that assignment to a same-gender teacher significantly improves the achievement
of both girls and boys. However, the results in Antecol et al. (2015) indicate that female teachers lower some of the scores of female students but have no effect on male students (see also Carrell et al. (2010) and Fairlie et al. (2014)). More generally, our findings on mediators also highlight the role of teachers’ unobserved heterogeneity in driving students’ results.
5
Conclusions
This paper addresses the potential of interventions that focus on non-cognitive skills (Heckman & Rubinstein 2001, Heckman et al. 2006, Kautz et al. 2014) to deliver improvements in student achievement. We present causal evidence about the effects of an original, large program based entirely on a non-cognitive approach, EPIS, that seeks to strengthen student achievement and reduce grade retention and early school leaving. EPIS is original also due to its initial screening of all the students in the participating schools, ensuring greater focus of the resources invested by the program - mostly the staff time, typically devoted to small-group or one-on-one sessions or an approximately fortnightly basis.
We explore the rich longitudinal data on all students collected by EPIS to identify the causal effects of the program. We draw on an RCT driven by constraints in mediation time across schools. Our evidence indicates that, unlike many remedial, cognitive-based programs and even some non-cognitive based interventions, EPIS had a significantly positive effect in terms of improving the achievement levels of treated students. The probability that a student progresses over the two years when the intervention takes place increases by at least 11%. This effect increases to up to 22% in some specifications. We also find that the effect of the program is stronger amongst girls and older students as well as in language modules (compared to Maths). Finally, we also find that while a number of mediator characteristics (including age, salary, postgraduate qualifications or experience with the program) does not appear to matter, the match between the gender of the mediator and that of the student appears to play an important role: girls (boys) benefit more from working with female (male) mediators than with male (female) mediators. However, this latter result is to a large extent driven by the large percentage of women mediators and the fact that girls benefit more from the program in general.
Overall, our study supports the view that ’programs that enhance soft skills have an important place in an effective portfolio of public policies’ (Heckman & Kautz 2012).
How-ever, design, implementation and monitoring aspects will matter too, as other non-cognitive skills programs have not in all cases improved student achievement, especially in the case of adolescents (Holmlund & Silva (2014), using quasi-experimental methods). Our focus not only on quantifying the causal effects of EPIS but also exploring some of its drivers can be particularly useful for this and other related programs that wish to increase their levels of effectiveness. More generally, our findings are also a contribution to a better understanding of the mechanisms of human capital accumulation.
References
Aaronson, D., Barrow, L. & Sander, W. (2007), ‘Teachers and student achievement in the Chicago public high schools’, Journal of Labor Economics 25(1), 95–135.
Antecol, H., Eren, O. & Ozbeklik, S. (2015), ‘The Effect of Teacher Gender on Student Achievement in Primary School’, Journal of Labor Economics 33(1), 63–89.
Banerjee, A. V., Cole, S., Duflo, E. & Linden, L. (2007), ‘Remedying education: Evidence from two randomized experiments in India’, Quarterly Journal of Economics 122(3), 1235–1264. Black, S. E. & Devereux, P. J. (2011), Recent Developments in Intergenerational Mobility,
Vol. 4 of Handbook of Labor Economics, Elsevier, chapter 16, pp. 1487–1541.
Carrell, S. E., Page, M. E. & West, J. E. (2010), ‘Sex and Science: How Professor Gender Perpetuates the Gender Gap’, Quarterly Journal of Economics 125(3), 1101–1144.
Cook, P., Dodge, K., Farkas, G., Fryer, R., Guryan, J., Ludwig, J., Mayer, S., Pollack, H. & Steinberg, L. (2015), Not Too Late: Improving Academic Outcomes for Disadvantaged Youth, Northerwestern University Working Paper 15-01.
Cortes, K. E., Goodman, J. S. & Nomi, T. (2015), ‘Intensive Math Instruction and Educational Attainment: Long-Run Impacts of Double-Dose Algebra’, Journal of Human Resources 50(1), 108–158.
Dee, T. S. (2007), ‘Teachers and the Gender Gaps in Student Achievement’, Journal of Human Resources 42(3), 528–554.
Dobbie, W. & Fryer, R. G. (2011), ‘Are High-Quality Schools Enough to Increase Achievement among the Poor? Evidence from the Harlem Children’s Zone’, American Economic Journal: Applied Economics 3(3), 158–187.
Fairlie, R. W., Hoffmann, F. & Oreopoulos, P. (2014), ‘A Community College Instructor Like Me: Race and Ethnicity Interactions in the Classroom’, American Economic Review 104(8), 2567–2591.
Glewwe, P. & Kremer, M. (2006), Schools, Teachers, and Education Outcomes in Developing Countries, Vol. 2 of Handbook of the Economics of Education, Elsevier, chapter 16, pp. 945– 1017.
Hanushek, E. A., Schwerdt, G., Wiederhold, S. & Woessmann, L. (2015), ‘Returns to skills around the world: Evidence from PIAAC’, European Economic Review 73(C), 103–130. Heckman, J. & Carneiro, P. (2003), Human capital policy, NBER Working Papers 9495. Heckman, J. & Cunha, F. (2007), ‘The technology of skill formation’, American Economic
Review 97(2), 31–47.
Heckman, J. J. & Kautz, T. (2012), ‘Hard evidence on soft skills’, Labour Economics 19(4), 451–464.
Heckman, J. J. & Rubinstein, Y. (2001), ‘The importance of noncognitive skills: Lessons from the GED testing program’, American Economic Review 91(2), 145–149.
Heckman, J. J., Stixrud, J. & Urzua, S. (2006), ‘The effects of cognitive and noncognitive abili-ties on labor market outcomes and social behavior’, Journal of Labor Economics 24(3), 411– 482.
Holmlund, H. & Silva, O. (2014), ‘Targeting Noncognitive Skills to Improve Cognitive Out-comes: Evidence from a Remedial Education Intervention’, Journal of Human Capital 8(2), 126–160.
Jacob, B. A. & Lefgren, L. (2004), ‘Remedial education and student achievement: A regression-discontinuity analysis’, Review of Economics and Statistics 86(1), 226–244.
Kautz, T., Heckman, J. J., Diris, R., ter Weel, B. & Borghans, L. (2014), Fostering and Mea-suring Skills: Improving Cognitive and Non-Cognitive Skills to Promote Lifetime Success, OECD Report.
Krueger, A. B. & Lindahl, M. (2001), ‘Education for growth: Why and for whom?’, Journal of Economic Literature 39(4), 1101–1136.
Lavy, V. (2009), ‘Performance pay and teachers effort, productivity and grading ethics’, Amer-ican Economic Review 99, 1979–2011.
Lavy, V. & Schlosser, A. (2005), ‘Targeted remedial education for underperforming teenagers: Costs and benefits’, Journal of Labor Economics 23(4), 839–874.
Lazear, E. P. (2001), ‘Educational production’, Quarterly Journal of Economics 116(3), 777– 803.
Lazear, E. P. (2003), ‘Teacher incentives’, Swedish Economic Policy Review 10(2), 179–214. Leuven, E., Lindahl, M., Oosterbeek, H. & Webbink, D. (2007), ‘The effect of extra funding for
disadvantaged pupils on achievement’, Review of Economics and Statistics 89(4), 721–736. Machin, S., McNally, S. & Meghir, C. (2004), ‘Improving pupil performance in English sec-ondary schools: Excellence in cities’, Journal of the European Economic Association 2(2-3), 396–405.
Martins, P. S. (2017), Can Non-Cognitive Skills Programs Improve Achievement? Quasi-Experimental Evidence from EPIS, GLO Working Paper.
Martins, P. S. & Walker, I. (2006), Student achievement and university classes: Effects of attendance, size, peers, and teachers, IZA Discussion Paper 2490.
Pereira, A. I., Goes, A. R., Ferreira, A. J., da Silva, C. F., Rijo, D., Barros, L. & Nossa, P. (2008), Trabalhar para o sucesso escolar: Manual para t´ecnicos [Working towards student achievement: A manual for technical staff ], Texto Editora/EPIS.
Rivkin, S. G., Hanushek, E. A. & Kain, J. F. (2005), ‘Teachers, schools, and academic achieve-ment’, Econometrica 73(2), 417–458.
Taylor, E. (2014), ‘Spending more of the school day in math class: Evidence from a regression discontinuity in middle school’, Journal of Public Economics 117(C), 162–181.
Figures
Figure 1: A mediation session
Figure 2: Signalled and treated students 10 20 30 40 50 60 70 80 90 100
Number of treated students per school
10 20 30 40 50 60 70 80 90 100 110 120 130 140 150 Number of signalled students per school
Notes: The horizontal axis indicates the number of students per school that are signalled following the screening process while the vertical axis indicates the number of students per school that are treated. Each dot corresponds to a different school. 2,079 out of the total of 2,959 students are in schools where the two numbers (signalled and treated) do not match (i.e. there are more signalled than treated students). In this case, the students that are treated in tho schools are selected randomly out of the full set of signalled students.
Tables
Table 1: Descriptive statistics: treatment and control groups
(1) (2) (3)
Treatment group Control group Differences
mean sd mean sd b t Age 14.19 1.38 14.23 1.48 0.04 (0.60) Female 0.46 0.50 0.49 0.50 0.03 (1.52) Class size 22.28 4.31 22.39 4.16 0.11 (0.57) Vocational class 0.12 0.32 0.21 0.41 0.09*** (4.84) Academic year 2014.00 0.00 2014.00 0.00 0.00 (.) School year 7.50 0.57 7.49 0.50 -0.01 (-0.63) Screening - Student 11.86 3.66 12.13 3.69 0.27 (1.67) Screening - Family 1.35 0.94 1.38 0.96 0.02 (0.56) Screening - School 10.16 4.40 10.44 4.40 0.28 (1.45) Screening - Graffar 3.34 0.70 3.51 0.65 0.17*** (5.88) No. fail grades 2014:q1 4.80 2.35 4.80 2.30 -0.01 (-0.05) Fail in Maths 2014:q1 0.78 0.42 0.74 0.44 -0.03 (-1.62) Fail in Portuguese 2014:q1 0.59 0.49 0.56 0.50 -0.03 (-1.37) Fail in English 2014:q1 0.50 0.50 0.52 0.50 0.02 (0.66) No. fail grades 2014:q2 4.37 2.57 4.43 2.63 0.06 (0.43) Fail in Maths 2014:q2 0.75 0.43 0.73 0.45 -0.02 (-1.07) Fail in Portuguese 2014:q2 0.52 0.50 0.50 0.50 -0.01 (-0.55) Fail in English 2014:q2 0.49 0.50 0.48 0.50 -0.01 (-0.41)
Observations 2311 648 2959
Notes: The table presents descriptive statistics of the treatment and control groups of students and a statistical analysis of the differences in their means (without control for school fixed effects). The variables considered are the following: ‘Class size’ denotes the number of students in the class; ‘Vocational class’ is a dummy for vocational education classes; ‘Academic year’ is 2014 (in the case of the 2014/15 academic year) or 2015 (2015/16); ‘School year’ can be 7th, 8th or 9th grades; ‘Screening’ refers to a score of different dimensions of each student, regarding the probability of poor performance (the student, their family, school and region); ‘No. fail grades 2014:q1’ indicates how many modules are failed (out of a maximum of 12) in the first term of the first academic year; ‘Fail in maths 2014:q1’ is a dummy variable equal to one if the student fails the maths module in the first term, and similarly for the other modules (Portuguese and English) and the second term of the first academic year.
Table 2: Descriptive statistics: signalled and non-signalled students
(1) (2) (3)
Signalled group Non-signalled group Differences
mean sd mean sd b t Age 14.20 1.40 13.34 1.29 -0.85*** (-27.92) Female 0.47 0.50 0.50 0.50 0.03** (2.94) Class size 22.30 4.28 23.72 4.25 1.42*** (15.18) Vocational class 0.14 0.34 0.05 0.22 -0.09*** (-11.60) Academic year 2014.00 0.00 2014.00 0.00 0.00 (.) School year 7.50 0.55 7.44 0.51 -0.07*** (-5.52)
Screening score - Student 11.92 3.67 4.43 4.17 -7.49*** (-80.81) Screening score - Family 1.36 0.94 0.83 0.64 -0.53*** (-26.83) Screening score - School 10.22 4.40 8.74 4.01 -1.47*** (-14.54) Screening score - Graffar 3.37 0.69 2.86 0.77 -0.51*** (-29.67) No. fail grades 2014:q1 4.80 2.34 1.89 2.28 -2.91*** (-53.73) Fail in Maths 2014:q1 0.77 0.42 0.39 0.49 -0.38*** (-36.50) Fail in Portuguese 2014:q1 0.59 0.49 0.24 0.43 -0.35*** (-31.16) Fail in English 2014:q1 0.50 0.50 0.20 0.40 -0.30*** (-26.70) No. fail grades 2014:q2 4.39 2.58 1.86 2.38 -2.52*** (-42.50) Fail in Maths 2014:q2 0.74 0.44 0.38 0.49 -0.36*** (-33.97) Fail in Portuguese 2014:q2 0.51 0.50 0.20 0.40 -0.31*** (-27.54) Fail in English 2014:q2 0.49 0.50 0.21 0.41 -0.27*** (-24.16)
Observations 2959 7055 10014
Notes: The table presents descriptive statistics of the treatment and control (signalled) groups of students, on the one hand, and non-signalled students, on the other hand, as well as a statistical analysis of the differences in their means. The variables considered are the same as those described in Table 1.
Table 3: Main results: impact of EPIS on progression
(1) (2) (3) (4)
All Students observed All Students treated or observations in the two years observations in control group
EPIS (assignment) .048 .048 (.025)∗ (.026)∗ EPIS (delivery) .099 .061 (.023)∗∗∗ (.026)∗∗ Obs. 2959 2657 2959 2808 R2 .083 .078 .087 .076
Notes: The dependent variable is a dummy variable equal to one if the student progresses in both years (7th and 8th, or 8th and 9th). ‘EPIS (assignment)’ is a dummy variable equal to one if the student is randomly assigned to treatment. ‘EPIS (delivery)’ is a dummy variable equal to one if the student assigned to treatment receives the intervention. ‘Students treated or in control group’ corresponds to the full sample except student assigned to treatment but that do not receive the intervention. All specifications include school fixed effects. One observation for each student. Significance levels: *: 0.1; **: 0.05; ***: 0.01.
Table 4: Robustness checks: impact of EPIS on progression, with control variables (1) (2) (3) (4) (5) (6) EPIS (assignment) .053 .054 .077 (.025)∗∗ (.024)∗∗ (.026)∗∗∗ EPIS (delivery) .097 .086 .088 (.023)∗∗∗ (.023)∗∗∗ (.024)∗∗∗ Female .052 .023 .049 .053 .024 .050 (.018)∗∗∗ (.017) (.018)∗∗∗ (.018)∗∗∗ (.017) (.018)∗∗∗ Age .059 .169 .146 .042 .153 .126 (.112) (.109) (.123) (.112) (.109) (.123) Age2/100 -.412 -.624 -.688 -.347 -.566 -.613 (.386) (.375)∗ (.428) (.386) (.375) (.428) 8th grade .135 .110 .086 .133 .109 .084 (.021)∗∗∗ (.021)∗∗∗ (.022)∗∗∗ (.021)∗∗∗ (.021)∗∗∗ (.022)∗∗∗ Class size -.014 -.014 -.006 -.014 -.015 -.007 (.003)∗∗∗ (.003)∗∗∗ (.003)∗∗ (.003)∗∗∗ (.003)∗∗∗ (.003)∗∗
Screening score - Student -.038 -.003 -.037 -.002
(.003)∗∗∗ (.004) (.003)∗∗∗ (.004)
Screening score - Family .009 .002 .009 .002
(.009) (.010) (.009) (.010)
Screening score - School -.004 -.004 -.003 -.004
(.002)∗ (.002)∗ (.002) (.002)∗
Screening score - Graffar -.018 -.020 -.018 -.020
(.014) (.014) (.014) (.014)
No. fail grades 2014:q1 -.076 -.076
(.007)∗∗∗ (.007)∗∗∗ Fail in Maths 2014:q1 -.048 -.051 (.025)∗ (.025)∗∗ Fail in Portuguese 2014:q1 -.061 -.060 (.022)∗∗∗ (.022)∗∗∗ Fail in English 2014:q1 -.003 -.003 (.021) (.021) Obs. 2936 2936 2390 2936 2936 2390 R2 .117 .173 .286 .121 .176 .288
Notes: The dependent variable is a dummy variable equal to one if the student progresses in both years (7th and 8th, or 8th and 9th). ‘EPIS (assignment)’ is a dummy variable equal to one if the student is randomly assigned to treatment. ‘EPIS (delivery)’ is a dummy variable equal to one if the student assigned to treatment receives the intervention. ‘8th grade’ is a dummy equal to one for students that started their involvement in the program when they were attending the 8th grade. ‘Class size’ is the number of students in the class (first year). ‘Screening scores’ measure the potential challenges faced by each student in terms of progression (higher score, less likely to progress) from a number of indicators and questions. ‘No. fail grades 2014:q1’ indicates the number of modules failed by the student in the first term of the first year (before participation in the programme). ‘Fail in maths 2014:q1’ is a dummy variable equal to one if the student did not pass maths in the first term of the first year (grade one or two, in contrast to grades three, four or five). All specifications include school fixed effects. One observation for each student. Significance levels: *: 0.1; **: 0.05; ***: 0.01.
Table 5: Robustness checks: impact of EPIS on progression, different subgroups
(1) (2) (3) (4) (5) (6)
14 or Older
Girls Boys younger than 14 7th grade 8th grade
EPIS (assignment) .087 .007 .014 .064 .027 .067 (.037)∗∗ (.035) (.036) (.035)∗ (.034) (.037)∗ Obs. 1383 1576 1445 1514 1638 1321 R2 .104 .093 .121 .11 .112 .105 EPIS (delivery) .134 .066 .048 .122 .082 .109 (.034)∗∗∗ (.033)∗∗ (.034) (.032)∗∗∗ (.032)∗∗∗ (.035)∗∗∗ Obs. 1383 1576 1445 1514 1638 1321 R2 .11 .095 .122 .117 .116 .109
Notes: The dependent variable is a dummy variable equal to one if the student progresses in both years (7th and 8th, or 8th and 9th). ‘EPIS (assignment)’ is a dummy variable equal to one if the student is randomly assigned to treatment. ‘EPIS (delivery)’ is a dummy variable equal to one if the student assigned to treatment receives the intervention. ‘Older than 14’ refers to students that are 14 and one month or older as of September 2014 (the beginning of the first term of 2014/15, the academic year in which the program is first implemented). ‘7th grade’ indicates students that start their participation in the program in that grade. All specifications include school fixed effects. One observation for each student. Significance levels: *: 0.1; **: 0.05; ***: 0.01.
Table 6: Robustness checks: impact of EPIS, different outcomes
(1) (2) (3) (4) (5)
Progression in Year 2 pass (specific subjects)
Year 1 Year 2 Maths Portuguese English
EPIS (assignment) .003 .064 .016 .045 .070 (.024) (.025)∗∗∗ (.021) (.025)∗ (.025)∗∗∗ Obs. 2657 2657 2959 2959 2959 R2 .096 .07 .095 .122 .096 EPIS (delivery) .026 .097 .050 .103 .126 (.023) (.024)∗∗∗ (.020)∗∗ (.023)∗∗∗ (.023)∗∗∗ Obs. 2657 2657 2959 2959 2959 R2 .097 .074 .096 .127 .103
Notes: The dependent variable in the first (second) column is a dummy variable equal to one if the student progresses in the first (second) year of program participation. The dependent variable in the third (fourth, fifth) column is a dummy variable equal to one if the student passes her maths (Portuguese, English) module. ‘EPIS (assignment)’ is a dummy variable equal to one if the student is randomly assigned to treatment. ‘EPIS (delivery)’ is a dummy variable equal to one if the student assigned to treatment receives the intervention. All specifications include school fixed effects. One observation for each student. Significance levels: *: 0.1; **: 0.05; ***: 0.01.
Table 7: Descriptive statistics: the mediators
Mean SD
Male .09 .28
Age 48.21 5.44
EPIS Tenure 2.74 1.75
Share of time in EPIS 0.87 0.22
Annual gross salary (in euros) 28051.63 4275.70
Postgraduate degree holder 0.15 0.36
Mediation load (number of students supported) 58.02 29.59 Percentage of supported students of same gender .48 .05 Observations (minimum across variables) 34
Notes: ‘Male’ is a dummy variable equal to one if the student’s mediator is a man. ‘Age (Tenure, Annual gross salary)’ is the age (tenure, salary) of the mediator. ‘Share of time in EPIS’ is the percentage of time spent by the mediator on EPIS (in terms of their full-time contract), e.g. 50%. ‘PG diploma’ is a dummy variable equal to one if the mediator has a postgraduate degree. ‘Mediation load’ is the number of students supported by the mediator. ’Percentage of supported students of same gender’ measures the percentage of male (female) students in the case of a male (female) mediator.
Table 8: The role of the mediators’ attributes
(1) (2) (3) (4) (5) (6) (7)
EPIS (delivery) .110 .293 .170 .279 .114 .093 .297
(.027)∗∗∗ (.062)∗∗∗ (.039)∗∗∗ (.060)∗∗∗ (.028)∗∗∗ (.028)∗∗∗ (.062)∗∗∗
Interactions: EPIS x ... mediator characteristics
Male -.003 .083 (.222) (.228) Age -.005 -.007 (.001)∗∗∗ (.006) Tenure -.026 -.007 (.012)∗∗ (.014) Salary -.008 .003 (.002)∗∗∗ (.009) PG diploma -.062 -.008 (.113) (.114) Same-gender .046 .063 (.025)∗ (.026)∗∗ Obs. 2081 1998 2081 1998 2081 2081 1998 R2 .073 .077 .075 .076 .073 .074 .08
Notes: The dependent variable is a dummy variable equal to one if the student progresses in both years (7th and 8th, or 8th and 9th). ‘EPIS (delivery)’ is a dummy variable equal to one if the student assigned to treatment receives the intervention. ‘EPIS x Male mediator’ is an interaction between the EPIS dummy and a dummy variable equal to one if the student’s mediator is a man. ‘EPIS x Mediator age (tenure, salary)’ is an interaction between the EPIS dummy and the age (tenure, salary) of the student’s mediator. ‘EPIS x Mediator PG diploma (Same-gender mediator)’ is an interaction between the EPIS dummy and a dummy variable equal to one if the student’s mediator has a postgraduate degree (has the same gender as the student). All specifications include school fixed effects. One observation for each student. Significance levels: *: 0.1; **: 0.05; ***: 0.01.
Nova School of Business and Economics Faculdade de Economia
Universidade Nova de Lisboa Campus de Campolide 1099-032 Lisboa PORTUGAL Tel.: +351 213 801 600