WORKING PAPER SERIES
CEEAplA WP No. 06/2009
The Poverty Effect of Remittance Flows:
Evidence from Georgia
Ainura Uzagalieva
António Gomes de Menezes
The Poverty Effect of Remittance Flows: Evidence from
Georgia
Ainura Uzagalieva
Universidade dos Açores (DEG)
e CEEAplA
António Gomes de Menezes
Universidade dos Açores (DEG)
e CEEAplA
Working Paper n.º 06/2009
Abril de 2009
CEEAplA Working Paper n.º 06/2009 Abril de 2009
RESUMO/ABSTRACT
The Poverty Effect of Remittance Flows: Evidence from Georgia
The main purpose of this study is to analyze the poverty effects of emigration and inward remittance flows through direct and indirect channels within the context of a standard computable general equilibrium (CGE) model. For that purpose, we use a novel approach in modeling a social accounting matrix (SAM) based CGE model by combining a novel and original data set, containing rich, highly-disaggregated household budget suveys with detailed macro-level data for Georgia. A distinctive contribution of this study is the attention paid to regional differences in terms of market access and transaction costs, in addition to households’ factor endowments and consumption patterns. The main questions of interest are if and to what extent remittance flows contribute to the production and consumption pattern of the poor. Two aspects of poverty reduction are emphasized: (1) the impact of remittances on the aggregate and sectoral economic growth; and (2) the impact of remittances on poor households, their production and consumption patterns across regions. The study concludes that while having a strong macroeconomic growth effect at the aggregate level, emigration and inward remittance flows do not affect all sectors and residents symmetrically. Moreover, they have a rather limited impact in terms of poverty and income inequality.
Ainura Uzagalieva
Departamento de Economia e Gestão Universidade dos Açores
Rua da Mãe de Deus, 58 9501-801 Ponta Delgada António Gomes de Menezes
Departamento de Economia e Gestão Universidade dos Açores
Rua da Mãe de Deus, 58 9501-801 Ponta Delgada
The poverty effect of remittance flows: evidence from Georgia*
Ainura Uzagalieva (CEEAplA, CERGE-EI) and António Menezes (CEEAplA)
**
JEL Classification Codes: R13, O11
_____________________________________________________________________________________________
*) This study is supported by the EU 6th framework project “EU Eastern Neighbourhood: Economic Potential and
Future Development (ENEPO)”. The authors gratefully acknowledge financial support by European Commission under the ENEPO project. We are indebted to Mathias Luecke from the Kiel Institute for the World Development for useful comments and suggestions enriching this study. We thank Levan Gogoberishvili from the Statistical Department of Georgia for providing the Georgian dataset and Kseniya Tereshchenko from CERGE-EI for assistance in the data management. All usual disclaimers apply.
**) CEEAplA is the Centre of Applied Economics Studies of the Atlantic at the Department of Economics and Management, the University of the Azores. CERGE-EI is a joint workplace of the Center for Economic Research and Graduate Education, Charles University, and the Economics Institute of Academy of Sciences of the Czech Republic. The opinion of the authors does not necessarily express the view of the Institutions they are affilioated with.
Abstract
The main purpose of this study is to analyze the poverty effects of emigration and inward remittance flows through direct and indirect channels within the context of a standard computable general equilibrium (CGE) model. For that purpose, we use a novel approach in modeling a social accounting matrix (SAM) based CGE model by combining a novel and original data set, containing rich, highly-disaggregated houdsehold budget suveys with detailed macro-level data for Georgia. A distinctive contribution of this study is the attention paid to regional differences in terms of market access and transaction costs, in addition to households’ factor endowments and consumption patterns. The main questions of interest are if and to what extent remittance flows contribute to the production and consumption pattern of the poor. Two aspects of poverty reduction are emphasized: (1) the impact of remittances on the aggregate and sectoral economic growth; and (2) the impact of remittances on poor households, their production and consumption patterns across regions. The study concludes that while having a strong macroeconomic growth effect at the aggregate level, emigration and inward remittance flows do not affect all sectors and residents symmetrically. Moreover, they have a rather limited impact in terms of poverty and income inequality.
1. Introduction
Poverty reduction is a policy priority important at both national and international levels, as stressed in the Millennium Development Goals (MDG). This calls for a careful consideration of issues involved in poverty reduction as well as adequate methodological tools for analyzing, understanding and reducing poverty. One of the most interesting issues in this context is the poverty effect of remittance flows in the low-income countries of the New Independent States (NIS) in the former Soviet Union (fSU). These countries recently have experienced large inflows of remittances, on the one hand, and an increase in poverty and inequality incidence, on the other. For example, 9 of these countries are classified nowadays as low-income countries where the size of population groups with incomes falling bellow the average level is large (Simai 2006). At the same time, officially recorded remittances to this region increased substantially, making about 10% of remittances received by developing countries overall (Quillin, Segni, Sirtaine and Skamnelos 2007). Since most of the fSU countries committed to reduce poverty incidence and eliminate extreme poverty by 2015 under the MDG, it is important to understand whether and how remittance flows can contribute to the implementation of poverty reduction strategies.
The poverty implication of remittance flows in the NIS has received excruciantigly little attention in the literature so far. This stems from a number of limitations intrinsic to the context of the post-communist countries. Namely, the phenomenon itself is relatively new in these countries. Besides complex issues associated with the lack of adequate methodological tools as well as data for analyzing irregular migration, pervasive market imperfections with informal relations and kinship networks cause difficulties in analyzing the phenomenon very carefully. For example, under market imperfections, as mentioned by Stiglitz (1994), the standard Arrow-Debreu macroeconomic model with a complete set of markets and optimizing agents does not admittedly fully explain the economic issues under question. In addition, data required at a
reasonable level of disaggregation are beyond the statistical coverage in most of these countries. The main purpose of this study is to analyze the poverty implications of emigration and inward remittance flows through direct and indirect channels within the context of a computable general equilibrium (CGE) model.
This study focuses on Georgia, a small country in the fSU block that has seen a significant outflow of migrants due to political and economic instability and, at the same time, a large inflow of foreign currency recently. Accumulated net migration from the beginning of the 1990s to 2006 exceeded 880 thousand individuals (with some return migrants in 2004 and
2005).1 Inward remittances to Georgia amounted to more than US$ 800 million in 2006,
equivalent to about 10.2% of GDP and 72.0% of the incoming foreign direct investments (US$ 1
100 million). The size of unofficial remittances is also large, consisting about US$ 315 million or 39.4% of the total amount of remittances.2 Meanwhile, according to the official sources, about
more than a third of population (35%) is below the national poverty line: Georgia is ranked 97th
in the list of countries by the human development index in 2006. In addition to large out-migration, inward remittance and poverty issues, informal networks and kinship determine the household access to credit and capital assests in this country.
Taking into account regional differences in terms of market access and transaction costs across various household groups in Georgia; our study sheds new light on how remittances impact on households’ factor endowments and consumption patterns. The main questions of interest are if and to what extent remittance flows contribute to the production and consumption patterns of the poor. Two aspects of poverty reduction are emphasized in this study: (1) the impact of remittances on the aggregated and sectoral economic growth; and (2) the impact of
1Statistical Yearbook of Georgia, 2007.
2Georgian-European Policy and Legal Advice Centre (GEPLAC): Georgian Economic Trends, Quarterly Economic
remittances on poor households, and their production and consumption patterns across regions. For this purpose, we use a novel approach, a social accounting matrix (SAM) based CGE model that incorporates regional differences in terms of market access and transaction costs, household factor endowment and consumption pattern. We account for regional differences by disaggregating small agricultural enterprises according to geographical location and distance from the capital city.
Our SAM combines information from input-output tables, national income and product accounts, labor force statistics, fiscal statistics and highly-disaggregated micro-level data on household surveys. In this respect, this study covers the unique databases for Georgia, including highly disaggregted micro-level raw data on household budget surveys, the national accounts with the input-output transactions table, detailed balance of payments and annual report on
household surveys3 for 2004. The Georgian micro-level household surveys were conducted on
3551 households inhabiting in the capital city (Tbilisi) and 9 regions through the questionnaires
“Shinda 04” for household expenditures, “Shinda 05” for private and state transfers to households, and “Shinda 05-1” for households income from employment and self-employment
which are used in this study.4 The source of the data is the State Department for Statistics of
Georgia (SDSG).
2. General macroeconomic and institutional environment in Georgia
Georgia is a relatively small and mountainous country with population of 4.5 million and area of 69.7 thousands sq. km. The topographical features of its territory are very contrasting and include the Great Caucasian chain (5068 m. above the sea level), the medium height mountains
3 SDSG: “Households of Georgia”, 2003-2004
4Shinda stands for the Georgian abbreviation of households observation (see State Department for Statistics of
(about 3000 m.) and inner lowlands (e.g. Kolkheti and Alazani) which are used predominantly for cultivating tea, citrus, grapes and other agricultural products (the arable area is about 11% of the territory). There are 12 regions in the country including a capital region (Tbilisi), two autonomous republics and 9 regions, which are geographically and economically very diverse. The macroeconomic structure of the economy, in terms of the average shares of value added and total output by regions (Table 1, Appendix), shows that industry and service activities are concentrated mostly in the capital city Tbilisi and few other regions located predominantly at the inner lowlands (e.g. Region 4). Agriculture, which is more widespread across the regions, plays a crucially important role as a source of production and employment. It accounts for about 21% in the gross value added and represents itself the largest employer of domestic labor (54%).
The macroeconomic situation in Georgia is characterized generally by high volatility originated in the external as well as internal sources of instability (Figure 1, Appendix). For example, a slowdown in the economic growth rates, from 11.7% in 2003 to 7.5% in 2006 at the annual basis, stems from the trade embargo imposed by Russia on Georgia in 2005 and 2006, as well as political instability and inflation factors within the country. According to the annual reports of the central bank of Georgia, the large sizes of current account (1.2 billion USD) and trade (2.0 billion USD) deficits in 2006 are originated in the fall of exports, following the Russian trade embargo, and high prices of imported mineral products, which have amplified inflation to 9% in 2006 relative to the 2000-2002 average rate of 5%. Additional inflation factors are the large inward remittances and capital flows in foreign currency since, under underdeveloped domestic capital markets, the central bank has limited capacity to sustain large sterilized interventions. In addition to this, frequent changes in the domestic policy regimes and political instability under weak domestic institutions cause additional shakiness in the economy.
The local market conditions and institutions are characterized by fragmented labor and credit markets, while poverty incidence is large. The poverty situation of Georgia can be characterized based on household surveys conducted on the sample of 6754 respondents. Three categories of households are distinguished in this study for this purpose. These are: 1) the group
of poor households with monthly incomes less than 75 georgian lari (GEL);5 2) the group of
middle income households with incomes varying from 76 GEL and 200 GEL; and households, whose income exceeds 200 GEL, are assumed in this study as rich ones. According to the country-wide data, the share of households living below the poverty line is very large (about
43%) in total number of households. Rural areas have a higher poverty incidence (52%) than the
urban ones (35%).
The poverty profile of household groups by major economic activities (Figure 2, Appendix) is further analyzed in terms of a head count ratio calculated within each group. Self-employed and workers involved in family business enterprises and farms have the highest poverty incidence (about 70%), followed by wage employed. One has to remark that the share of self-employed workers is very large in the economy of Georgia, composing about 50% of the economically active population. Private employers have the lowest poverty incidence of less than
10%. A comparison of regions in terms of individual household incomes reveals a large
divergence in intra-regional poverty (Table 2 and Figure 3, Appendix). According to Table 2, the median level of household incomes, for example, is lower than the mean of all regions. Moreover, both median and mean levels vary substantially from one region to another, e.g. from
53 GEL and 74 GEL in Region 7 (Adjaria) to 132 GEL and 177 in Region 2 (Tbilisi),
respectively.
5This threshold is chosen because it corresponds to the minimum substance level (75 GEL) in Georgia (see SDSG:
From the standard deviation values and the shapes of income distributions, one can observe that differences in terms of poverty gaps are also very large. Due to a high poverty incidence as well as fragmented credit and labor markets, commercial banks are reluctant to extend loans to clients with low incomes whose land and assets are considered inadequate collateral. In addition, capital markets and pension fund systems are underdeveloped, while the insurance market is very small (0.3% of GDP). As a result, poor members of the society, especially regions far from the capital, have limited or no access to credit markets as well as employment opportunities. As a result, households tend to borrow funds from relatives, friends (or other households) through personal contacts, instead of financial institutions and banks (Figure 4, Appendix). Moreover, the size of the borrowed funds varies largely by regions, implying a very limited or no access to these funds in some regions (e.g. Region 4, 5, 7 and 10). Presumably, access to credit and other assets in this country is determined mainly by informal networks and kinship.
Taking into account the above-mentioned features of the Georgian household sector, the direct and indirect channels between remittance flows and households well-being receive a major emphasis in this study. The main questions of interest are whether and to what extent the poor households groups, which have different access to markets, can benefit from larger inward remittance flows. The diversity among household groups is incorporated through regional differences in terms of transaction costs and market margins between differet locations. In this respect, we use a novel approach in a modified CGE model which incorporates regional differences in terms market access and transaction costs, in addition to households’ factor endowments and consumption patterns, which have been reported so far elsewhere. In order to enable the regional dimension of the market access and transaction costs, we disaggregated the small agricultural enterprises into three groups of regions in SAM. In particular, three types of
household farms with the highest poverty incidence are distinguished in the model, depending on
their geographical location in regions with high- medium- and low-transaction costs.6
3. Literature review
Earlier studies focused on the poverty implications of various economic issues in developing countries and used empirical methods, typically, econometric techniques and standard SAM based CGE models (e.g. Barham and Boucher 1998; Carrington, Detragiache and Vishwanath 1996; Docquier and Rapoport 2003; Holden, Taylor and Hampton 1998; Holden, Shiferaw and Pender 2001; Milanovic 1987). From a methodological point of view, most of these studies dealing with the poverty issues tend to favor the CGE approach since it allows one to capture general equilibrium effects. In particular, Holden, Taylor and Hampton (1998) stress that when households are highly diversified within a country, remittances increase the differentiation of households further and facilitate market based exchanges among them. Subsequently, the general equilibrium effects of remittances are strong because of high transaction costs among highly diversified households, which rationalize using the CGE framework. The econometric techniques methods, on the other hand, are criticized on the grounds that they lack a clear theoretical foundation and the necessary micro-level data at a highly disaggregated level (see e.g. Azis 2002).
Three generations of CGE models have been widely used so far for analyzing the various aspects of poverty issues. The first and second generation models, for example, incorporate the distributional questions of trade and tax policies. They do not address, however, poverty issues explicitly. The third generation models incorporate interdependence among labor markets in the rural and urban sectors and, thus, allow assessing the poverty impacts more explicitly (Khan 2007). Therefore, the third approach, i.e. the SAM based general equilibrium approach that
incorporates detailed interactions within and between household groups, as well as differences in terms of market access, is recognized to be an adequate tool for analyzing the phenomenon more clearly.
The nature of local markets and the conditions affecting the market access of various household types determine the pattern and magnitude of the poverty effects caused by remittance flows (Adhikari 1992). Models which enable one to account for detailed interactions between household types are often referred to in the literature as village economy SAM based CGE models (e.g. Taniguchi 2003). The main drawback of these models lies, however, in the necessity to use highly disaggregated data (at the level of a single village) which are usually unavailable. For these reasons, only a limited number of studies have managed so far to incorporate such a detailed dataset within a CGE framework, as demonstrated e.g. in Adelman, Taylor and Vogel (1988), who analyzed the impact of remittances on the rural household sector in the Mexican economy. Due to difficulties associated with disaggregating the SAM, in this respect, most studies focused on regional models (e.g. Khan 2007), integrating fully and partially regionalized SAMs into the CGE framework.
Recent studies carried out in the framework of regionalized CGE models found that the magnitude and nature of the impact caused by remittance flows on poverty, income distribution and economic development depends on different factors. The latter include the size of remittance inflows, the type of out-migration, and the distribution of factor endowment within countries (Quibria 1997). Furthermore, emigration and remittance flows to a country do not affect all residents symmetrically. For example, it is found that in the urban areas remittances contribute to the increase of household incomes and consumption smoothing (Kannan and Hari 2002), saving and asset accumulation (Hadi 1999), and access to health services (Yang 2003). In the rural areas, the impact can be two-fold depending on whether and how households are involved
into the internal and international remittance processes. Xiaoping, Heerink, Holden and Futian (2005) suggest that if rural households receive remittance incomes directly from their migrant family members, then they substantially decrease their farm activities in favor of market related ones (e.g. hiring labor, production and lending). This eventually changes the resource allocation and aggregate welfare, improving largely the number of commercial transactions at markets. Under market imperfections, however, the impact of remittance inflows on the local market conditions as well as farm activities can be negligible or even negative. This is because the overall incentives of farms to land conservation activities decrease substantially. Therefore, since land conservation activities are labor intensive and farm family members leave for market activities, labor in farms is not easily substitutable by hired labor (Thapa 2003).
The above-mentioned studies suggest that the diversity of household groups in terms of location and access to various markets and resource opportunities needs to be taken into careful consideration when analyzing the poverty implication of remittances. Differences in terms of transaction costs and market margins between different locations usually take into account such diversity among households. In this respect, given market imperfections and limited statistical coverage in data on Georgia, this study analyzes the macroeconomic implications of remittance flows, in terms of poverty reduction, through direct and indirect causal channels. The main questions of interest are whether and to what extent remittance flows contribute to the production and consumption pattern of the poor. Two aspects of poverty reduction are emphasized in this study: (1) the impact of remittances on the aggregated and sectoral economic growth; and (2) the impact of remittances on the poor households, their production and consumption patterns across regions. Particular attention is paid to regional differences in terms of market access and transaction costs, apart from households’ factor endowments and consumption patterns reported elsewhere.
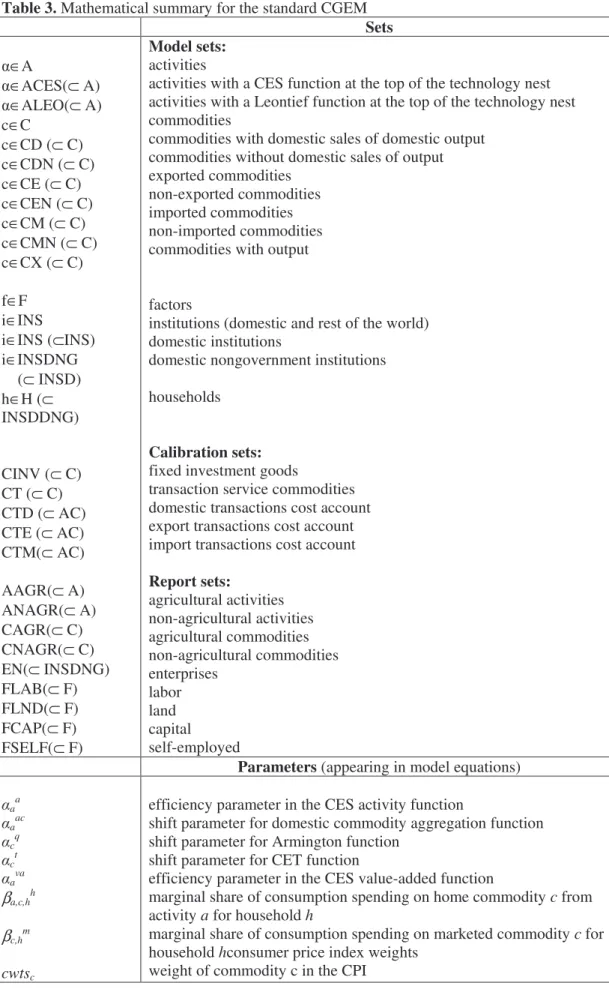
4. The building blocks of the CGE model
The CGE model used in this paper is neo-classical in spirit and integrates all the standard characteristics of a small developing country under Armington’s (1969) assumptions. To be more specific, products traded internationally are assumed to be differentiated by their country of origin. In addition, the products of industries, which come from different countries, are considered imperfect substitutes for each other. These assumptions are introduced by accommodating a cross-hauling phenomenon that is widely observed in bilateral trade statistics. That is, when a country exports and imports the product of a certain industry simultaneously, the product differentiation and imperfect substitution assumptions make the existing trade statistics usable. Moreover, the elasticity of substitution within the groups of products is assumed to be constant. Such assumption simplifies the parameterization of the model, as it was recognized in many recent empirical studies (see. e.g. Zhang 2006).
Following Lofgren, Harris and Robinson (2002), the specification of our CGE model
incorporates specific features particularly important in developing countries.7 These are market
imperfections (e.g. household consumption of non-marketed “home” commodities), transaction costs for commodities, and separation between production activities and commodities. Such a separation permits any activity to produce multiple commodities and any commodity to be produced by multiple activities. The model is implemented in the General Algebraic Modeling System (GAMS) software. The mathematical model is provided by a set of simultaneous nonlinear equations grouped according to the building blocks which include: production, activities and factor markets; institutions; commodity markets; and macroeconomic balances (Tables 3, 4 in Appendix). The main basic characteristics of these blocks are provided below.
7 These importance features have been modeled so far within the framework of a neoclassical-structuralist approach
Production and consumption decisions are driven by profits and utility maximization problems, respectively. The equations also include a set of constraints which cover markets for factors, commodities and macroeconomic aggregates including balances for savings, investment, the government, and the current account of the rest of the world. Producers are represented by a range of activities, each maximizing profits subject to a production technology. Profits are defined as the difference between the revenue earned and the cost of factors and intermediate inputs. The technology is specified by a constant elasticity of substitution (CES) function and a Leontief finction of the value-added and aggregate intermediate unput. As a part of profit-maximizing decision, each activity uses a set of factors up to the point where the marginal revenue product of each factor is equal to its factor price.
Institutions are represented by households, enterprises, the government, and the rest of the world. Households earn incomes on production factors, receive domestic institutional transfers, as well as remittances and transfers from the rest of the world. Households pay direct taxes and make transfers to other institutions. The consumption of market and home-produced commodities by households is allocated according to linear expenditure system (LES) demand functions. Enterprises do not consume and distribute their incomes to direct taxes, savings, and transfers. The government income consists of taxes and institutional transfers, while expenditures are composed by government purchases, consumption and transfers. The final institution is the rest of the world and the current account deficit is the difference between foreign currency spending and receipts.
The commodity sector consists of home-consumed output, domestic output and imported
goods. Domestic output is aggregated from different activities which are imperfectly
substitutable due to differences in timing, quality and distance between production locations.8
The demand system for the output is derived from a cost minimization problem. Prices are activity specific and markets clear for each disaggregated commodity. The aggregated domestic
output is distributed between exports and domestic sales.9 The domestic demand system is
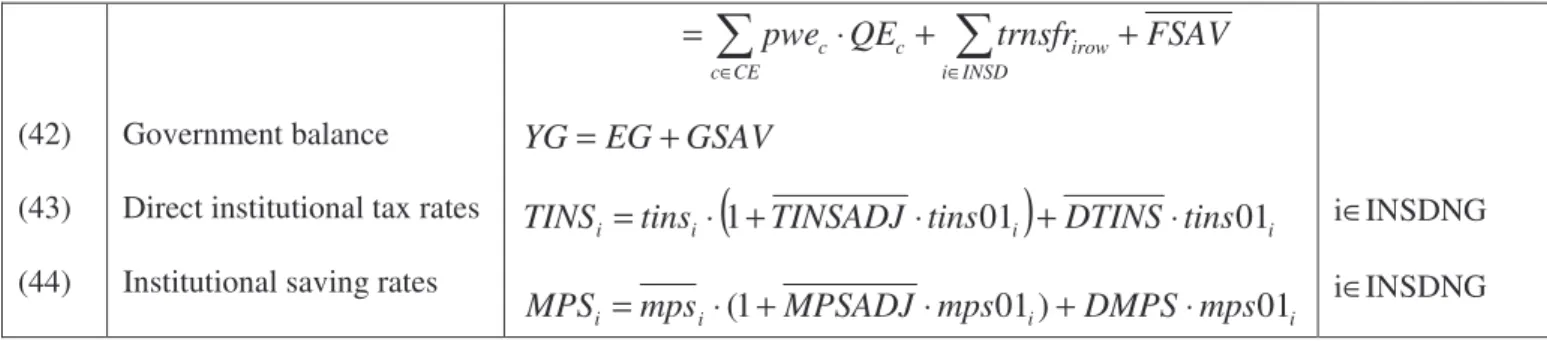
composed of the demands for household consumption, investment, government consumption, intermediate inputs, trade and transportation. Demand at each of these levels is derived from the cost minimization problem subject to imperfect substitutability, captured by a CES aggregation function. The demand for imported goods is equilibrated by the supply of exporters, which are infinitely elastic at given world prices. Since import prices include import tariffs and transactions costs per import unit, the derived demand for domestic output is equilibrated by domestic supply through flexible prices. The degree of interdependence between the domestic and world prices is captured by two important assumptions: imperfect transformability between exports and the domestic sales of domestic output and imperfect substitutability between imports and domestically sold domestic output. Macroeconomic balances in the model include the government balance, current account balance, and the saving-investment balance.
5. The SAM based CGEM with regional differences: data calibration and simulation results
The SAM maps production and distribution at the aggregate level and summarizes succinctly the interdependence between productive activities, factor prices, household income distribution, balance of payments, capital accounts. Given the technical conditions of production, the value added is distributed to the factors of production. Then, accrued by these factors, it further flows to households along with the ownership structure of assets and wages. The SAM
9 Suppliers maximize sales revenue for any given aggregate output level, subject to imperfect transformability
represents, therefore, the matrix of equal rows (receipts) and columns (expenditures), as of accounting constraint. The Georgian aggregated SAM (Table 5, Appendix), which is based on
the standard approach of International Food Policy Research Institute (IFPRI),10 is constructed
first on the economy-wide data. It represents 13 production activities from 18 sectors reported in the original input-output tables. The domestic production generates 12 commodities. The production of agricultural commodities is separated between large and small agricultural enterprises. Transaction costs among institutions, including households, enterprises and government originate in domestic sales, exports and imports activities. Production factors, which are capital, labor and self-employment, are decomposed between agriculture and other production units. Labor is split to high, medium and low-skill components using the sub-classification of employed by major work positions.
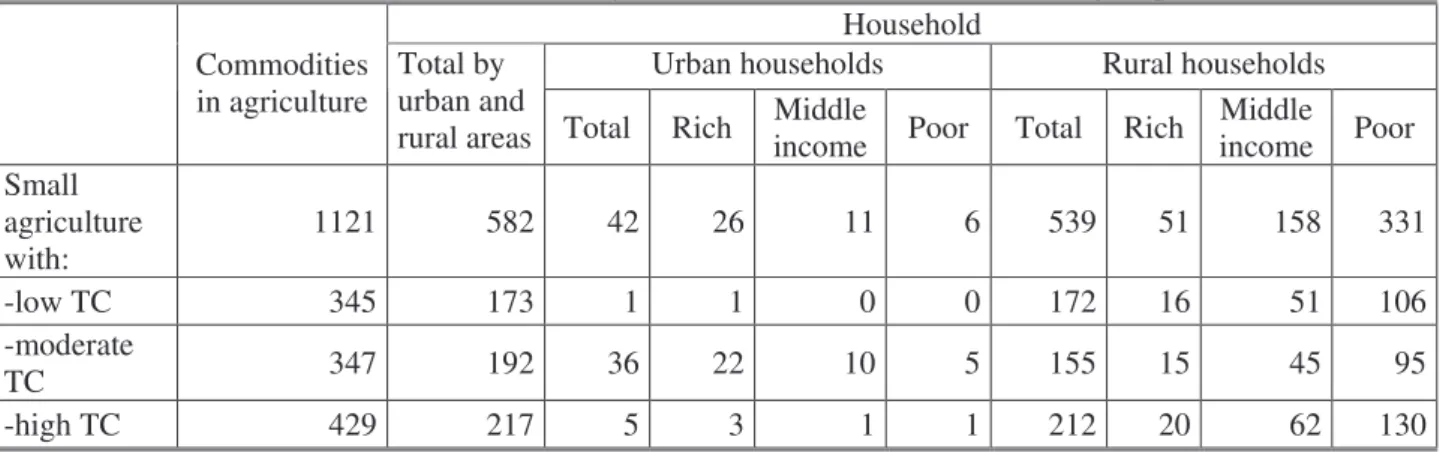
As mentioned, the original SAM has been modified in this study by disaggregating the small agricultural enterprises into three groups of regions in order to enable the regional
dimension of the market access and transaction costs.11 A basic intuition behind this is that
farmers located in the remote or mountainous areas of the country face higher transportation and marketing margins than other regions. In this respect, three types of household farms, which have the highest poverty incidence, are distinguished in the model. These are the household farms located geographically in regions with high- medium- and low-transaction costs. The grouping of regions is based on the topographical features of the country’s territory. In particular, regions located at the mountainous parts of the territory are considered to have high-transaction costs, while regions with small cities and arable land incur medium-transaction costs. The capital
10 For an overview over the main CGE modeling approaches with references to appropriate literature, see Robinson
(2003). For a detailed description of the IFPRI standard model see Lofgren et al. (2002).
city with its surroundings is assumed to be in a low-transaction cost area. The regional disaggregation of small agricultural enterprises into three groups by transaction costs and household groups in SAM is presented in (Table 6, Appendix). Clearly, urban households face lower transaction costs with about 88% of their production activities concentrated in the regions with low and medium transaction costs, while about 40% of production activities, into which rural households are involved, take place in the regions with high transactions costs.
In examining the poverty profiles, the household accounts are of particular importance because the flows of income and expenditures need to be adequately reflected in the SAM. Therefore, taking into account income levels, the households of Georgia are classified into six groups: rural-rich, rural-middle income, rural-poor, rich, middle income, and urban-poor.
Five illustrative scenarios are simulated, including: 1) a base run; 2) a decrease in total factor productivity (TFP) by 20%; 3) a reduction in remittances by 70%; 4) an increase in labor supply by 20%; and 5) the combined effect of the remittance, labor supply and TFP effects. These scenarios describe what the Georgian economy would have looked like in 2004 without labor migration and remittances. The first simulation hypothetically eliminates the growth of TFP. The second and third scenarios demonstrate the impact of a large decrease in remittances and an increase in domestic labor supply. These two scenarios are combined in the fourth simulation and the fifth simulation adds lower TFP. As demonstrated in Table 7 (Appendix), the macroeconomic impact of remittance inflows applied homogeneously across all sectors is strongest on the private household consumption and negligible on the GDP growth rate. Remittances lead to higher domestic absorption, larger imports and lower exports. The combined effect of remittance inflows and emigration is negative with respect to all variables considered, with the strongest impact on the private consumption, domestic absorption and GDP growth
rates. The growth rates of these variables in a hypothetical economy in the absence of migration and remittances in 2004 would be lower by 24.7%, 13.6% and 13.3%, correspondingly.
At the level of individual sectors, a simulated increase in remittance inflows has a strongest influence on the manufacturing output, which decreases by 14.9% and large-scale agricultural production by about 8.7%. The impact of remittances on the production of household farmers (or small agriculture) is two-fold. In regions with low and high transaction costs, the production increases by 2.8% and 1.3%, correspondingly, while in the medium transaction cost regions it falls by 2.5%. Presumably, moderate transaction costs allow these farmers to decrease substantially their farm activities and get involved into other kind of market related activities, once they receive remittances. The positive effect of remittances is pronounced in the construction (4.1%) and service (e.g. hotel and restaurants) sectors (2.6%) and has a negative impact on the electricity sector (-0.8%). The impact on the remaining sectors is negligible. The combined effect of remittance inflows and emigration is strongest in small-scale agriculture sector. In particular, the production of farms in regions with low, moderate and high transaction costs falls by 13%, 26% and 17%, correspondingly. Only the large agricultural sectors gain in output by about 14.3%.
In terms of households groups included in the model, the results reveal that emigration and remittance flows do not affect all residents symmetrically, but depend on the household groups. In the urban areas, remittances contribute to the increase of household incomes and consumption smoothing, while in the rural areas the effect is positive, but rather week. For example, the groups of rural poor and middle-income households can benefit of 1% in their private consumption each, while in urban areas these groups gain 7.4% and 5.0%, correspondingly. One can also observe that the magnitude of this impact is smaller compared to that of rich households with the pure effect of remittances equivalent to 16.9% and 7.8% of
private consumption, respectively, in urban and in rural areas. Consequently, remittances are beneficial to the wealthier members of this society (i.e. rich households) in both urban and rural areas. An increase in the supply of labor by 20%, on the contrary, would improve the welfare state of households in all groups, especially, of the rural poor at the outset. These households would benefit a 16% increase in private consumption under better access to labor markets. The effect of labor supply is smallest on rich urban households (about 9% of private consumption).
6. Conclusion
This paper presents a novel SAM based CGE model combining original rich, highly-disaggregated houdsehold budget suveys with macro-level data for Georgia. The model takes into account regional differences in terms of market access and transaction costs across various household groups, in addition to households’ factor endowments and consumption. The main question of interest is whether remittance flows contribute to the production and consumption pattern of the poor with the emphasis on two aspects of poverty reduction. The first aspect is the impact of remittances on the aggregate and sectoral economic growth. The second is the impact of remittances on the poor households, their production and consumption patterns across regions. The conclusions to be drawn from this study are that, while having a strong macroeconomic growth effect at the aggregate level, emigration and inward remittance flows do not affect all sectors and residents symmetrically. Moreover, they have a rather limited impact in terms of poverty and income inequality. In urban areas, for example, remittances contribute to the increase of household incomes and consumption smoothing, while in rural areas the effect is two-fold. Namely, in regions with low and high transaction costs, remittances are beneficial to small farmers, while in the medium transaction cost regions the effect is opposite. Presumably, the moderate level of transaction costs allow these farmers to shift from the farm related activities to market ones, once they have access to remittances. The magnitude of the impact
caused by remittances on the consumption pattern is smallest for the group of poor and middle-income rural households (1.6% and 1.0%, respectively) and largest for rich urban households. Under the absence of remittances, rich households would incur a loss of about 16.9% in their private consumption. Consequently, the wealthier members of the society gain more from remittances than poorer household categories. Better access to labor markets, on the contrary, would improve the welfare state of many, especially, of the rural poor at the outset.
Policy priorities, in these circumstances, should be given to a pro-poor approach, especially, in improving institutional mechanisms through which the poor households can have access to labor and credit markets within the country. With the focus on the inclusion of low-income and rural households in the financial sector, for example, policy can be designed for meeting the needs of household farmers in distant regions. This would include also enabling various possibilities for linking remittance flows with the microfinance based mechanisms focused on promoting saving, insurance and investment within regions, as well as decreasing transaction costs across the regions.
Appendix
Table 1. The regions and main activities of Georgia (%)
Regions Industry Hotels and restaurants communications Construction Agriculture Transport and Georgia,
total including: 100.00 100.00 100.00 100.00 100.00
Kakheti Reg. 1 3.62 0.52 0.11 1.77 14.32
City of Tbilisi Reg. 2 43.47 77.83 78.99 63.00 0.10
Shida Kartli Reg. 3 7.51 1.67 0.07 4.61 7.33
Kvemo Kartli Reg. 4 21.36 1.64 1.87 4.44 18.67
Mtskheta-Mtianeti Reg. 5 3.71 5.32 0.10 2.38 4.71 Samtskhe-Javaketi Reg. 6 3.98 0.62 0.04 0.81 7.66 Adjaria Reg. 7 2.64 5.76 8.04 3.74 5.27 Guria and Racha-Lechkhumi Reg. 8 1.28 0.79 0.08 1.36 6.88 Samegrelo-Zemo Svaneti Reg. 9 1.83 2.10 10.32 14.51 16.62 Imereti Reg.10 10.59 3.76 0.37 3.39 18.45 Source: SDSG (2004)
Table 2. Distribution of individual labor incomes by regions in 2004 (GEL)
Reg. 1 Reg. 2 Reg.3 Reg.4 Reg. 5 Reg. 6 Reg. 7 Reg. 8 Reg. 9 Reg. 10
Maximum 1 054 2 000 500 950 767 3 000 600 1 000 850 667 Minimum 3 3 5 10 5 7 3 10 3 3 Mean 101 177 92 134 103 143 74 93 123 117 Median 68 132 70 109 70 100 53 70 87 80 Standard deviation 108 172 78 105 109 210 66 92 113 103
Table 3. Mathematical summary for the standard CGEM Sets ∈A ∈ACES(⊂ A) ∈ALEO(⊂ A) c∈C c∈CD (⊂ C) c∈CDN (⊂ C) c∈CE (⊂ C) c∈CEN (⊂ C) c∈CM (⊂ C) c∈CMN (⊂ C) c∈CX (⊂ C) f∈F i∈INS i∈INS (⊂INS) i∈INSDNG (⊂ INSD) h∈H (⊂ INSDDNG) CINV (⊂ C) CT (⊂ C) CTD (⊂ AC) CTE (⊂ AC) CTM(⊂ AC) AAGR(⊂ A) ANAGR(⊂ A) CAGR(⊂ C) CNAGR(⊂ C) EN(⊂ INSDNG) FLAB(⊂ F) FLND(⊂ F) FCAP(⊂ F) FSELF(⊂ F) Model sets: activities
activities with a CES function at the top of the technology nest activities with a Leontief function at the top of the technology nest commodities
commodities with domestic sales of domestic output commodities without domestic sales of output exported commodities
non-exported commodities imported commodities non-imported commodities commodities with output factors
institutions (domestic and rest of the world) domestic institutions
domestic nongovernment institutions households
Calibration sets:
fixed investment goods
transaction service commodities domestic transactions cost account export transactions cost account import transactions cost account Report sets: agricultural activities non-agricultural activities agricultural commodities non-agricultural commodities enterprises labor land capital self-employed
Parameters (appearing in model equations)
aa aac cq ct ava βa,c,hh βc,hm cwtsc
efficiency parameter in the CES activity function
shift parameter for domestic commodity aggregation function shift parameter for Armington function
shift parameter for CET function
efficiency parameter in the CES value-added function
marginal share of consumption spending on home commodity c from activity a for household h
marginal share of consumption spending on marketed commodity c for household hconsumer price index weights
δaa δacac δcq δct δfava dwtsc γh a,c,h γm c,h icaca intaa ivaa icdcc’ icecc’ icmcc’ mps01c mpci qdstc qgc qinvc aa cac cq ct ava shifif shiiii’ supernumH ac tins01i trnsfrif t α tec tff tinsi tmc tqc
CES activity function share parameter
share parameter for domestic commodity aggregation function share parameter for Armington function
share parameter for CET function
share parameter for CES activity production function domestic sales price weights
subsistent consumption of home commodity c from activity a for household h
subsistent consumption of marketed commodity c for household h quantity of c as intermediate input per unit of activity a
aggregate intermediate input coefficient quantity of value-added per activity unit
trade input of c per unit of commodity c’ produced and sold domestically
trade input of c per unit of commodity c’ exported trade input of c per unit of commodity c’ imported
0-1 parameter with 1 for institutions with potentially flexed direct tax rates
base saving rate for domestic institution INS quantity of stock exchange
base-year quantity of government demand base-year quantity of private investment demand CES production function exponent
domestic commodity aggregation function exponent Armington function exponent
CET function exponent
CES activity production function exponent
share of domestic institution i in income of factor f
share of net income of i’ to i (i’∈ INSDNG’, i∈ INSDNG) LES supernumerary income
yield of commodity c per unit of activity a
0-1 parameter with 1 for institutions with potentially flexed direct tax rates
transfers from factor f to institution i tax rate on producer gross output value tax rate on exports
direct tax on factors
exogenous direct tax on domestic institutions I rate of import tariff
rate of sales tax rate of value-added tax
Variables CPI DTINS FSAV GADJ IADJ MPSADJ QFSf TINSADJ WFDISTfa DPI DMPS EG EHh EXR GOVSHR GSAV INVSHR MPSi PAa PDDc PDSc PEc PINTAa PMc PQc PVAa PWEc PWMc PXc PXACa,c QAa QDc QEc QFf,a QGc QHc,h QHAa,c,h QINTc,a QINTAa QINV c QM c QQ c QT c QVAa QX c Exogenous:
consumer price index (PQ-based) change in domestic institution tax share foreign savings
government demand scaling factor
investment scaling factor (for fixed capital formation) savings rate scaling factor
quantity of factor supply direct tax scaling factor factor wage distortion variable
Endogenous:
index for domestic producer prices (PDS-based)
change in marginal propensity to save for selected institutions total current government expenditure
household consumption expenditure exchange rate
government consumption share of absorption government savings
investment share of absorption
marginal propensity to save for domestic non-government institution output price of activity a
demand price for commodity c produced and sold domestically supply price for commodity c produced and sold domestically price of exports
price of intermediate aggregate price of imports
price of composite good c value added price
world price of exports world price of imports average output price
price of commodity c from activity a level of domestic activity
quantity of domestic sales quantity of exports
quantity demanded of factor f from activity a quantity of government consumption
quantity consumed of marketed commodity c by household h
quantity consumed of home commodity c from activity a by household
h
quantity of intermediate demand for c from activity a quantity of aggregate intermediate input
quantity of fixed investment demand quantity of imports
quantity of composite goods supply
quantity of trade and transport demand for commodity c quantity of aggregate value added
QXACa,c TABS TINSi TRIIi,i’ WALRAS WALRASSQR WFf YFf YG YIFif YIi
quantity of output of commodity c from activity a total absorption
rate of direct tax on domestic institutions ins
transfers to domestic institution (both in the set INSDNG) savings-investment imbalance (should be zero)
Walras squared
economy-wide wage (rent) for factor f income of factor f
total current government income income of institution ins from factor f
Table 4. Mathematical representation for the standard CGEM
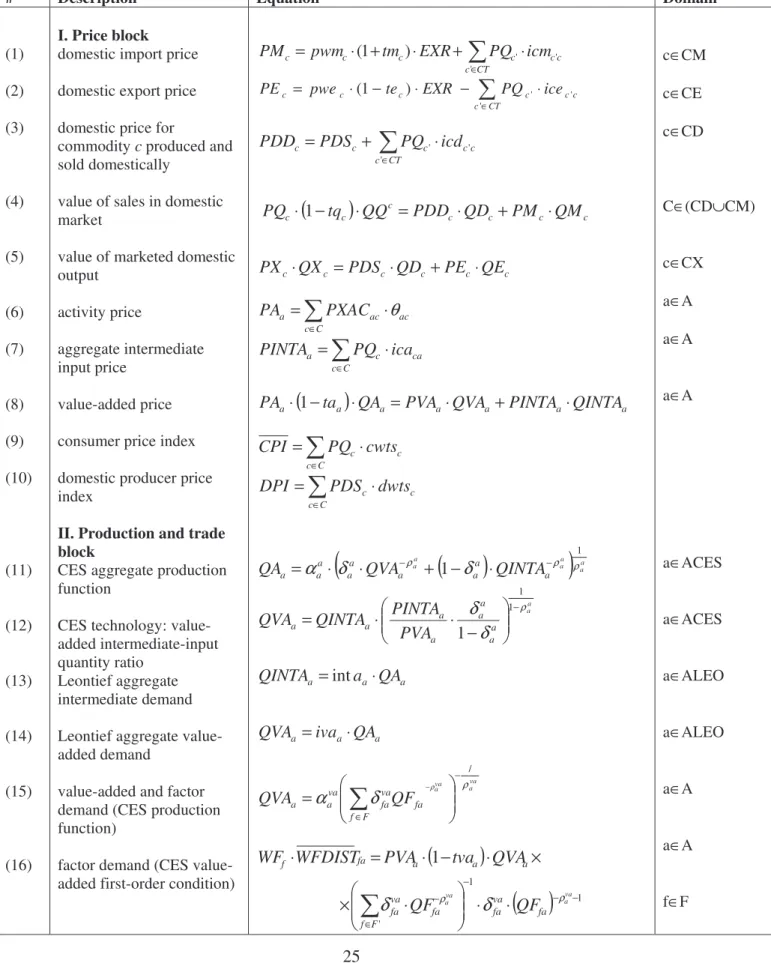
# Description Equation Domain
(1) (2) (3) (4) (5) (6) (7) (8) (9) (10) (11) (12) (13) (14) (15) (16) I. Price block
domestic import price domestic export price domestic price for
commodity c produced and sold domestically
value of sales in domestic market
value of marketed domestic output
activity price
aggregate intermediate input price
value-added price consumer price index domestic producer price index
II. Production and trade block
CES aggregate production function
CES technology: value-added intermediate-input quantity ratio
Leontief aggregate intermediate demand Leontief aggregate value-added demand
value-added and factor demand (CES production function)
factor demand (CES value-added first-order condition)
c c CT c c c c c pwm tm EXR PQ icm PM ' ' ' ) 1 ( + ⋅ + ⋅ ⋅ = ∈ c c CT c c c c
c pwe te EXR PQ ice
PE ' ' ' ) 1 ( − ⋅ − ⋅ ⋅ = ∈ c c CT c c c c PDS PQ icd PDD ' ' '⋅ + = ∈
(
c)
c c c c c c tq QQ PDD QD PM QM PQ ⋅ 1− ⋅ = ⋅ + ⋅ c c c c c c QX PDS QD PE QE PX ⋅ = ⋅ + ⋅ ∈ ⋅ = C c ac ac a PXAC PA θ ca C c c a PQ ica PINTA = ⋅ ∈(
a)
a a a a aa ta QA PVA QVA PINTA QINTA
PA ⋅ 1− ⋅ = ⋅ + ⋅ c C c c cwts PQ CPI = ⋅ ∈ c C c c dwts PDS DPI = ⋅ ∈
(
)
(
)
a a a a a a a a a a a a a a a QVA QINTA QA α δ ρ δ ρ ρ 1 1 − − + − ⋅ ⋅ ⋅ = a a a a a a a a a a PVA PINTA QINTA QVA ρ δ δ − − ⋅ ⋅ = 1 1 1 a a a a QA QINTA = int ⋅ a a a iva QA QVA = ⋅ va a va a F f fa va fa va a a QF QVA α δ ρ ρ / − ∈ = −(
−)
⋅ × ⋅ = ⋅ fa a a af WFDIST PVA tva QVA
WF 1
( )
1 1 ' − − − ∈ − ⋅ ⋅ ⋅ × ava ava fa va fa F f fa va fa QF QF ρ ρ δ δ c∈CM c∈CE c∈CD C∈(CD∪CM) c∈CX a∈A a∈A a∈A a∈ACES a∈ACES a∈ALEO a∈ALEO a∈A a∈A f∈F(17) (18) (19) (20) (21) (22) (23) (24) (25) (26) (27) (28) (29) disaggregated intermediate input demand
commodity production and allocation
output aggregation function
first order condition for output aggregation function
output transformation (CET) function
export-domestic supply ratio
output transformation for non-exported commodities composite commodity aggregation (Armington) function import-domestic demand ratio
composite supply for non-imported outputs and nonproduced imports demand for transaction (trade and transport services)
III. Institution block
factor incomes
factor incomes to domestic institutions a ca ca ica QINTA QINT = ⋅ a ac H h ach ac QHA QA QXAC + = ⋅ ∈ θ 1 1 − ∈ − ⋅ ⋅ = ac cac c A a ac ac ac ac c c QXAC QX α δ ρ ρ × ⋅ ⋅ = − ∈ − 1 ' A a ac ac ac c c ac ac a QXAC QX PX PXAC δ ρ × ⋅ − cac−1 ac ac ac QXAC ρ δ
(
)
(
)
t c t c t c c t c c t c t c c QE QD QX α δ ρ δ ρ ρ 1 1− ⋅ + ⋅ ⋅ = 1 1 1− − ⋅ = ct t c t c c c c c PDS PE QD QE ρ δδ c c c QD QE QX = + q c c q c q c q c c q c q c c QD QM QQ α δ ρ δρ ρ 1 1− − + ⋅ = q c q c q c c c c c PM PDD QD QM ρ δ δ + − ⋅ = 1 1 1 c c c QD QM QQ = +(
)
∈ ⋅ + ⋅ + ⋅ = C c cc c cc c cc cc icm QM ice QE icd QD
QT ' ' ' ' ' ' ' fa A a fa f f WF WFDIST QF YF = ⋅ ⋅ ∈
(
)
[
tf YF trnsfr EXP]
shif YIFif = if ⋅ 1− f ⋅ f − rowf ⋅ a∈A c∈C a∈A a∈CX c∈CX a∈A a∈CX c∈(CE∪CD) c∈(CE∪CD) c∈(CD∩CEN) ∪(CE∪CDN) c∈(CM∩CD) c∈(CM∩CD) c∈(CD∩CMN) ∪(CM∪CDN) c∈CT i∈INSD f∈F i∈INSD f∈F(30) (31) (32) (33) (34) (35) (36) (37) (38) (39) (40) (41) Income of domestic, nongovernment institution Intra-institutional transfer Household consumption expenditure Household consumption demand for marketed commodities
Household consumption demand for home commodities Investment demand Government consumption demand Government revenue Government expenditures
IV. System constraint block
Factor market
Composite commodity markets
Current account balance for rest of the world (in foreign currency) + ⋅ + + = ∈ ∈ CPI trnsfr TRII YIF YI igov F f i INSDNG ii if i ' ' ' +trnsfrtrow⋅EXR
(
') (
')
' ' ' ii 1 i 1 i i ii shii MPS TINS YI TRII = ⋅ − ⋅ − ⋅(
h) (
h)
h INSDNG i ih h shii MPS TINS YI EH = − ⋅ − ⋅ − ⋅ ∈ 1 1 1 × + ⋅ = ⋅ m ch m ch c ch c QH PQ PQ γ β × − ⋅ − ⋅ ∈C ∈ ∈ c a Ac C h h ac ac m h c c h PQ PXAC EH ' ' ' ' ' ' γ γ × + ⋅ = ⋅ h ach h ach ac ach ac QHA PXAC PXAC γ β × − ⋅ − ⋅ ∈C ∈ ∈ c a Ac C h ach ac m h c c h PQ PXAC EH ' ' ' 'γ γ c c IADJ qinv QINV = ⋅ c c GADJ qg QG = ⋅ a a A a a f F f f i INSDNG i i QVA PVA tva YF tf YI TINS YG= ⋅ + ⋅ + ⋅ ⋅ ∈ ∈ ∈ + ⋅ ⋅ + ⋅ ⋅ ⋅ + ∈ ∈ EXR QM pwm tm QA PA ta c c CM c c a a a λ a + ⋅ ⋅ ⋅ + ⋅ ⋅ + ∈ ∈ c C c c c c c CE c c pwe QE EXR tq PQ QQ te '+ YIF trnsfrgovrow EXR
F f govf ⋅ + ⋅ ∈ ⋅ CPI trnsfr QG PQ EG INSDNG i igov c C c c ⋅ + ⋅ = ∈ ⋅ ∈ f A a fa QFS QF = ∈ + + + + = ∈ ∈A h H ch c c a ca c QINT QH QG QINV QQ +qdstc+QTc = + ⋅ ∈ ∈CM f F rowf c c c trnsfr QM pwm i∈INSDNG i∈INSDNG i’∈INSDNG’ h∈H c∈C h∈H a∈A c∈C h∈H c∈CINV c∈C f∈F c∈C
(42) (43) (44)
Government balance Direct institutional tax rates Institutional saving rates
pwe QE trnsfr FSAV INSD i irow c CE c c⋅ + + = ∈ ∈ GSAV EG YG= +
(
i)
i ii tins TINSADJ tins DTINS tins
TINS = ⋅1+ ⋅ 01 + ⋅ 01 i i i i mps MPSADJ mps DMPS mps MPS = ⋅(1+ ⋅ 01)+ ⋅ 01 i∈INSDNG i∈INSDNG
Table 5. National SAM (the aggregated version) for Georgia, 2004 (mln. GEL)
Accounts No. 1 2 3 4 5 6 7 8 9 10 Total
Production activities 1 0 14278 0 0 582 0 0 0 0 0 14860 Commodities 2 6044 0 1429 0 5904 0 1425 0 3100 3649 21629 Transaction costs 3 0 1429 0 0 0 0 0 0 0 0 1429 Factors 4 8581 0 0 0 0 0 0 0 85 0 8666 Households 5 0 0 5998 0 0 362 0 633 0 6994 Enterprises 6 0 0 0 2095 0 0 0 0 0 0 2095 Government/NGO 7 0 0 0 61 0 0 0 2252 599 0 2912
Taxes (direct and
indirect) 8 234 1104 0 0 206 709 0 0 0 0 2252
Rest of the world 9 0 4818 0 512 19 0 816 0 0 0 6164
Capital accounts 10 0 0 0 0 284 1386 309 0 1748 78 3727
Total 14860 21629 1429 8666 6994 2095 2912 2252 6164 3727
Table 6. The distribution of small farmers by transaction costs and household groups (mln. GEL) Household
Urban households Rural households
Commodities
in agriculture Total by urban and
rural areas Total Rich Middle income Poor Total Rich income Poor Middle Small agriculture with: 1121 582 42 26 11 6 539 51 158 331 -low TC 345 173 1 1 0 0 172 16 51 106 -moderate TC 347 192 36 22 10 5 155 15 45 95 -high TC 429 217 5 3 1 1 212 20 62 130
Source: Input-output tables and household surveys (SDSG) Table 7. The results of SAM based CGEM simulations
Aggregated macroeconomic variables Base run A decrease in TFP by 20% Reduction in remittances by 70% An increase in labor supply by 20% A combined effect 1 2 3 4 5 6 (4+5) 7 (3+4+5)
Level Change in real terms, %
Domestic absorption 11,3 -2,6 -4,7 7,1 2,4 -15,9 Private consumption 7,3 -4,0 -7,3 11,0 3,7 -24,7 Fixed investment 2,8 Government consumption 1,1 Exports 2,6 -12,7 11,9 8,7 20,5 -1,6 Imports -4,2 -1,3 -4,3 5,5 1,2 -12,8 GDP at market prices 9,8 -5,9 -0,3 8,2 7,9 -13,3
Real exchange rate 97,1 -2,9 3,3 1,2 4,3 3,7
Disaggregated macroeconomic indicators
Large agriculture and other primary sectors
0,6 3,8 -8,7 -6,3 -14,3 -40,5
Small agriculture
-low transaction cost 0,2 -9,6 -2,8 17,1 13,5 -12,4
-medium transaction
cost 0,4 -10,9 2,5 22,5 25,5 3,1
-high transaction cost 0,3 -9,0 -1,3 18,7 17,3 -7,5
Manufacturing 0,7 -12,5 14,9 6,6 21,5 5,4
Electricity 0,3 -9,8 2,8 11,6 14,3 -12,7
Processing of products
by households 0,4 -6,3 -1,9 10,1 8,4 -19,2
Construction 0,6 -3,3 -4,1 7,6 3,6 -16,5
Trade and repair of
moto. vehicles 1,0 -5,2 -1,1 8,1 7,0 -13,6
Transportation 0,9 -7,6 0,4 9,5 10,0 -16,4 Communication
services 0,4 -7,0 -1,2 10,7 9,5 -16,6
Financial, professional,
other private, services 0,7 -6,4 -0,8 9,4 8,6 -14,7
Public administration/
NGOs 0,7 -3,7 -0,4 5,2 4,7 -7,9
Public services and
private households 0,8 -4,5 -0,4 6,6 6,1 -9,2
Total 8,4 -6,1 0,0 8,5 8,5 -13,1
Household consumption
(equivalent variation)
Rural poor households 0,9 -10,5 -1,0 15,5 14,9 -25,6
Rural middle-income
households 1,5 -6,8 -0,9 10,9 10,2 -20,3
Rural rich households 1,4 -3,4 -7,8 10,5 2,6 -26,0
Urban poor households 0,6 -4,0 -7,4 11,0 3,4 -23,9
Urban middle-income
households 1,2 -5,8 -5,0 11,8 6,8 -22,1
Urban rich households 1,8 2,1 -16,9 8,9 -8,6 -29
Table 8. Disaggregated SAM for Georgia: 2004 (mln. GEL)
Activities Blocks Composits
No. 1 # 2 3 4 5 6 7 8 9 10 11 12 13 14 15
Large agric and
other primary 1 0 0 0 0 0 0 0 0 0 0 0 0 0 0 0 0
Small-scale
agriculture # 0 0 0 0 0 0 0 0 0 0 0 0 0 0 0 0
-in low trans. cost
reg. 2 0 0 0 0 0 0 0 0 0 0 0 0 0 0 0 0
-in medium trans.
cost reg. 3 0 0 0 0 0 0 0 0 0 0 0 0 0 0 0 0
-in high trans. cost
reg. 4 0 0 0 0 0 0 0 0 0 0 0 0 0 0 0 0 Manufacturing 5 0 0 0 0 0 0 0 0 0 0 0 0 0 0 0 0 Electricity etc. distribution 6 0 0 0 0 0 0 0 0 0 0 0 0 0 0 0 0 Processing of products by households 7 0 0 0 0 0 0 0 0 0 0 0 0 0 0 0 0 Construction 8 0 0 0 0 0 0 0 0 0 0 0 0 0 0 0 0
Trade and repair
of moto. vehicles 9 0 0 0 0 0 0 0 0 0 0 0 0 0 0 0 0 Hotels and restaurants 10 0 0 0 0 0 0 0 0 0 0 0 0 0 0 0 0 Transportation 11 0 0 0 0 0 0 0 0 0 0 0 0 0 0 0 0 Communication services 12 0 0 0 0 0 0 0 0 0 0 0 0 0 0 0 0 Financial, profess., other priv. services 13 0 0 0 0 0 0 0 0 0 0 0 0 0 0 0 0 Public administration / NGOs 14 0 0 0 0 0 0 0 0 0 0 0 0 0 0 0 0 A ct iv iti es Public services and private households 15 0 0 0 0 0 0 0 0 0 0 0 0 0 0 0 0 Agriculture and other primary 16 204 336 247 29 60 244 0 594 47 3 16 16 0 1 4 3 Manufacturing 17 76 125 103 9 13 242 33 124 429 106 30 94 2 29 95 177 Electricity etc. distribution 18 24 40 29 4 7 236 133 40 12 47 13 130 5 21 32 66 Processing of products by households 19 0 0 0 0 0 188 0 66 0 0 6 0 0 0 0 0 Construction 20 1 1 0 1 0 1 1 0 20 1 1 7 1 23 6 3
Trade and repair
of moto. vehicles 21 0 0 0 0 0 0 0 0 0 0 0 0 0 0 0 0 Hotels and restaurants 22 7 11 3 1 7 8 5 0 17 3 4 11 7 10 4 20 Transportation 23 9 14 10 0 4 43 3 0 55 215 3 108 1 14 20 9 C om m od iti es Communication services 24 2 3 1 1 1 14 6 0 22 25 2 14 70 23 12 30
Financial, professional and other private services 25 13 9 3 1 4 48 17 5 93 79 62 42 47 58 10 75 Public administration / NGOs 26 1 1 1 0 1 4 8 0 2 19 1 5 2 5 4 7 Public services and private households 27 8 13 10 1 2 116 29 0 22 51 7 19 33 34 36 79 Domestic sales 28 0 0 0 0 0 0 0 0 0 0 0 0 0 0 0 0 Exports 29 0 0 0 0 0 0 0 0 0 0 0 0 0 0 0 0 T ra ns . c os ts Imports 30 0 0 0 0 0 0 0 0 0 0 0 0 0 0 0 0 Labor 68 0 0 0 0 183 97 0 114 209 39 108 53 121 250 423 -low skill 31 53 0 0 0 0 45 24 0 32 160 19 71 35 64 46 58 -medium skill 32 9 0 0 0 0 84 38 0 74 24 9 24 12 20 76 85 -high skill 33 5 0 0 0 0 55 34 0 8 25 10 13 7 37 128 280 Capital 34 660 0 0 0 0 332 94 235 403 619 133 483 179 316 286 262 Self-employed: 0 933 196 416 322 214 61 151 86 399 86 311 116 204 185 169 -in agriculture 35 0 933 196 416 322 0 0 0 0 0 0 0 0 0 0 0 Fa ct or s
-in other sectors 36 0 0 0 0 0 214 61 151 86 399 86 311 116 204 185 169
Household # 0 0 0 0 0 0 0 0 0 0 0 0 0 0 0 0 Urban households: # 0 0 0 0 0 0 0 0 0 0 0 0 0 0 0 0 -rich 37 0 0 0 0 0 0 0 0 0 0 0 0 0 0 0 0 -with middle level of incomes 38 0 0 0 0 0 0 0 0 0 0 0 0 0 0 0 0 -poor 39 0 0 0 0 0 0 0 0 0 0 0 0 0 0 0 0 Rural households: # 0 0 0 0 0 0 0 0 0 0 0 0 0 0 0 0 -rich 40 0 0 0 0 0 0 0 0 0 0 0 0 0 0 0 0 -with middle level of incomes 41 0 0 0 0 0 0 0 0 0 0 0 0 0 0 0 0 -poor 42 0 0 0 0 0 0 0 0 0 0 0 0 0 0 0 0 Enterprises 43 0 0 0 0 0 0 0 0 0 0 0 0 0 0 0 0 Government/NGO 44 0 0 0 0 0 0 0 0 0 0 0 0 0 0 0 0 Direct taxes 45 0 0 0 0 0 0 0 0 0 0 0 0 0 0 0 0 Indirect taxes 46 14 0 0 0 0 52 45 0 9 14 6 40 32 12 0 11 Import tariffs 47 0 0 0 0 0 0 0 0 0 0 0 0 0 0 0 0
Rest of the world 48 0 0 0 0 0 0 0 0 0 0 0 0 0 0 0 0
Savings-investment 49 0 0 0 0 0 0 0 0 0 0 0 0 0 0 0 0 In st itu tio ns Stock change 50 0 0 0 0 0 0 0 0 0 0 0 0 0 0 0 0 Total 51 1085 1487 604 463 421 1928 531 1216 1329 1791 408 1387 548 871 944 1334