European Journal of Psychological Assessment, Vol 20(4) © 2004 Hogrefe & Huber Publishers.
doi: 10.1027/1015-5759.20.4.339
THIS ARTICLE MAY NOT EXACTLY REPLICATE THE FINAL VERSION PUBLISHED IN THE EUROPEAN JOURNAL OF PSYCHOLOGICAL
ASSESSMENT. IT IS NOT THE VERSION OF RECORD AND IS THEREFORE NOT SUITABLE FOR CITATION
Study of the Portuguese version of the Center for Epidemiologic Studies Depression Scale (CES-D) 1
Bruno Gonçalves and Teresa Fagulha Faculty of Psychology and Education, University of Lisbon
Bruno Gonçalves and Teresa Fagulha
Faculdade de Psicologia e de Ciências da Educação Alameda da Universidade 1649-013 Lisboa tel.: 351 21 793 45 54 fax: 351 21 793 34 08 e-mail: [email protected] [email protected]
1 A section of the results of the article was previously presented by the authors at the 1ºCongresso
Hispano-Português de Psicologia (Santiago de Compostela, 2000), at the VII European Congress of Psychology (London, 2001) and at the 6th European Conference on Psychological Assessment (Aachen, 2001).
SUMMARY
The CES-D is a depression scale designed to measure depressive symptomatology in the general population. The authors developed a Portuguese version of this scale. This article presents the results of the three studies carried out with this version. These results support the reliability and the validity of the scale. The CES-D proved to be sensitive to variations in the intensity of depressive symptomatology and can be used in epidemiological studies or as a screening instrument in a clinical setting. Sex does have some influence on the values of sensitivity and specificity but the educational level has a greater influence on scores: subjects with a lower education level tend to obtain higher scores with the same level of depressive symptomatology as evaluated by the clinical interview.
INTRODUCTION
The Center for Epidemiologic Studies Depression Scale (CES-D) is a scale developed by the Center for Epidemiologic Studies (National Institute of Mental Health, Rockville, MD, USA) with the objective of evaluating the occurrence of depressive symptomatology in the general population. This objective differentiates it from other depression scales, which are mainly for diagnosis in the clinical setting.
It is a self-descriptive questionnaire composed of 20 items selected from a pool of items taken from previously validated depression scales and representing the main aspects of depressive symptomatology (Radloff, 1977).
The answers to each item are given on a scale of 4 points corresponding to the subject’s evaluation of the frequency of the corresponding symptom during the last week. Four items are worded in the positive direction to break possible answer tendencies and to assess positive affects. The total score can vary from 0 to 60, with higher scores indicating a greater number of symptoms.
The phrasing of the items and the answer type are particularly simple, in this way facilitating the use of the scale with subjects of a low education level as well as its use in an interview setting.
The initial studies of the scale occurred between 1973 and 1977, with good results. The alpha coefficient of internal consistency obtained in a series of studies carried out on samples of the general population (with the participation of more than 3800 subjects) was of about .85, reaching .90 in a sample of psychiatric patients (Radloff, 1977). Radloff also proceeded with three factorial analyses of the answers to
the CES-D in three samples of the general population. The results were identical, making it possible to identify 4 factors:
1.Depressive affect 2.Positive affect
3.Somatic and retarded activity 4.Interpersonal
The four-factor structure of the scale was confirmed by several studies (Sheehan et al., 1995), but other investigations, particularly with ethnic minorities, yielded different results (Guarnacia et al., 1991; Stroup-Bernham et al., 1992). Nevertheless, the possibility of identifying various factors is not an objection with regards to the total quotation of the test, given that these factors are found to be strongly correlated.
Following the initial studies, the CES-D has been utilised in a large number of research projects in the USA (Berndt, 1990). Spanish, German (Hautzinger, 1990), Korean, Chinese (Cheung & Bagley, 1998) and other language versions were also studied. We especially refer to the French adaptation (Fuhrer & Rouillon, 1989) given that it was studied with a population, which has similar characteristics to that of our main sample (patients of the health services).
The CES-D was initially developed for epidemiological studies (Comstock & Helsing, 1976; Radloff, 1977) but is equally appropriate for clinical populations (Weissman et al., 1977): it’s use as an individual diagnostic instrument is not recommended, but it can be used from a screening perspective or for the evaluation of depressive symptomatology intensity. The original studies recommend a cut-off score of
16 (the lower limit of the upper quintile of scores in the general American population). Other studies have recommended slightly higher values. The authors of the French adaptation recommend 17 for men and 23 for women.
ELABORATION OF THE PORTUGUESE VERSION
In the elaboration of the Portuguese version, special attention was paid to the possibility of its utilisation with populations of a low education level and to its possible oral application. Therefore, after a first translation, as correct as possible, some of the items were reformulated in order to obtain a more simple and familiar expression – even if this was harmful to the literal fidelity. This option seemed adequate, seeing that the items of the CES-D do not aim for the operationalization of a theoretical construct, but rather are directly related with the common complaints in depressive disorders. The item that presented more difficulties was item 20 (“I could not get going”). In this case it was not possible to find a simple and clear expression that precisely expressed the meaning of the original item.
EMPIRICAL STUDIES
Three studies were carried out with this Portuguese version of the CES-D. In study A, a sample of university students in their first years of Psychology was used, in which they also answered the Beck Depression Inventory (BDI), the depression scale that was better studied in the Portuguese population up until now (Serra & Abreu, 1973).
Study B was carried out with patients of a Health Care Centre, with ages ranging between 35 and 65 years, who were also evaluated with the use of a structured clinical interview. All the patients of this age group that had been to an appointment with the doctors that participated in the study, within a period of 3 months, were invited to participate.
Study C was carried out with a sample of the general population within the same age group as in study B. This sample was collected in two companies, and included all the subjects of the set age group that agreed to participate.
Samples
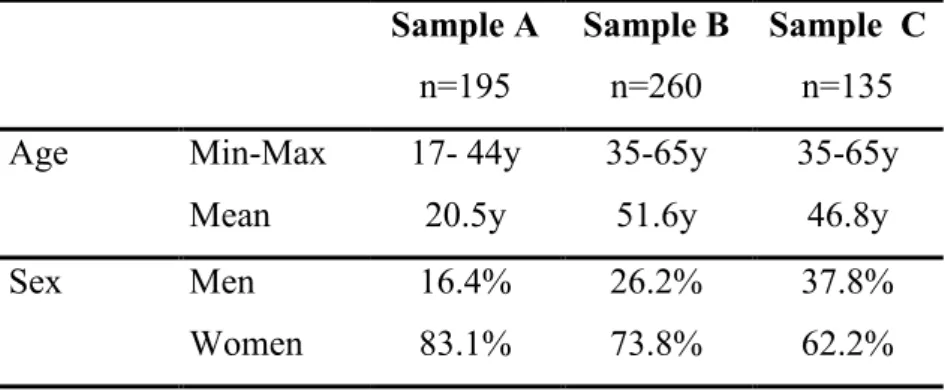
Table 1 displays the characteristics of the studied samples. In sample A, the majority of the subjects (92.6%) are of age 25 or younger and only 3% were over the age of 30 years. The proportion of women is approximately correspondent to the proportion observed in the population of university students in Psychology. Sample B is also predominantly composed of women (73%) which is in agreement with the general data regarding the patients of the Health Care Centres in Portugal (Jordão, 1995) and other countries.
Table 1: Characteristics of the samples Sample A n=195 Sample B n=260 Sample C n=135 Age Min-Max 17- 44y 35-65y 35-65y
Mean 20.5y 51.6y 46.8y
Sex Men 16.4% 26.2% 37.8%
Education Level <6 years 0 40.7% 1.5% 6≤x< 9 0 8.5% 5.2% 9≤x<12 0 23.1% 36.3% ≥12 years 100% 18.1% 37.0% Degree 0 9.6% 20.0% Method
In study A, half of the sample first answered the CES-D and the other half started by answering the BDI. In both cases, the Quality of Life Inventory (Frish, 1994; Fagulha et al., 1998), was filled out secondly. The application of the tests was done collectively.
In study B, the answers to the CES-D were collected in individual interviews, where the participants could choose between written or oral answers. Almost all the participants (93.1%) preferred to answer orally. Some demographic information was also collected. All the subjects were invited to participate in a second interview adapted from the module of assessment of mood disorders from the clinical version of Structured Clinical Interview for DSM-IV Axis I Disorders (First et al., 1997). 179 subjects agreed to participate in this interview, that was carried out immediately after, whenever possible. The objective of this interview was to verify if the subjects met the DSM-IV criteria for the presence of a Major Depressive Episode, Dysthymic Disorder or a Minor Depressive Episode. Previous history of depressive disorders was also investigated. However, the occurrence of manic or hypomanic episodes was not systematically investigated.
Previously trained clinical psychologists carried out the interviews in the property of the Health Care Centre. In order to guarantee the homogeneity of the
criteria, some interviews were initially carried out in the presence of a second psychologist, over and above the interviewer. During the whole process the doubts regarding the interpretation of the criteria were discussed with the authors.
In study C, we made use of a collective application in small groups with written answers.
RESULTS
1. Internal Consistency
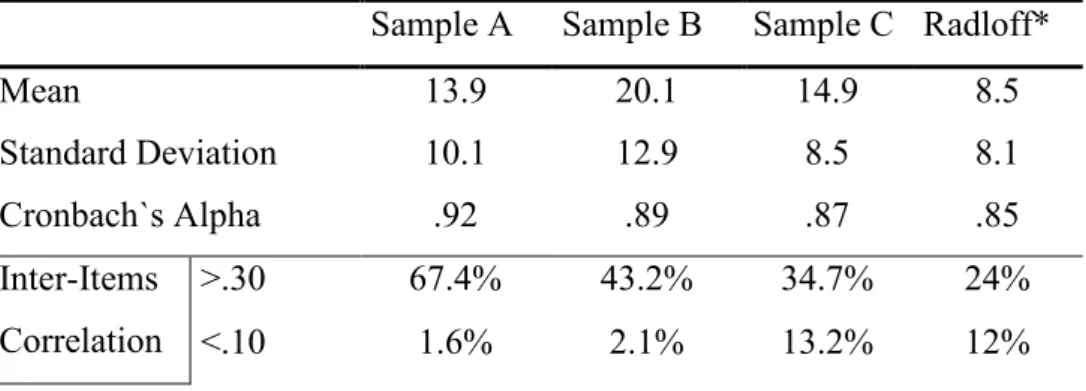
Table 2 synthetically presents the results pertaining to the internal consistency, inter-item correlations and item-total correlations for the three samples. All these values are slightly higher than those obtained by Radloff. The only exception is the item-total correlation in Sample C. In reality, the results which are less satisfactory in this sample are mostly a result of item 4, which has a low correlation with the majority of the other items, which does not occur in samples A or B.
Table 2: Mean, standard deviation and internal consistency of the CES-D Sample A Sample B Sample C Radloff*
Mean 13.9 20.1 14.9 8.5 Standard Deviation 10.1 12.9 8.5 8.1 Cronbach`s Alpha .92 .89 .87 .85 Inter-Items Correlation >.30 67.4% 43.2% 34.7% 24% <.10 1.6% 2.1% 13.2% 12%
Average .39 .29 .26 - Item-total Correlation Min-Max .31 -- .85 .24 -- .74 .11 -- .73 .30 -- .76 *Average values. 2. Factorial Structure
A principal components analysis was carried out, followed by Varimax rotation for the pooled sample (n=590). With the use of the parallel series method with the program proposed by Enzmann (1997), it is verified that the most adequate solution should retain only 3 factors with eigenvalues of 7.220, 1.433 and 1.227. Factor II precisely corresponds to Radloff´s Positive Affect Factor; Factor III groups items 14, 15 and 19 and approximately corresponds to the Interpersonal Factor; Factor I groups all the other items, in other words, it combines the Depressive Affect and Somatic/Vegetative factors. However, if we adopt a 4-factor solution, we immediately verify that there seems to be a notable global agreement with Radloff´s results. Furthermore, we need to keep in mind that our samples are very heterogeneous; particularly, sample B has a mean and standard deviation that are significantly greater than any of the others. Therefore, it also seemed advisable to carry out separate factorial analyses for each one of the samples A, B and C, adopting the same 4-factor solution.
We present the results of these 4 analyses in Table 3. We included all the items whose loading on a specific factor is equal to or greater than .40, seeing that this was also the criterion adopted by Radloff. In brackets [] we indicated the items that fulfil these criteria in the said factor, but attain a greater loading on another factor.
Table 3: Comparative results of the factor analysis in the four samples Items Radloff Portuguese Samples Pooled A B C Factor I Depressed affect 3. Blues X .49 .69 .50 .62 6. Depressed X .61 .68 .58 .71 14. Lonely X .53 .49 -.01 .50 17. Cry X .69 .62 [.42] .80 18. Sad X .66 .73 [.46] .72 9. Life failure X* .52 .33 .14 .59 10. Fearful X* .40 .68 .30 .63 1 - .64 .56 - 5 - .70 .46 - 7 - .45 .63 - 20 - .59 .65 - 11 - - .70 - 13 .65 - - .60 2 .50 - - - ─────%Var: ≈16% 16.9% 23.7% 16.1% 19.1% Factor II Positive affect 4. As good as X .65 .75 .58 .63 8. Hopeful X .70 .69 .65 .79 12. Happy X .72 .75 .74 .63 16. Enjoy X .73 .70 .74 .76 6 - [.40] - - 9 - - [.46] - 14 - - [.43] - 18 - - [.41] - ─────%Var: - 13,3% 15.9% 15.3% 11.3%
Factor III Somatic/ Vegetative 1. Bothered X .53 .04 .21 .29 2. Eating X .26 .78 .51 .53 7. An effort X .69 .36 .21 .64 11. Poor sleep X .68 .69 .19 .62 20. Get going X .69 .25 .23 .71 5. My mind X* .50 .01 .14 .57 13. Talk less X* .30 .38 .67 .03 9 - .41 .47 - 6 [.49] - [.48] [.41] 14 - - .53 [.44] 17 - - .58 - 18 - - .53 - 3 [.47] - - [.49] ─────%Var: - 15.5% 9.8% 12.7% 15.0% Factor IV Interpersonal 15. Unfriendly X .84 .79 .84 .81 19. Dislike me X .72 .63 .73 .72 13 - .48 - - 14 - [.45] - - 1 - - - .53 ─────%Var: ≈8% 8.5% 11.3% 8.3% 9.5% *Item loading>.35.
The agreement with the Radloff results is particularly noticeable in Factor II (Positive affect) and in Factor IV (Interpersonal). In each one of these factors, the items indicated by Radloff are exactly the same items with a greater factorial loading in the pooled sample and in the three Portuguese samples. In Factor I (Depressive Affect) and in Factor III (Somatic / Vegetative) the agreement is verified especially with regards to the pooled sample and sample C.
This global convergence also clearly appears when we consider the factor in which each one of the items presents a greater loading. The Radloff results are in agreement with those of the pooled sample in 18 of the items and with those of sample C in 19 of the items. In 9 of the items there is agreement in all the samples. In 4 cases (items 10, 11, 14 and 17) only the results of sample B are in disagreement. In item 2 the
results are in agreement in samples A, B and C but not in the pooled sample. We are left with only 6 cases (items 1, 5, 7, 9, 13 and 20) where slightly greater discrepancies are apparently verified. On five of these items, however, the pooled sample yields identical results to those supplied by Radloff. Furthermore, a more detailed analysis (keeping in mind that the results of the various samples studied by Radloff are not in total agreement) allows us to verify that on 4 of these items the differences are relatively of little importance.
The item in which there seems to be more disagreement is item 13. In the Radloff analyses it appeared close to factor III, even though there was some loading in factor IV (0,30 in one of the groups, versus 0,39 in factor III). In this case only the results of sample B are in agreement.
3.Confirmatory factor analysis
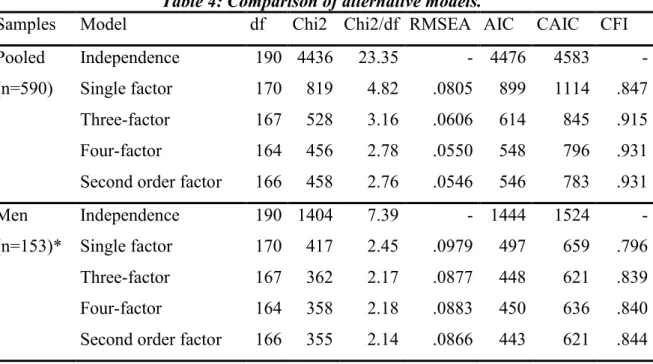
In order to globally evaluate the importance of the differences observed in the results of the principal components analysis, the four factor model based on Radloff´s results as well as the 3 factor model based on the principal components analysis of our data, were tested with the use of the Lisrel program using the data of each one of the samples and of the pooled sample, as well as for the subgroups of the men and of the women. The alternative model proposed by various authors (Sheehan et al., 1995; Lewinsohn et al., 1997), in which the four determined factors are considered to be dependent on a single second-order factor, as well as the single-factor model, were also studied. The results presented in Table 4 (Chi2 and RMSEA) for the pooled sample
generally suggest a reasonable fit of both the four-factor model and the four-factor model with a second order factor. The comparative analysis (keeping in mind all the indexes) confirms that these two models are clearly statistically superior to the single-factor model and slightly superior to the three-single-factor model. The results are very similar for samples A, B or C; therefore we did not present them here. However, there are important differences when we group the subjects depending on the gender. The three and four-factor models considered seem to only be a poor fit for the data relating to the subgroup of the men and the advantage in relation to the single factor model is small.
Table 4: Comparison of alternative models.
Samples Model df Chi2 Chi2/df RMSEA AIC CAIC CFI Pooled Independence 190 4436 23.35 - 4476 4583 - (n=590) Single factor 170 819 4.82 .0805 899 1114 .847 Three-factor 167 528 3.16 .0606 614 845 .915 Four-factor 164 456 2.78 .0550 548 796 .931 Second order factor 166 458 2.76 .0546 546 783 .931 Men Independence 190 1404 7.39 - 1444 1524 - (n=153)* Single factor 170 417 2.45 .0979 497 659 .796 Three-factor 167 362 2.17 .0877 448 621 .839 Four-factor 164 358 2.18 .0883 450 636 .840 Second order factor 166 355 2.14 .0866 443 621 .844
Women Independence 190 3465 18.24 - 3505 3607 - (n=446)* Single factor 170 1222 7.19 .118 1302 1506 .732 Three-factor 167 521 3.12 .0690 607 826 .892 Four-factor 164 481 2.93 .0660 573 808 .903 Second order factor 166 447 2.69 .0617 535 759 .914
* The sum is not correct because the information about the gender of one of the subjects is missing.
4. Correlation with the BDI and with the clinical interview
In study A the mean (+SD) of the CES-D score was 13.3 +9.9, with a median value of 11, and the mean of the BDI score was 6.7 +7.1, with a median value of 4. As is expected in symptomatic scales both distributions are very skewed, with a large proportion of low scores. Even though in both cases the answer to each item is quoted on a scale of 0 to 3, the means of the answers to the items are almost all less than 1. The Pearson’s correlation coefficient between the results of the two scales is of .80 (p< .0001).
In study B, the structured clinical interview allowed for the conclusion that 13% of the subjects of the sample met the criteria for a Major Depressive Episode at the time in which they answered the CES-D. 16% did not meet these criteria, but they met the criteria for Dysthymia. Finally, 5% of the subjects met only the criteria proposed by the DSM-IV for a Minor Depressive Episode. It was considered that the diagnoses of Minor Depressive Episode (1), Dysthymic Disorder (2) and Major Depressive Episode (3) define an ordinal scale, with the intensity of the depressive symptomatology in mind. Furthermore, each one of the symptoms included in the criteria of a Major Depressive Episode was classified as “absent”(0), “subthreshold”(1) or “present” (2).
The symptoms relating to Dysthymia were quoted in the same manner, but they were assigned a weight of .75. The sum of the scores obtained in this manner (“sum of clinical symptoms”) constitutes a quantitative evaluation of the importance of depressive symtomatology.
The Pearson’s correlation coefficient between the score on the CES-D with the diagnosis according to the DSM-IV criteria (considered as an ordinal scale) was of .71 (p<.0001) and with the sum of the depressive symptoms observed in the clinical interview it was of .76 (p<.0001)
The mean of the CES-D scores was of 13.4 in the non-depressed subjects, 24.0 in the subjects in which a Minor Depressive Episode was diagnosed, 26.5 in the cases of Dysthymia and 38.5 in the cases with a Major Depressive Episode. The ANOVA confirmed the global statistical significance of the differences between the four diagnosis groups (F=60.97; p< .000001) and the post-hoc comparison (Scheffé Test) of the means was significant (p<.001) in all the cases, with the exception of the comparison between Minor Depressive Episode and Dysthymia.
5.Definition of the cut-off point
As is already known, the choice of the cut-off point depends on the desired objectives. In Table 5, we indicate the sensitivity (percentage of clinical depressed cases with a score equal to or above the cut-off point) and the specificity (percentage of non-depressed cases below the cut-off point) values for various cut-off points. The diagnosis of any form of depressive disorder was used as criteria, but we also indicate the values relating to the diagnosis of Minor Depressive Episode and Dysthymia
(excluding the cases of Major Depressive Episode) and the values pertaining only to the diagnosis of a Major Depressive Episode.
Table 5: specificity and sensitivity as a function of cut-off score Cut-off score Maj.depr. +Dysthymia +Minor depr. (n=61) Dysthymia +Minor depr. (n=37) Maj.depr. episode (n=24)
specificity sensitivity specificity sensitivity specificity sensitivity Total (n=179) 19 .75 .87 .75 .78 .62 1.00 20 .78 .83 .78 .73 .66 1.00 21 .80 .80 .80 .68 .68 1.00 22 .81 .79 .81 .65 .70 1.00 23 .83 .75 .83 .62 .72 .96 24 .85 .74 .85 .59 .74 .96 25 .87 .74 .87 .59 .76 .96 26 .90 .69 .90 .51 .80 .96 27 .93 .66 .93 .49 .83 .92
With regards to the group of depressive disorders, it was verified that, considering a cut-off point of 20, the scale presents good specificity and sensitivity values: the probability that a subject with some form of depressive disorder obtains a score of less than 20 (“false negative”) is 16.4% and, vice-versa, the probability that a non-depressed patient obtains a score of 20 or more (“false positive”) is 22.0%. About 66% of the subjects with a score that is equal or above 20 are found to be clinically depressed. With the cut-off point at 25, this value increases to 75%, but the sensitivity decreases a lot. When we consider only the cases of Minor Depressive Episode, and of Dysthymia, the specificity values stay the same but the sensitivity decreases: that is, the percentage of false negatives increases.
If we only consider the cases in which a Major Depressive Episode was diagnosed, the sensitivity of the scale increases a lot, but it becomes preferable to define a higher cut-off point (26) so as to increase the specificity. With a cut-off point of 26 there is only 1 false negative. It is true that only 43% of the subjects with a score equal to or greater than 26 fulfil the criteria for a Major Depressive Episode, but another 35% fulfil the criteria for Dysthymia or a Minor Depressive Episode and only 22% are not clinically depressed. In order to increase the positive predictive value of the scale (the proportion of individuals identified as depressed who are actually depressed) it would be necessary to choose a much higher cut-off point, which affects the sensitivity to a great extent. In this way it is verified that 58% of the subjects with a score of equal to or greater than 32 fulfil the criteria for a Major Depressive Episode, but with this cut-off point the sensitivity decreases to .75.
The possible influence of sex and education level on the specificity and sensitivity was also studied. The results in relation to sex and education level are presented in Table 6. The occurrence of any form of depressive disorder was considered as criterion. The subjects with 9 or more years of schooling were included in the “higher education level” group.
Table 6: Specificity and sensitivity as a function of cut-off score, sex and education Cut-off score Men (n=52) Women (n=127)
Low education level (n=85)
High education level (n=94)
19 .85 .85 .70 .88 .65 .91 .82 .81 20 .85 .85 .75 .83 .67 .85 .87 .81 21 .85 .85 .77 .79 .67 .79 .90 .81 22 .85 .85 .78 .77 .69 .79 .90 .78 23 .85 .77 .82 .75 .75 .79 .90 .70 24 .87 .77 .84 .73 .78 .76 .90 .70 25 .92 .77 .85 .73 .82 .76 .91 .70 26 .95 .77 .87 .67 .84 .71 .94 .67 27 .97 .69 .91 .65 .88 .71 .97 .59
With the cut-off point at 20, the specificity is lower for the women, but considering a higher cut-off point affects the sensitivity a lot. In reality, as a whole, the correlation between the results of the CES-D and the sum of the symptoms evaluated in the clinical interview of the women (r = .71) is significantly less (Fischer z; p < .05) than that of the men (r = .85). In relation to the men, the data does not allow for a clear conclusion, given that the sensitivity and specificity values are identical for any cut-off point between 18 and 22 and the effective is in any way too reduced.
On the other hand, it is verified that the education level probably affects the results more than the gender. For subjects with a lower education level the specificity is less and it could be an advantage to make use of a higher cut-off point (23) in order to decrease the number of false positives. With a cut-off point of 20, the majority of the false positives (17 in a total of 26) are subjects with a low education level. In comparison with the correctly classified subjects, the Chi2 is of 4,01 (p< .05). (The same comparison in relation to gender is not statistically significant). This difference is not verified in the sensitivity and there is no significant difference (Fischer z; p = .640)
in the correlation between the CES-D results and the sum of the symptoms evaluated during the clinical interview in the groups with a low education (r = .77) and a high education (r = .74).
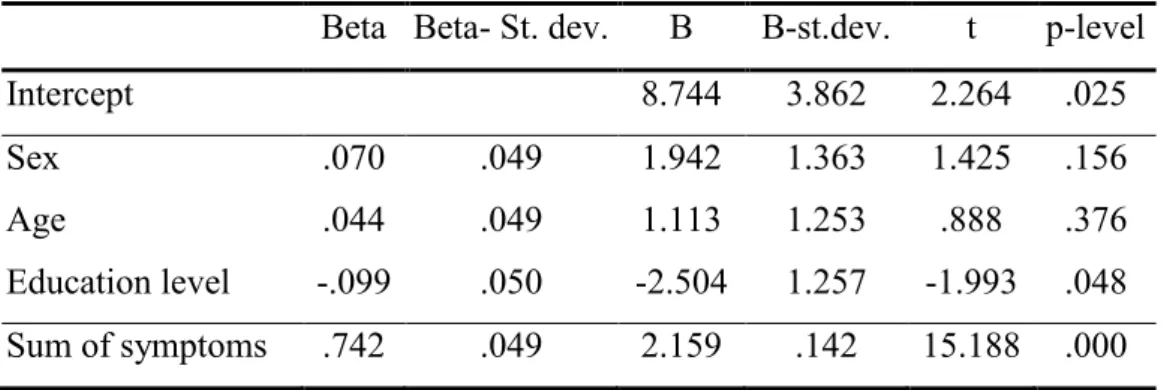
The regression analysis (Table 7) allows for the verification that the answers to the CES-D mainly depend on the frequency and intensity of the depressive symptoms evaluated in the clinical interview, but that the education level also has a significant effect. The subjects with a lower education level tend to obtain higher values on the CES-D for the same level of clinically evaluated symptom seriousness.
Table 7: Multiple Regression Analysis
Beta Beta- St. dev. B B-st.dev. t p-level
Intercept 8.744 3.862 2.264 .025
Sex .070 .049 1.942 1.363 1.425 .156
Age .044 .049 1.113 1.253 .888 .376
Education level -.099 .050 -2.504 1.257 -1.993 .048 Sum of symptoms .742 .049 2.159 .142 15.188 .000
The study of the results distribution allows for the verification that, in the non-clinical samples, the values 20 (sample A) or 21 (sample C) correspond to the lower limit of the upper quintile of scores, considered by the American studies as criterion for the cut-off point. On the other hand, in sample B, the percentage of subjects with the score of 25 or more (34.2%) is very close to the percentage of subjects suffering from some form of depressive disorder according to the criteria of the DSM-IV (34.1%).
The analysis of the internal consistency of the Portuguese version of the CES-D yielded a good result (Table 2). The various indicators calculated (alpha coefficient, inter-item correlations, and item-total correlations) generally reach values higher than those obtained by Radloff. The values obtained clearly confirm that we can consider that the instrument evaluates only one dimension and they confirm the reliability of the obtained results.
The total result of the factorial analysis with the parallel series method suggests that a three-factor solution would be the most adequate. Nevertheless, a 4 factor solution provides results which are very close to those obtained by Radloff who retained all the factors with eigenvalues >1.00. This agreement is mainly evident in the pooled sample and in sample C. Even though sample C only covers the age group of 35-65 years, it probably is the one with a composition which is most similar to the samples of the general population studied by Radloff.
Seeing that the 4 factor structure of the scale has not been found in all the studies, the fact that we found a different factorial structure would not constitute an objection against the validity of the Portuguese version. However, the fact that we did find a global agreement with the Radloff results supports this validity. With the verification of this global agreement it becomes possible to analyse the items in which there seems to be disagreement, in order to evaluate if that disagreement could possibly be attributed to translation problems. The results of that analysis are quite satisfactory, given that the only item where there seems to be almost total disagreement, item 13, is an item for which it was possible to obtain a literal translation and that does not present comprehension difficulties. To the contrary, for item 20, which was the one that
presented the greatest translation difficulties, the results of sample C and of the pooled sample are in accordance with those of Radloff.
We did not present the results of the factorial analysis with regards to sex or education level. The present study mainly aimed at discussing the validity of the Portuguese version of the CES-D. The analysis of the factorial structure characteristics of the CES-D in the Portuguese population will benefit with the inclusion of other samples, namely in order to evaluate the variations in relation to gender, given that our samples were mainly female and that the confirmatory factorial analysis suggests that the four-factor model is above all adequate for the female population, which is in accordance with the results of other studies (Posner et al., 2001).
Radloff did not consider the possibility of distinguishing 4 factors as an objection against the use of a total score, namely taking into consideration the strong total internal consistency. Our results follow the same path. The confirmatory factorial analysis of the model, grouping the items according to the factor in which they are most loaded, allows for the verification that these factors are found to be strongly related. The adequacy of the model that, apart from these factors, considers only one second-order factor (Table 4), confirms this perspective. Nevertheless, the possibility of distinguishing various factors can be kept in mind, namely in comparative studies between various groups.
The correlation with the results of the Beck Inventory obtained in study A seems to be good, given the structural difference of the two tests, and tends to confirm the validity of the CES-D results. Even though the possible maximum score is slightly higher in the Beck Inventory (63 versus 60 in the CES-D), the comparative analysis of the statistics presented show that the answers in the BDI tend to cluster more around the
lower values of the scale: the mean and the median are a lot lower, and the standard deviation is also lower. These results suggest that the Beck Inventory allows for less heterogeneity of the answers for the said population, and tends to confirm that the CES-D is a scale which is more adequate for use with the general population, even with subjects of a higher education level, probably being more sensitive to small variations in the depressive symptomatology.
Study B allows for the verification that a good correlation exists between the score obtained in the CES-D and the clinical diagnosis based on a structured interview, according to the criteria of the DSM-IV, which also tends to supports it’s validity. The scores obtained by the non-depressed subjects are significantly lower than those of the depressed subjects and, furthermore, the scale proved to be sensitive to the variations in the seriousness of the depressive disorder.
These results indicate that the scale can be used in a clinical setting, namely in the primary health care setting, as an instrument to detect the possible presence of depressive disorders. For this purpose, the use of a cut-off point of 20 seems adequate. This value is relatively “low” but seeing that the occurrence of “false positives” is less prejudicial than the occurrence of “false negatives”, the use of a higher cut-off point, that would decrease the sensitivity a lot, specially for cases of Dysthymia and of Minor Depressive Episode, does not seem advisable. To the contrary, the use of a lower cut-off value would tend to excessively increase the number of subjects to examine as possible cases: the percentage of subjects with a score of 19 or above is 26% in sample A, 27% in sample C, and 49% in sample B.
The education level and the gender seem to slightly affect the sensitivity and the specificity of the scale (Table 6). With subjects who have less than 9 years of
schooling, it may be preferable to use a slightly higher cut-off point (23). On the other hand, the number of “false positives” is slightly higher with women, for any cut-off point but, in this case, the use of higher cut-off point does not appear to be an advantage. In any way, the number of men in our sample is too small to verify if it would be useful to consider different cut-off points depending on the gender, as suggested by Fuhrer and Rouillon (1989) for the French version. It should be noted that these authors indicate slightly lower values of sensitivity (.76) and of specificity (.71) than those obtained by us, even when we consider the group of women separately.
The fact that the measures relating to the efficiency of the scale were generally lower for the women is that much more significant when, considering all the forms of depressive disorder, the base rate in women (38%) is greater than in men (25%), which would contrarily tend to inflate these measures (Coyne, 1994). This fact can partly be related with the frequency of depressive states with a less intense symptomatology in which the percentage of false negatives increases considerably, as we have seen. Effectively, the prevalence of Major Depressive Episodes is identical in the two genders (13%) but the prevalence of Minor Depressive Episodes, and mainly of Dysthymia, is greater in women: 6% and 19% respectively, versus 4% and 8% in the men. However, even with the exclusion of the cases with the diagnosis of Minor Depressive Episodes and of Dysthymia from the calculations, differences are still verified in the measures relating to the scale efficacy with regards to gender, even though they are less marked. The differences in the specificity of the scale in relation to the education level does not seem to be associated with the difference observed in the prevalence of the different forms of depressive disorder: the group with a low education level presents a slightly higher prevalence of Dysthymia (19% versus 13% in the group
with a higher education level) and of Major Depressive Episodes (16% versus 11%). The choice of a cut-off point depends on the desired objectives. If the objective is above all to detect the cases of Major Depression, a higher cut-off point (26) is advisable. In the same manner, for studies of an epidemiological nature it can be useful to keep in mind that the percentage of subjects with a score of 25 or more is practically identical to the percentage of subjects with some form of depressive disorder. That is: with this cut-off point, the number of “false negatives” tends to balance out the number of “false positives”. However, these results depend on the composition of sample B and should be used with caution. In a non-clinical population, the number of false positives would be relatively higher with the same sensitivity and specificity values.
We do not have epidemiological data for the Portuguese population and samples A and C are not representative of the general population. We can merely observe that the results obtained in these samples suggest that the scores of the CES-D in the general Portuguese population tend to be higher than those of the American population. More specifically, the percentage of subjects with a score of 25 or more in these samples is not incongruent with the general information available regarding the prevalence of depressive disorders.
REFERENCES
Berndt, D. (1990). Inventories and Scales. In Wolman B. and Stricker G. (Eds.), Depressive Disorders, Facts, Theories, and Treatment Methods (pp.255-274). New York: John Wiley and Sons.
Cheung, C. & Bagley, C. (1998). Validating an American scale in Hong-Kong: The Center for Epidemiological Studies Depression scale (CES-D). Journal of Psychology, 132 (2), 169-186.
Comstock, G. & Helsing, K. (1976). Symptoms of depression in two communities. Psychological Medicine, 6, 551-563.
Coyne, J. (1994). Self-Reported Distress: Analog or Ersatz Depression? Psychological Bulletin, 116 (1), 29-45.
Enzmann, D. (1997). RanEigen: A program to determine the parallel analysis criterion for the number of principal components. Applied Psychological Measurement, 21, 232. Fagulha, T., Duarte, M.E. & Miranda, M.J. (2000). A “qualidade de vida”: Uma nova dimensão psicológica? [“Quality of life”: a new psychological dimension?]. Psychologica, 25, 5-17.
First, M.B., Spitzer, R.L., Gibbon, M. & Williams J.B.W. (1997). User’s Guide for the Structured Clinical Interview for DSM-IV Axis I Disorders– Clinician Version (SCID-CV). Washington, DC: American Psychiatric Association
Frish, M. B. (1994). Manual and treatment guide for the Quality of Life Inventory. Minneapolis: National Computer Systems.
Fuhrer, R. & Rouillon, F. (1989). La version française de l’échelle CES-D (Center for Epidemiologic Studies – Depression Scale) : Description et traduction de l’échelle d’autoévaluation [The French version of CES-D: Description and translation of the self report scale]. Psychiatrie and Psychobiologie, 4, 163-166.
Guarnaccia, P., Angel, R. & Worobey, J. (1991). The factor structure of the CES-D in the Hispanic health and nutrition examination survey: The influences of ethnicity, gender and language. Social Science and Medicine, 29 (1), 85-94.
Hautzinger, M. (1988). Die CES-D Skala: Ein Depressionsmessinstrument für Untersuchungen in der Allgemeinbevölkerung [The CES-D scale: A depression-rating scale for research in the general population]. Diagnostica, 34 (2), 167-173.
Jordão, J. (1995). A medicina geral e familiar [General and family medicine]. Doctoral Thesis, Faculty of Medicine, University of Lisbon.
Lewinsohn, P., Seeley, J., Allen, N. & Roberts, R. (1997). Center for Epidemiologic Studies Depression Scale (CES-D) as a screening instrument for depression among community-residing older adults. Psychology and Aging, 12 (2), 277-287.
Radloff, L. (1977).The CES-D Scale: A Self-Report Depression Scale for Research in The General Population. Applied Psychological Measurement, 1(3), 385-401.
Serra, A.. & Abreu, J.(1973). Aferição dos quadros clínicos depressivos I.- Ensaio de aplicação do "Inventário Depressivo de Beck" a uma amostra portuguesa de doentes deprimidos [Adaptation of the depressive symptomatology I- Practice application of the
Beck Depression Inventory on a Portuguese sample of depressed patients]. Coimbra Médica, 20 (6), 623-644.
Sheehan, T. , Fifield, J., Reisine, S. & Tennen, H. (1995). The Measurement Structure of the Center for Epidemiologic Studies Depression Scale. Journal of Personality Assessment, 64 (3), 507-521.
Stroup-Benham, C., Lawrence, R. & Trevino, F.(1992). CES-D factor structure among Mexican American and Puerto Rican women from single- and couple-headed households. Hispanic Journal of Behavioral Sciences, 14 (3), 310-326.
Weissman, M., Sholomskas, D., Pottenger, M., Prusoff, B. & Locke, B. (1977). Assessing Depressive Symptoms in Five Psychiatric Populations: a Validation Study. American Journal of Epidemiology, 106, 203-214.