Predictors of Student Success in Higher Education:
Secondary School Internal Scores versus National Exams
*,†José Miguel Cerdeira
Nova School of Business and Economics, Universidade Nova de Lisboa
Luis Catela Nunes
Nova School of Business and Economics, Universidade Nova de Lisboa
Ana Balcão Reis
Nova School of Business and Economics, Universidade Nova de Lisboa
Maria do Carmo Seabra
Nova School of Business and Economics, Universidade Nova de Lisboa
ABSTRACTIn many countries entrance to higher education is determined by the performance of students in secondary school and/or the scores obtained in national exams. The relative weight of these two scores on the admission decision is a relevant policy topic, given its implication on who is admitted at the university. The purpose of this paper is to investigate the relative predictive power of these two measures on the academic performance of students in higher education. It makes use of a dataset of Bachelor students from Portuguese higher education institutions with detailed information about their characteristics and past achievement results. The measure of academic achievement considered is the Bachelor’s final average score. The main finding is that the scores given by teachers in secondary school are better predictors of subsequent performance than the access exam scores. The relevance of factors like working status, social support, and gender vary with the reputation of the degree and the type of higher education institution, university versus polytechnic. A noteworthy result is that the added predictive contribution of parents’ education is always negligible when past success measures are already taken into account.
Keywords: academic achievement; predictors of success; national exams; parents’ education
*
Corresponding author: Luis Catela Nunes, Nova School of Business and Economics, Universidade Nova de Lisboa, Campus de Campolide, 1099-032 Lisboa, Portugal. Emails: José Miguel Cerdeira - jmiguelcerdeira@gmail.com, Luís Catela Nunes - lcnunes@novasbe.pt, Ana Balcão Reis - abr@novasbe.pt, Maria do Carmo Seabra - carmo.seabra@novasbe.pt.
†
Acknowledgments: We acknowledge financial support from Fundação para a Ciência e Tecnologia (UID/ECO/00124/2013, PTDC/IIM-ECO/6813/2014, and Social Sciences Data Lab project 22209), POR Lisboa (LISBOA-01-0145-FEDER007722 and Social Sciences Data Lab project 22209), and POR Norte (Social Sciences Data Lab project 22209). We thank Direção-Geral de Estatísticas da Educação e Ciência for providing the data. We are indebted to two anonymous reviewers that contributed to improve the paper.
1
Introduction
The importance of higher education as a key to ensure an educated and skilled workforce together with an adequate level of technological improvement has been increasingly acknowledged over the last decades (OECD 2014). Countries allocate considerable and increasing amounts of resources to higher education, the average total expenditure on tertiary education having risen from 1.4% of GDP in 2005 to 1.6% in 2014 (OECD 2017). Also, according to OECD, around 45% of worldwide today’s young generation will graduate from higher education in the near future.
Hence, the question of admission to higher education and the definition of admission criteria is a relevant policy issue given that it determines who obtains access to higher education. The importance of this topic is highlighted by the recent publication by the European Parliament of a report discussing the consequences in terms of equity and intergenerational mobility of different requirements to access higher education (McGrath et al., 2014). Across OECD countries these requirements vary a lot, going from situations where the only condition is the secondary school diploma to another set of countries like Japan, for example, where specific entry exams are required.
From the point of view of the education system, the selection process, whenever selection is required, should be able to select those individuals most likely to be successful. Thus, it is important to know what predicts the success of students in higher education. Are national exams good predictors of academic success? Or is it that secondary school internal scores are sufficient predictors?
Most of the earlier research has found national exams to be an important predictor of academic success in higher education (Smith & Naylor, 2001; Horowitz & Spector, 2005; Smith & White, 2015). Regarding secondary school internal average
score, the answer is generally the same (Desjardins et al., 2002) on timely graduation, (Cassidy, 2012; Thiele, 2016; and Steenman et al., 2016) on university scores. However, not much research has been devoted to compare the relative relevance of secondary school internal average score and scores on national exams, the main topic of this paper.
In fact, the literature has been largely focused on the determinants of success, rather than on entry conditions. It is largely accepted that family background, commonly evaluated through the parents’ level of education, has a largely positive influence on educational outcomes at school (see Björklund & Salvanes, 2011). In higher education there is less certainty as to the effect of family background: while Smith & Naylor (2001) report that ‘academic performance at university is better the more 'advantaged' is the student's home background’, others (Tumen et al., 2008; Smith & White, 2015) find these effects to be ‘weak’ or ‘minor’.
Other factors that may influence academic performance in higher education have been studied in the literature. For the UK, Smith & Naylor (2001) report that attendance of a local education authority school (in comparison with an independent school), living at home (not being displaced), being married, studying full-time, and being female, are all characteristics that increase a student’s predicted performance. Horowitz & Spector (2005) confirm these results for a university in the US, for gender, and the effect of private schools, although they distinguish private schools from religious private schools, which in turn seem to have a positive effect on performance. Regarding the effect of school resources, McNabb et al. (2002) state that, although ‘higher staff-student ratio and library expenditure (per student) are found to increase student performance […] higher total expenditure per student does not necessarily enhance academic
achievement’. Looking at social support, Marcenaro & Navarro (2007) have found a positive influence of social scholarships on academic achievement. [1]
In this study we focus on entrance to higher education requirements, considering the following questions: For students enrolled in a particular degree, what are the predictors of their final score? In particular which of the scores, internal secondary school versus national exams’, has a higher predictive power on the academic performance of students in higher education? We analyse these questions including also the predictors of success commonly considered in the literature. We do this by looking at the Portuguese higher education system, briefly described on the next section.
The Portuguese Higher Education System
Higher education institutions in Portugal are divided into universities and polytechnics. While both of them offer Bachelor and Masters degrees, only universities can offer PhDs. Also, universities are required to pursue research, while polytechnics are not. Traditionally, polytechnics are specialized in less theoretical and more labour market oriented degrees, although they are not necessarily restricted to those subjects. Furthermore, these institutions also tend to have a greater presence in less populated areas, while universities are found only in relatively more populated cities.
The standard duration of a Bachelor degree is between three and four years depending on the area of studies. Access to a Bachelor degree is different for public and private institutions. In public institutions, the number of vacancies in each degree is pre-determined by the government and students are allocated through a centralized procedure. Students are allocated by the central government to public institutions according to their access scores. Students rank their six preferred options (each option is one degree in one institution) and are then ranked for each degree according to their
access score.[2] This access score is a weighted average of the student’s secondary school internal average score (worth 50% to 65%) and the scores on national exams on one or two subjects (worth 35% to 50%).[3] The secondary school internal average score is the average of the scores obtained in all courses taken between the 10th and 12th grade. The same rules apply to students coming from the academic track and from the professional/vocational track. Private institutions usually also require national exams and secondary school internal scores, but they are free to determine their own entry criteria and these vary widely amongst institutions.
Tuition fees in Portuguese higher education are around 1,000 Euros per year in public institutions, and considerably higher in private institutions. Still, for those who cannot afford such costs, there are scholarships for which students apply based on family income. Moreover, to maintain these scholarships, students must complete at least 60% of the courses they have signed up for in the previous year, and they must finish the degree up to no more than one year later than the standard duration (two years if the degree exceeds three years of duration).
Data
In this study we use an administrative database including the 44,758 students that completed their Bachelor degrees in Portuguese higher education institutions (universities and polytechnics) in the year 2012.[4] This database was linked to another administrative database with information on secondary school internal scores and national exams scores since 2006. Therefore, we had to drop from our analysis students that took their national exams before 2006, corresponding to 5.6% of the observations.
Because of recording errors in these databases, namely invalid student IDs, we were not able to obtain secondary school data for a number of students. We were also
relatively demanding in terms of data consistency across databases. As a consequence we lost an additional 25% of the original dataset. We checked for the incidence of linkage errors and verified that it is not concentrated on any specific type of degrees or institutions. Thus, we believe that this loss is not systemically related with any of the characteristics of the degrees and institutions analysed.
Finally, we eliminated students that were transferred from other higher education institutions because their final GPA was obtained in different degrees with non-comparable criteria. We also only include students that came directly from secondary school, without any interruptions (these interruptions are not common in Portugal).
Given the above constraints, the final dataset contains 23,632 observations. We also note that since our dataset only includes graduating students (that finished on time or with a delay), we are not considering students that dropped out.[5] In summary, the final dataset only includes students that came directly from secondary school, without any interruptions, and that were not transferred.
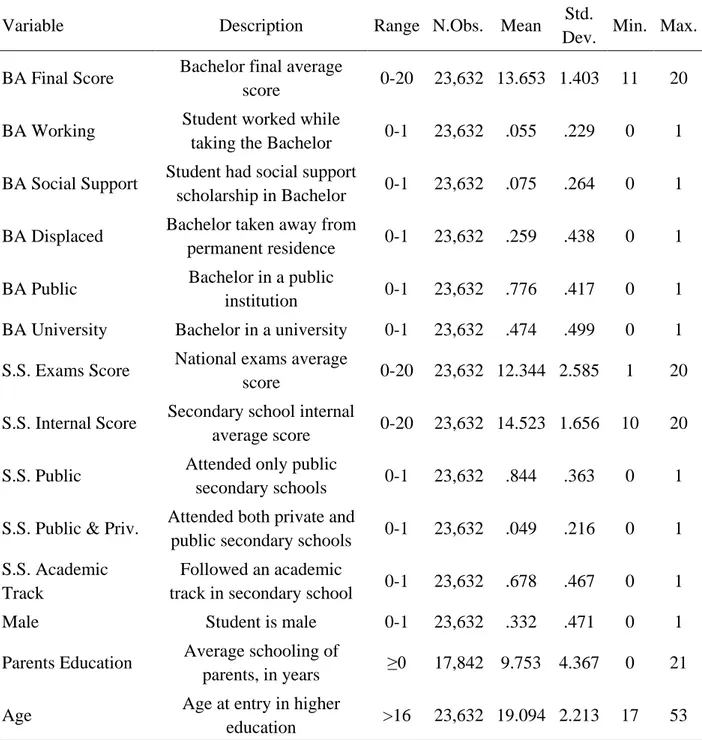
For each student in the dataset there is information on: 1) success measure – Bachelor final average score; 2) academic information about achievement in secondary schooling – secondary school internal average score; mean score in the national exams; type of secondary schools attended (private, public, or both); type of curriculum pursued in secondary school (academic or professional/vocational track); 3) individual and socio-economic characteristics – gender; age; parents’ education; if the student was displaced; if she/he received social support; and working status; and 4) higher institution characteristics – whether the institution is public or private; and whether it is a university or a polytechnic. Some descriptive statistics of these variables are presented in Table 1.
[Insert Table 1]
The mean of the Bachelor final average score is 13.7 on a scale of 0 to 20 (passing grade is 10). The mean scores at, respectively, secondary school and the national exams taken in the year before entering higher education were 14.5 and 12.3 also on a scale of 0 to 20. During their secondary school years 84% of the students attended public secondary schools, 11% attended private schools, and 5% studied in both types. Moreover, 68% of the students were on an academic track in secondary school while the rest came from other curricula, which includes vocational and professional tracks. Only 33% of the graduates are male, with an average of 19 years of age when entering higher education. About 46% of the students had parents who completed higher education, and the average number of schooling years of their parents is around 10.[6] Also, 26% of these students were displaced from their permanent residence, 7.5% received a social support scholarship, and 5.5% of them worked while studying. Finally, 78% of the students graduated from public institutions and 47% from universities (53% came from polytechnics).
Methodology
In order to analyse the predictive factors of students’ Bachelor final average score a linear regression model is estimated. We adopt a value-added specification that considers education as a cumulative process. The estimated regressions include contemporaneous inputs and lagged success measures that capture ability and accumulated human capital, as well as other family and school inputs not explicitly included as regressors. An assumption of this approach is that the effects of past inputs
that are not included as regressors are completely captured by the past success measures (see Todd & Wolpin, 2003). This is the usual approach in the education production function literatures as can be seen for instance in Hanushek and Rivkin (2010) and Rivkin et al. (2005). As metioned in the latter study, “the inclusion of initial achievement as a means to account for past inputs reduces dramatically the likelihood that omitted historical factors introduce significant bias.”
To accommodate for different grading policies and different student bodies in each university department, the dependent variable analysed is the deviation of a student’s score from the corresponding mean of final scores in her/his degree. This approach is equivalent to estimating a model for the final score including fixed effects at the degree level. The independent variables considered are the following: Secondary school internal average score and national exams scores, gender, working status, social support, being displaced, coming from a public secondary school, coming from both public and private schools, academic track, and parents’ education (see Table 1).[7]
Since there are differences in the distributions of the internal school scores and the national exams scores, to be able to compare the corresponding estimated coefficients we have opted to standardize all student score variables: the two predictors, secondary school internal scores and national exams scores, and the dependent variable, the Bachelor’s final score. The regression model is then estimated by Ordinary Least Squares. Estimation results are presented in the next section.
Results
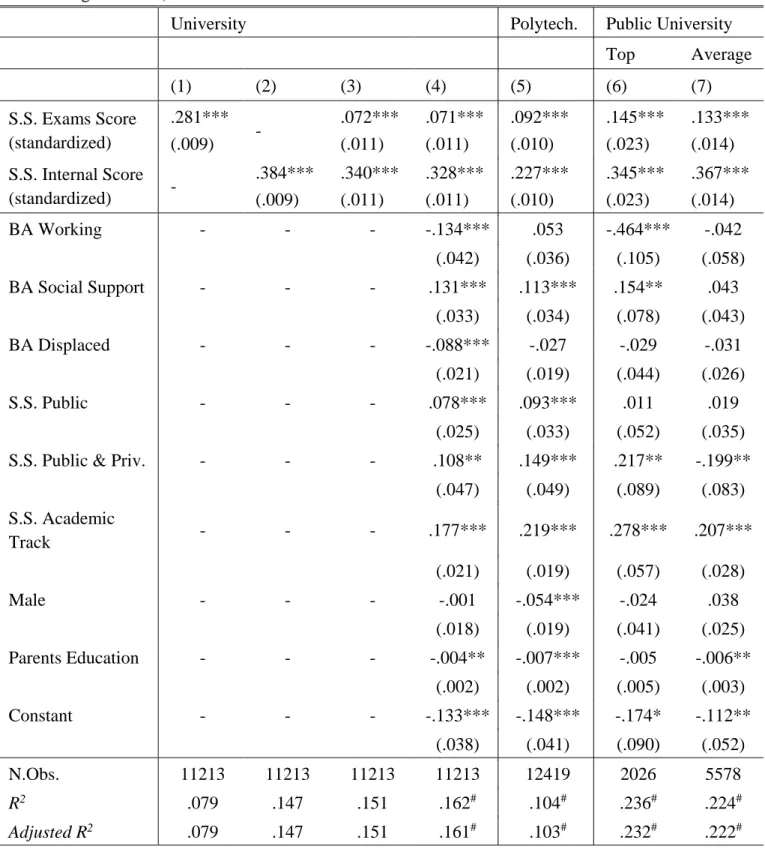
Various specifications are considered for the linear regression model. Results are presented in Table 2. The first step to test the predictive capability of the national exam score and compare it with secondary school internal average score was to regress the
Bachelor final average score on each of these variables, both separately and simultaneously.[8][9] Then, several other control variables were included as regressors. For polytechnics only the results for this latter specification are presented, as the results for the other specifications are similar to those obtained for universities. Separate regressions for degrees in public universities with different reputation levels were also run. Different reputation levels were proxied by the access score of the last student admitted: degrees with a minimum access score above 15 (Top) and degrees with a minimum access score less than or equal to 15 (Average).[10][11]
[Insert Table 2]
Key Results
For university degrees, looking at the first three specifications, one can notice that both national exams score and secondary school internal average score are statistically significant. Nevertheless, the latter always explains more of the variation in the higher education final score: 14.7% versus 7.9%.[12] According to the model in column 3, an increase of one standard deviation (SD) in the national exams score increases the predicted higher education final score by 0.07 SD, while an increase of one SD of the internal average score leads to a 0.34 SD increase in the predicted higher education final score. Results of the corresponding regression for polytechnics are not shown, but are very similar. When additional controls are included (column 4), the explained variation does not increase much: the R2 goes from 15.1% to 16.2%. Also, the coefficients for the national exams score and the secondary school internal average score remain almost unchanged in comparison with the model without these controls (column 3).
Other Results
Comparing the results for university and polytechnic degrees (models in columns 4 and 5), we see that gender is significant only in this last case, while the student’s working status and being displaced matter only for university students. Social support is significant and positive for both cases. Having been in a public school in secondary school increases the predicted higher education final score in comparison with having completed secondary school in a private school. Coming from an academic track leads to a large increase on the predicted performance, and is similarly relevant for both types of higher education. Finally, although the parents’ education is significant, having more educated parents decreases the predicted performance, although by a small amount, both for university and polytechnic degrees.[13]
In the models in which public universities are divided in top and average degrees, shown in columns 6 and 7, our previous results are confirmed: both national exams score and secondary school internal average score are statistically significant, the secondary school internal average score being a much stronger predictor of the higher education final score. In addition, we find that for top degrees working while studying decreases the predicted performance, while receiving social support increases the predicted performance.
Discussion
We now discuss the results presented above. Our main finding is that secondary school internal scores are a stronger predictor of success at higher education than the scores obtained by students on national exams.[14] This has considerable educational policy implications, given that in many systems entrance into higher education depends on
these two scores. Our result suggests that a higher weight of internal scores relative to national exams could improve the matching between students and degrees, thereby promoting the overall success of the students’ population.
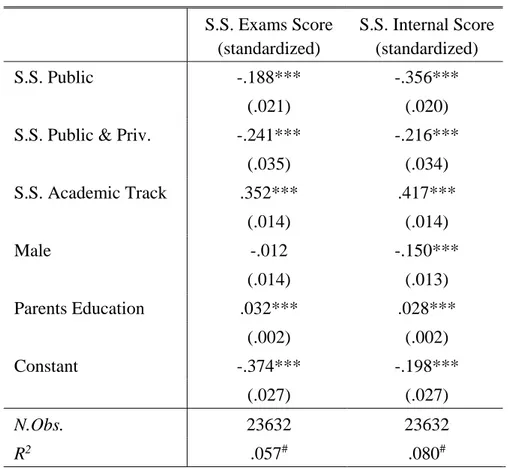
A surprising result regards the predictive power of parents’ level of schooling on performance in higher education. The results from the estimations show that this predictive power is either not significant or slightly negative, contrary to the literature on lower levels of education. A possible explanation for these results is that in our analysis we control for the access score which, in turn, captures the above mentioned effects on secondary education. In order to verify whether this explanation is reasonable, two additional models are estimated. The results, presented in Table 3, confirm this hypothesis: Parents’ education is positively associated with secondary school internal average score and with the national exams score, suggesting that family background is related with achievement in higher education in an indirect way, through the success at the end of secondary schooling, and also through allocation into degrees. The effects of the schooling of parents are entirely absorbed during the previous stages of education, much like Smith & White (2015) have mentioned in relation to a different measure of family background: ‘In contrast with attainment during the earlier phases of education, the relationship with occupational class was relatively weak’.
[Insert Table 3]
Students’ individual conditions, such as being displaced or working, affect differently students’ predicted academic achievement: working students perform more poorly, while being displaced does not seem to be relevant for students’ predicted performance. However, there are some differences according to the type and reputation
of the institutions attended by students. The working status is only significant for students in top university degrees, possibly because these are more demanding and time-consuming.
Also, students with social support perform better, confirming the results obtained by Agasisti and Murtinu (2014). However, this is only observed for students in top degrees. This can be explained by the rules regulating the maintenance of such support that motivate students to perform well.[15]
Male students seem to perform as well as their female counterparts when it comes to success in scores, except in polytechnics, where they have slightly lower scores. This seems to accommodate the possibility that gender differences are concentrated in some areas and in some types of tasks or evaluation, as suggested by Richardson and Woodley (2003): differences might result from ‘the different experiences of particular groups of men and women when studying particular subjects’.
Coming from an academic track substantially increases the students’ predicted performance, and by a similar magnitude, for both polytechnics and universities, and for top or average degrees. This result may be unexpected, as supposedly an academic track should be more in line with the curriculum of a university student, relative to a student in a polytechnic. However, this may also be explained as a result of the selection of students into different tracks.
Regarding having studied in private or public secondary schools, the results are not conclusive, although revealing a small advantage for students with a public schooling background. Finally, there is the case of students coming from both public and private secondary schools. The results in this case are unclear, as it seems that these students are better performers in top degrees, while performing more poorly in average ones. This could imply that students that move between private and public schools in
secondary education and enter in average degrees are different from the ones that do so and enter in top degrees. In the first case, our results could be detecting a ‘poor performer’ signal, while in the latter the coefficient could be capturing a situation where students try to change to a school with less demanding internal grading, so that they can reach the access score necessary for their top higher education choice. In any case, these issues require further study.
Conclusion
Our main finding, that the scores given by teachers throughout secondary education are better predictors of success at higher education than scores in national exams, has policy implications given that in many educational systems decisions on access to higher education are based on these different types of evaluations. This does not imply that national exams are irrelevant: both internal grades and final exam scores are publicly disclosed, so it is likely that the internal grades given by teachers take into account the expected performance of students on those exams; furthermore the incentives to work hard faced by students throughout secondary education are also determined by the existence of those national exams.
This research comes with a limitation regarding the sample used: the population of students that graduated. An extension of this work could consider other measures of success, like being able to complete the degree versus dropping out. Furthermore, it would be interesting to include some measure of success in the labour market after graduation. However, this analysis requires additional data.
Another interesting extension would be to analyse whether the predictive power of secondary school scores is higher (lower) for institutions/degrees for which a higher (lower) weight is assigned to individual secondary school scores. Also, analysing
whether scores on particular subjects that are taken into consideration for admission purposes are more predictive for future success than scores on subjects which are not taken into account would increase the policy relevance of our conclusions as it could improve the screening methods. Again, research on these topics requires further data, not available at the moment.[16]
References
Agasisti, T., & Murtinu, S. (2013). Are we wasting public money? No! The effects of grants on Italian university students’ performances. IEB Working Paper N. 2013/033.
doi:10.2139/ssrn.2340397
Alves, D. M. (2014). Determinants of success of Nova SBE’s undergraduate students, Master’s thesis, Nova School of Business and Economics.
Björklund, A., & Salvanes, K. G. (2011). Education and family background: Mechanisms and policies. Handbook of the Economics of Education, 3(3), 201-247. doi: 10.1016/B978-0-08-044894-7.01230-6
Cassidy, S. (2012). Exploring individual differences as determining factors in student academic achievement in higher education. Studies in Higher Education, 37(7), 793-810. doi:10.1080/03075079.2010.545948.
DesJardins, S. L., Ahlburg, D. A., & McCall, B. P. (2002). A temporal investigation of factors related to timely degree completion. The Journal of Higher Education, 73(5), 555-581. doi:10.1023/a:1013022201296.
Hanushek, E. A., & Rivkin, S. G. (2010). Generalizations about using value-added measures of teacher quality. The American Economic Review, 100(2), 267-271. doi: 10.1257/aer.100.2.267.
Horowitz, J. B., & Spector, L. (2005). Is there a difference between private and public education on college performance?. Economics of Education Review, 24(2), 189-195.
doi:10.1016/j.econedurev.2004.03.007.
Lopes, M.C. & Fernandes, G.L. (2011). Interruptions and Failure in Higher Education: evidence from ISEG-UTL, European Educational Research Journal, 10(3), 445-460. doi:10.2304/eerj.2011.10.3.445.
Marcenaro Gutierrez, O. D., & Navarro Gomez, M. L. (2007). Success in university: a quantilic approximation. Revista de Economia Aplicada, 15(44), 5-39. doi: 10.1080/03610926.2016.1222433.
McGrath, C. H., Henham, M. L., Corbett, A., Durazzi, N., Frearson, M., Janta, B., Kamphuis, B., Katashiro, E., Brankovic, N., Guerin, B., Manville, C. & Schweppenstedde, D. (2014). ‘Higher Education entrance qualifications and Exams in Europe: a Comparison’, Brussels: European Parliament, IP/B/CULT/IC/2013_007.
McNabb, R., Pal, S., & Sloane, P. (2002). Gender differences in educational attainment: The case of university students in England and Wales. Economica, 69(275), 481-503. doi:10.1111/1468-0335.00295.
OECD (2014). The State of Higher Education 2014, The OECD Higher Education Programme (IMHE), Paris.
OECD (2017). Education at a Glance: OECD Indicators, OECD Publishing, Paris. doi:10.1787/eag-2017-en.
Richardson, J. T., & Woodley, A. (2003). Another look at the role of age, gender and subject as predictors of academic attainment in higher education. Studies in Higher
Education, 28(4), 475-493. doi:10.1080/0307507032000122305.
Rivkin, S. G., Hanushek, E. A., & Kain, J. F. (2005). Teachers, Schools, and Academic Achievement. Econometrica, 73(2), 417-458. doi:10.1111/j.1468-0262.2005.00584.x.
Smith, E., & White, P. (2015). What makes a successful undergraduate? The relationship between student characteristics, degree subject and academic success at
university. British Educational Research Journal, 41(4), 686-708.
doi:10.1002/berj.3158.
Smith, J., & Naylor, R. (2001). Determinants of degree performance in UK universities: a statistical analysis of the 1993 student cohort. Oxford Bulletin of Economics and
Statistics, 63(1), 29-60. doi:10.1111/1468-0084.00208.
Steenman, S. C., Bakker, W. E., & van Tartwijk, J. W. (2016). Predicting different grades in different ways for selective admission: disentangling the first-year grade point
average. Studies in Higher Education, 41(8), 1408-1423.
doi:10.1080/03075079.2014.970631.
Thiele, T., Singleton, A., Pope, D., & Stanistreet, D. (2016). Predicting students' academic performance based on school and socio-demographic characteristics. Studies
in Higher Education, 41(8), 1424-1446. doi:10.1080/03075079.2014.974528.
Todd, P. E., & Wolpin, K. I. (2003). On the specification and estimation of the production function for cognitive achievement. The Economic Journal, 113(485). doi:10.1111/1468-0297.00097.
Tumen, S., Shulruf, B., & Hattie, J. (2008). Student pathways at the university: Patterns and predictors of completion. Studies in Higher Education, 33(3), 233-252.
doi:10.1080/03075070802049145.
Table 1. Descriptive statistics
Variable Description Range N.Obs. Mean Std.
Dev. Min. Max. BA Final Score Bachelor final average
score 0-20 23,632 13.653 1.403 11 20 BA Working Student worked while
taking the Bachelor 0-1 23,632 .055 .229 0 1 BA Social Support Student had social support
scholarship in Bachelor 0-1 23,632 .075 .264 0 1 BA Displaced Bachelor taken away from
permanent residence 0-1 23,632 .259 .438 0 1 BA Public Bachelor in a public
institution 0-1 23,632 .776 .417 0 1 BA University Bachelor in a university 0-1 23,632 .474 .499 0 1 S.S. Exams Score National exams average
score 0-20 23,632 12.344 2.585 1 20 S.S. Internal Score Secondary school internal
average score 0-20 23,632 14.523 1.656 10 20 S.S. Public Attended only public
secondary schools 0-1 23,632 .844 .363 0 1 S.S. Public & Priv. Attended both private and
public secondary schools 0-1 23,632 .049 .216 0 1 S.S. Academic
Track
Followed an academic
track in secondary school 0-1 23,632 .678 .467 0 1 Male Student is male 0-1 23,632 .332 .471 0 1 Parents Education Average schooling of
parents, in years ≥0 17,842 9.753 4.367 0 21 Age Age at entry in higher
education >16 23,632 19.094 2.213 17 53
Table 2. Predictors of Bachelor’s final score (standardized deviations of scores from degree means)
University Polytech. Public University
Top Average (1) (2) (3) (4) (5) (6) (7) S.S. Exams Score (standardized) .281*** (.009) - .072*** (.011) .071*** (.011) .092*** (.010) .145*** (.023) .133*** (.014) S.S. Internal Score (standardized) - .384*** (.009) .340*** (.011) .328*** (.011) .227*** (.010) .345*** (.023) .367*** (.014) BA Working - - - -.134*** .053 -.464*** -.042 (.042) (.036) (.105) (.058) BA Social Support - - - .131*** .113*** .154** .043 (.033) (.034) (.078) (.043) BA Displaced - - - -.088*** -.027 -.029 -.031 (.021) (.019) (.044) (.026) S.S. Public - - - .078*** .093*** .011 .019 (.025) (.033) (.052) (.035) S.S. Public & Priv. - - - .108** .149*** .217** -.199**
(.047) (.049) (.089) (.083) S.S. Academic Track - - - .177*** .219*** .278*** .207*** (.021) (.019) (.057) (.028) Male - - - -.001 -.054*** -.024 .038 (.018) (.019) (.041) (.025) Parents Education - - - -.004** -.007*** -.005 -.006** (.002) (.002) (.005) (.003) Constant - - - -.133*** -.148*** -.174* -.112** (.038) (.041) (.090) (.052) N.Obs. 11213 11213 11213 11213 12419 2026 5578 R2 .079 .147 .151 .162# .104# .236# .224# Adjusted R2 .079 .147 .151 .161# .103# .232# .222#
Notes: *, **, *** denote 10%, 5%, and 1% statistical significance, respectively; # mean value over 20
imputations. In columns (6) and (7), Top denotes degrees with a minimum access score above 15 while Average denotes degrees with a minimum access score less than or equal to 15.
Table 3. Predictors of the (standardized) components of the access score when applying for a Bachelor S.S. Exams Score (standardized) S.S. Internal Score (standardized) S.S. Public -.188*** -.356*** (.021) (.020)
S.S. Public & Priv. -.241*** -.216***
(.035) (.034) S.S. Academic Track .352*** .417*** (.014) (.014) Male -.012 -.150*** (.014) (.013) Parents Education .032*** .028*** (.002) (.002) Constant -.374*** -.198*** (.027) (.027) N.Obs. 23632 23632 R2 .057# .080#
Notes: *, **, *** denote 10%, 5%, and 1% statistical significance, respectively; # mean value over 20 imputations.
Endnotes
[1] There are some studies relative to Portugal but they only analyse students of one degree in one specific school (see Alves, 2014, Lopes et al, 2011)
[2] The system does not attribute any bonus to the preferred options: thus there is no room for strategic behavior in the ordering of preferences.
[3] Higher education institutions choose the subjects whose national exams (one exam per subject) are taken into consideration for admission purposes. Yet, the exams are all centralized.
[4] These databases are maintained by DGEEC, the Directorate-General of Statistics for Education and Science - Portuguese Ministry of Education. The data, anonymized, are available from the Ministry of Education upon request.
[5] The rate of dropout in the first year of university was 9.8% in 2013.
[6] Around 25% of the observations had missing values relative to parents' schooling level. In models including this variable as a predictor we used multiple imputations to estimate the missing values.
[7] Since for 30% of the observations information regarding parents’ education was missing the Stata multiple imputation package was employed to estimate these values.
[8] The correlation between the secondary school internal average score and the national exams average score is about 65%.
[9] One should be careful not to interpret these estimations as implying any causal relationship.
[10] A degree with a better reputation will have a greater demand and thus have a higher minimum access score.
21
[11] We checked for multicollinearity by calculating the variance inflation factor. We always obtained values for this statistic below 1.7, which, given the threshold of 10 recommended in the literature, allows us to conclude that multicollinearity is not an issue in our regressions.
[12] For polytechnic degrees the respective numbers are 8.2% versus 4.5%
[13] Using the university regression as example, this means that the difference between a student whose parents had primary schooling (4 years) and a student whose parents had higher education (16 years) translated into -0.048 SD in the final score, which is a very small change.
[14] This is in line with the finding of Alves (2014), for students of Economics and Management.
[15] To maintain this support, students must complete a specific number of courses each year and graduate in a number of years determined according to the established duration of the degree.
[16] We thank an anonymous referee for these two suggestions.
22