Structure and biology of the southern component of blue whiting
(Micromesistius poutassou) population in Northeast Atlantic
Doutoramento em Ciências do Mar
Patrícia de Jesus Gonçalves
Tese orientada por:
Professor Doutor Henrique N. Cabral (FCUL/MARE) Doutor António Ávila de Melo (IPMA)
Documento especialmente elaborado para a obtenção do grau de doutor
2017
UNIVERSIDADE DE LISBOA FACULDADE DE CIÊNCIAS
Structure and biology of the southern component of blue whiting
(Micromesistius poutassou) population in Northeast Atlantic
Doutoramento em Ciências do Mar
Patrícia de Jesus Gonçalves
Tese orientada por:
Professor Doutor Henrique N. Cabral (FCUL/MARE) Doutor António Ávila de Melo (IPMA)
Júri: Presidente:
● Doutor Pedro Miguel Alfaia Barcia Ré, Professor Associado com Agregação Faculdade de Ciências da Universidade de Lisboa
Vogais:
● Doutor Pedro Miguel Raposo de Almeida, Professor Auxiliar Escola de Ciências e Tecnologia da Universidade de Évora; ● Doutor Karim Erzini, Professor Associado com Agregação Faculdade de Ciências e Tecnologia da Universidade do Algarve; ● Doutor António Manuel Cunha Ávila de Melo, Investigador Instituto Português do Mar e da Atmosfera -IPMA, Orientador;
● Doutor Pedro Miguel Alfaia Barcia Ré, Professor Associado com Agregação Faculdade de Ciências da Universidade de Lisboa;
● Doutor Leonel Paulo Sul de Serrano Gordo, Professor Auxiliar com Agregação Faculdade de Ciências da Universidade de Lisboa.
Documento especialmente elaborado para a obtenção do grau de doutor
iii
Centro de Ciências do Mar e do Ambiente (MARE) Faculdade de Ciências, Universidade de Lisboa (FCUL)
Instituto Português do Mar e da Atmosfera (IPMA) Departamento do Mar e Recursos Marinhos
Divisão de Modelação e Gestão de Recursos da Pesca
Programa Nacional de Amostragem Biológica (PNAB) do IPMA
Fundação para a Ciência e Tecnologia – Bolsa de Doutoramento (SFRH/BD/88092/2012) Copyright © Patrícia de Jesus Gonçalves, Faculdade de Ciências, Universidade de Lisboa.
v
“A good traveller has no fixed plans and is not intent upon arrive. A good artist lets his intuition lead him wherever it wants. A good scientist has freed himself of concepts and keeps his mind open to what is.”
vii
O meu especial agradecimento a todas as pessoas, que ao longo destes anos, me acompanharam e fizeram comigo parte desta viagem. Este trabalho é como tal, o somatório do contacto com todas essas pessoas maravilhosas com quem parti-lhei este caminho. Das quais destaco:
O Alberto Murta, por me ter desafiado em determinada fase da minha vida ci-entífica a estudar o verdinho e começar esta viagem. Foi e será sempre uma grande inspiração para mim. Recordo o amigo, orientador, investigador e mes-tre com muita saudade. Esta tese mais do que um caminho percorrido, é-lhe dedicada por um dia me ter feito prometer que nunca desistisse.
O Henrique Cabral, por ter seguido comigo nesta viagem e me ter motivado a continuar, por me ter orientado, aconselhado e acompanhado nas várias fases deste trabalho. Pela sua disponibilidade constante, pelo apoio e bons conselhos ao longo deste percurso. E por ter garantido sempre todas as condições necessá-rias à plena execução desta tese, no papel de director do MARE.
O António Ávila de Melo, por ter aceitado participar nesta viagem como orien-tador, pelo voto de confiança e por ter estado sempre disponível no acompa-nhamento de todo o trabalho. Pelas interessantes conversas, pelas partilhas, pe-la motivação e por todo apoio ao longo deste caminho.
A Ana Moreno, pelo apoio e motivação ao longo deste percurso, por me garan-tir e proporcionar todas as condições à boa execução deste trabalho e integração no âmbito dos trabalhos do IPMA.
A Manuela Azevedo, por ter sempre apoiado o meu trabalho ao longo destes anos e me ter proporcionado todas as condições para a sua realização no âmbito do PNAB. Pela partilha de conhecimentos e pela confiança em me lançar sem-pre novos desafios.
A Fundação para a Ciência e Tecnologia pela bolsa de doutoramento que possi-bilitou a execução desta tese e pelo financiamento da minha deslocação ao IFREMER (Boulogne-sur-Mer) para realização da análise de morfologia dos otó-litos.
viii
recolha de dados, na leitura de idades ao longo destes anos. À Sandra por em-barcar comigo nesta vontade recente de saber sempre mais sobre o crescimento e validação de idades e pelas nossas conversas e partilha de ideias.
A Maria Ana, por ter sido minha mestre na área da genética, por todo o conhe-cimento transmitido, pelo apoio, pela ajuda, disponibilidade constantes no acompanhamento das várias fases do último trabalho desta tese.
A Ana Cláudia e o Nuno, pela colaboração na preparação e análise dos dados de rejeições do verdinho e pela disponibilidade e interesse constantes na cola-boração para a melhoria da amostragem desta parte das capturas.
Aos colegas Corina, Bernardo, Pedro L., Eduardo, Paula, Adelaide, Rui C., Carmo, Andreia, pelo apoio e colaboração.
Os colegas do IFREMER, ao Kélig, à Celina e ao Romain pelo apoio, pela cola-boração e pela forma acolhedora como me receberam.
Os colegas da FCUL, Vanessa, Mónica, Irina e Patrick por todo o apoio ao longo dos dias que passei no laboratório do C2.
Os colegas do grupo de trabalho do ICES (WGWIDE), pelo apoio, colaboração e discussão de ideias como uma boa fonte de aprendizagem. E pelo voto de con-fiança quando me convidaram para “data stock coordinator” do verdinho. Ao Morten por toda a colaboração. À Anna pelo apoio, pelas conversas, partilhas cientificas e companhia. À parte espanhola da comitiva ibérica (Manolo, Ger-som, Pablo, Sónia, Alfonso e Rosário) pelo apoio, companhia e partilha de bons momentos.
Os colegas do ICES, que me desafiaram a ser “chair” do “Inter-benchmark pro-tocol” do verdinho em 2016 mais uma vez demonstrando total confiança. E ao Morten, ao Rick, à Asta e ao Thomas no apoio que foi fundamental para a con-cretização de todos os objectivos a que nos tínhamos inicialmente proposto. A Jane, que embarcou comigo na viagem de “co-chair” do workshop de idades do verdinho (WKARBLUE2), pela partilha, companheirismo que fez com que este decorresse de forma simples, organizada e objectiva apesar de todos os de-safios. E parece que esta viagem se irá repetir!
ix
A Laura, companheira de sala e amiga com quem partilhei dúvidas e bons mo-mentos e me acompanhou ao longo destes anos.
Os colegas e amigos do IPMA, em especial à Sílvia, Rula, Aninhas, Juan, Pedro, Rui, por acompanharem e me apoiarem muito antes de esta tese ter sequer co-meçado.
Os demais colegas e amigos com que tive e tenho o prazer de trabalhar e convi-ver neste (já longo!) percurso pelo IPMA.
A todas as minhas amigas e amigos (um grande abraço!) pela força, pelo cari-nho, pelas nossas boas conversas e boa disposição com que nos divertimos nos momentos “off-tese”.
A minha família, por ser sempre o porto de abrigo!
Os meus pais, por sempre me apoiarem e alimentarem o meu entusiasmo na partilha de bons momentos durante este percurso!
O Victor, companheiro de vida, que esteve sempre comigo de forma incansável e fez ele também esta viagem!
xi
Blue whiting (Micromesistius poutassou) is a mesopelagic gadoid widely distributed along the Northeast Atlantic (NEA). Recent studies pointed out the existence of two stock components on their whole area of distribution, with a separation border line at the Porcupine Bank (Ireland western coast). However, the blue whiting continues to be assessed as a single stock, due to the lack of knowledge regarding the biology and structure of their southern component. The present thesis aimed to fill some of these important gaps in the biology and structure of blue whiting at the southern part of stock distribution, the Portuguese coast. Besides, this work also intended contributes to the enlargement of the knowledge on this species assessment. Smaller blue whiting (12cm–24cm) were mostly found in shallow areas down to 200m to 300m while larger individuals (>24cm) were spread deeper down to 400m until 500m. Blue whiting condi-tion (Fulton K) differed significantly between seasons (autumn and winter) in all the three main areas off Portugal (north, southwestern and south) and between sexes. The proportion of females changed between seasons and across depths. The blue whiting life-history parameters analysis shown differences in growth, length, age of first ma-turity, in the peak spawning and also differences on females spawning stock biomass, between the Portuguese coast and the main spawning ground (west of Ireland Islands and Porcupine Bank), which supports the existence of two components on the blue whiting off NEA. Furthermore, OtoRing, an open source software for otolith age read-ing, was developed with the principal advantages of: allow the storage and posterior revision of age classifications in an easy way; perform calibrations between readers; and help on the training of new readers. The otolith face orientation (distal versus prox-imal) on image analysis reveal that it must be taken into account during the otoliths images processing for symmetry shape analysis between left and right otolith. On blue whiting the otolith images should be obtained from the concave side (distal surface). Microsatellites’ genetic based results showed a lack of differentiation between samples from north to south of the NEA, and even at the Mediterranean coast of Spain. Howev-er, was verified a clear differentiation between the samples from the Adriatic Sea and the rest of the areas. The otolith shape showed differences between Ireland, Portu-guese coast and Mediterranean. Small scale differences in the otolith shape of imma-ture individuals were identified associated with different depth distributions along the Portuguese coast, but those differences have not been reflected in the comparison be-tween the Portuguese coast and the adjacent areas (Ireland coast and Mediterranean). The main conclusion was that blue whiting presents a unique population structure along the Portuguese coast which is different from the populations at north (Ireland coast) and at the Mediterranean.The basis, that will allow in a near future assess blue whiting considering two stock components, in a more sustainable and conservative based-approach for their effective management across the Northeast Atlantic, have started being created.
Keywords: blue whiting, biology, fishery resource, stock structure, Southern
xiii
O verdinho (Micromesistius poutassou) é um gadídeo mesopelágico amplamente distri-buído no Nordeste Atlântico (NEA). Estudos recentes apontam para a existência de dois componentes populacionais distintos ao longo de toda a área de distribuição, cuja linha de separação se situa na latitude do Banco de Porcupine (costa Oeste da Irlanda). No entanto, para os efeitos da avaliação do estado do manancial de verdinho assume-se a existência de uma única população ao longo do NEA. Este pressuposto mantém-assume-se principalmente devido a importantes falhas no conhecimento da biologia e da estrutu-ra populacional do verdinho na sua componente mais a sul. Deste modo, a presente tese teve como principais objectivos o estudo da biologia e da estrutura populacional do verdinho ao longo da costa Portuguesa, a parte mais a sul da sua distribuição. Para além disso, pretendeu também ampliar o conhecimento usado na avaliação desta espé-cie. Os verdinhos mais pequenos (12cm - 24cm) foram maioritariamente encontrados a uma profundidade entre os 200m e os 300m, enquanto que os maiores (>24cm) ocorre-ram em águas mais profundas, entre os 400m e os 500m. Na costa portuguesa (norte, sudoeste e sul), foram observadas diferenças significativas nos valores relativos ao ín-dice de condição (Fulton K) do verdinho entre estações do ano (Outono e Inverno) e entre sexos. A proporção de fêmeas nas amostras variou, quer com as estações do ano, quer com a profundidade. Entre a costa Portuguesa e a área principal de desova (costa da Irlanda, Banco de Porcupine) foram observadas diferenças relativas aos seguintes parâmetros: crescimento, comprimento, idade de primeira maturação, pico da época de desova e biomassa de fêmeas desovantes do manancial. Estas diferenças apoiam a exis-tência de duas unidades populacionais ao longo do NEA. No decorrer deste trabalho, foi desenvolvido um programa informático, de acesso livre, para leitura de idades em otólitos, o OtoRing, cujas principais vantagens são permitir de forma fácil o armaze-namento e a posterior revisão das classificações em idades, fazer calibrações entre lei-tores, e ajudar na formação de investigadores que se iniciam na leitura de otólitos. A superfície através da qual estão orientados os otólitos nas imagens (superfície distal
versus proximal), deve ser tida em consideração, nomeadamente quando estas são
reco-lhidas e processadas para estudos de simetria entre o otólito esquerdo e o direito. No caso do verdinho, as análises realizadas no decorrer deste trabalho mostraram que as imagens devem ser sempre obtidas pelo lado côncavo do otólito (superfície distal). Os resultados de genética com recurso a microsatélites não revelaram diferenciação entre as amostras recolhidas no NEA de norte para sul, e mesmo entre a costa Espanhola do Mediterrâneo. Contudo, foi verificada uma diferenciação clara entre as amostras reco-lhidas no mar Adriático e as restantes áreas. Diferenças entre a Irlanda, Portugal e o Mediterrâneo foram observadas através da análise da morfologia dos otólitos. Para os indivíduos imaturos obtidos na costa Portuguesa, foram identificadas pequenas dife-renças na morfologia do otólito associadas com a distribuição a diferentes profundida-des, mas estas diferenças não tiveram reflexo na análise a uma escala global, no âmbito da comparação entre as amostras de Portugal com as de áreas adjacentes (Irlanda e Mediterrâneo). Como principal conclusão da presente tese, o verdinho apresenta uma
xiv
conservadora para a gestão efectiva do verdinho ao longo do Atlântico Nordeste, já começaram a ser desenvolvidas.
Palavras-chave: verdinho, biologia, recurso pesqueiro, estrutura populacional,
xv
O verdinho (Micromesistius poutassou) é um gadídeo mesopelágico amplamente distri-buído no Nordeste Atlântico (NEA). Estudos recentes apontam para a existência de dois componentes populacionais distintos ao longo de toda a área de distribuição, cuja separação se situa na latitude do Banco de Porcupine (costa Oeste da Irlanda). No en-tanto, para os efeitos da avaliação do estado do manancial de verdinho assume-se a existência de uma única população ao longo do NEA. Este pressuposto mantém-se principalmente devido a importantes falhas no conhecimento da biologia e da estrutu-ra populacional do verdinho na sua componente mais a sul. Deste modo, a presente tese teve como principais objectivos o estudo da biologia e da estrutura populacional do verdinho ao longo da costa Portuguesa, a parte mais a sul da sua distribuição. Para além disso, pretendeu-se também ampliar o conhecimento existente e utilizado na ava-liação desta espécie.
Nos capítulos 2 e 3, são apresentados os resultados relativos a aspectos da biologia do verdinho na costa Portuguesa. Os capítulos 4 e 5 incluem informação essencial para a melhoria da avaliação desta espécie. A estrutura da população do verdinho para a cos-ta de Portugal foi analisada e integrada no contexto populacional do NEA nos capítu-los 2 e 6.
Os verdinhos mais pequenos (12cm-24cm) foram maioritariamente encontrados a uma profundidade entre os 200m e os 300m, enquanto que os maiores (>24cm) em águas mais profundas, entre os 400m e os 500m. Verificou-se um aumento da taxa de cresci-mento de norte para sul no NEA. O crescicresci-mento entre sexos é diferenciado, com as fê-meas a atingirem comprimentos maiores. Apesar de numa fase inicial a taxa de cresci-mento ser superior nos machos em todo o NEA, como única excepção o Mar do Norte. O pico principal de desova é em Fevereiro na costa Portuguesa e em Abril na área de desova principal (costa da Irlanda). Apesar, de o tamanho de primeira maturação ser semelhante entre diferentes áreas de distribuição, a correspondência com a idade varia de área para área, o que confirma diferenças no padrão de crescimento. Para diferentes zonas na costa Portuguesa (norte, sudoeste e sul), foram observadas diferenças signifi-cativas nos valores relativos ao índice de condição (Fulton K) do verdinho entre esta-ções do ano (Outono e Inverno) e sexos. A proporção de fêmeas nas amostras variou quer com as estações do ano, quer com a profundidade. De um modo geral, durante a época de desova os machos encontraram-se em maior abundância junto ao fundo. No entanto fora da época de desova, as amostras recolhidas no fundo são maioritariamte compostas por fêmeas. A biomassa de fêmeas desovanmaioritariamtes do manancial (FSSB) en-contra-se estabilizada com valores perto da média histórica para Portugal desde 2005, ao contrário dos dados disponíveis para o manancial do NEA no qual foi observada uma diminuição desde 2007 até 2010. Entre a costa Portuguesa e a área principal de desova (costa da Irlanda, Banco de Porcupine) foram observadas diferenças relativas aos seguintes parâmetros: crescimento, comprimento, idade de primeira maturação, pico da época de desova e FSSB. Estas diferenças apoiam a existência de duas unidades populacionais ao longo do NEA.
xvi
deste modo um papel fundamental para a correcta compreensão do estado actual deste recurso. Devido à sua importância, os critérios usados na leitura de otólitos e conse-quente classificação em idades devem ser objectivos, para que por um lado a precisão entre leitores seja elevada e por outro estas classificações sejam exactas. Na prática, a atribuição de idades está muito dependente do nível de experiência do leitor, o que torna os critérios subjectivos. No decorrer deste trabalho, foi desenvolvido um pro-grama informático de acesso livre para leitura de idades em otólitos com base em aná-lise de imagem, o OtoRing, cujo intuito foi o de tornar este processo mais objectivo e facilmente replicável entre leitores. As principais vantagens do OtoRing são: permitir de forma fácil o armazenamento e a posterior revisão das classificações em idades, fa-zer calibrações entre leitores, e ajudar na formação de investigadores que se iniciam na leitura de otólitos.
A utilização crescente de ferramentas de análise de imagem aplicadas quer à atribuição de idades, quer aos estudos de crescimento implica a padronização do modo como são recolhidas as imagens dos otólitos. Na recolha de imagens, a superfície a partir da qual se orientam os otólitos (superfície distal versus proximal) deve ser tida em considera-ção, nomeadamente quando estas são utilizadas em estudos de simetria entre otólitos do mesmo par (esquerdo e direito). No decorrer deste trabalho, as análises realizadas mostraram que as imagens devem ser sempre obtidas pelo lado côncavo do otólito (superfície distal).
Os resultados de genética com recurso a microsatélites não revelaram diferenciação entre as amostras recolhidas no NEA de norte para sul, e mesmo entre a costa Espa-nhola do Mediterrâneo. Contudo, foi verificada uma clara diferenciação entre as amos-tras recolhidas no mar Adriático e as restantes áreas. Diferenças entre a Irlanda, Portu-gal e o Mediterrâneo foram observadas através da análise da morfologia dos otólitos. Em verdinhos imaturos da costa Portuguesa, foram identificadas pequenas diferenças na morfologia do otólito associadas com a distribuição a diferentes profundidades, mas estas diferenças não tiveram reflexo na análise a uma escala global, no âmbito da com-paração entre as amostras de Portugal com as de áreas adjacentes (Irlanda e Mediter-râneo). Os factores ambientais uma vez que actuam ao nível do metabolismo e conse-quentemente do crescimento do otólito, são geralmente mais determinantes na defini-ção da forma do otólito do que a própria genética. Os resultados obtidos através da aplicação destas duas metodologias (genética e morfologia dos otólitos) sugerem que estas se complementam entre si como ferramentas aplicadas à biologia populacional. As aplicações em otólitos possuem potencial para revolucionar o nosso conhecimento relativamente à integridade de populações de peixes e consequentemente da gestão de recursos pesqueiros.
Como principal conclusão da presente tese, o verdinho apresenta uma estrutura popu-lacional única ao longo de toda a costa Portuguesa, sendo esta distinta da população a norte (costa da Irlanda) e do Mediterrâneo. A avaliação deste recurso pesqueiro tendo em consideração estas duas populações fenótipicas é de extrema importância, devido
xvii
vel e conservadora para a gestão efectiva do verdinho ao longo do Atlântico Nordeste, já começaram a ser desenvolvidas.
xix 1. GENERAL INTRODUCTION ... 1 1.1 FISHERIES ... 3 1.2 STOCK ASSESSMENT ... 8 1.3 BLUE WHITING ... 12 1.3.1 Biology ...14 1.3.2 Stock structure ...15 1.3.3 Stock assessment ...18
1.3.4 Portuguese coast component ...21
1.4 AIMS AND IMPORTANCE OF THE THESIS ... 25
1.5 THESIS OUTLINE ... 27
1.6 THESIS STRUCTURE LAYOUT ... 28
1.7 REFERENCES ... 28
2. BLUE WHITING (MICROMESISTIUS POUTASSOU) LIFE HISTORY PARAMETERS: EVIDENCES SUPPORTING THE STOCK STRUCTURE DELINEATION ... 39
2.1 ABSTRACT ... 41
2.2 INTRODUCTION... 41
2.3 MATERIAL AND METHODS ... 43
2.4 RESULTS ... 46
2.5 DISCUSSION ... 55
2.6 REFERENCES ... 60
3. BLUE WHITING (MICROMESISTIUS POUTASSOU) SEX RATIO, SIZE DISTRIBUTION AND CONDITIONS PATTERNS OFF PORTUGAL ... 67
3.1 ABSTRACT ... 69
3.2 INTRODUCTION... 69
xx
3.4 RESULTS ... 74
3.5 DISCUSSION ... 78
3.6 REFERENCES ... 82
4. IMAGE ANALYSIS AS A TOOL TO AGE ESTIMATIONS IN FISHES: AN
APPROACH USING BLUE WHITING IN IMAGEJ ... 87
4.1 ABSTRACT ... 89
4.2 INTRODUCTION ... 89
4.3 CONTRIBUTION TO SMART SYSTEMS ... 91
4.4 MATERIAL AND METHODS ... 92
4.4.1 Sample collection ... 92 4.4.2 Image analysis ... 92 4.4.3 Statistical analysis ... 94 4.5 RESULTS ... 94 4.6 DISCUSSION ... 96 4.7 REFERENCES ... 98
5. BLUE WHITING OTOLITHS PAIR’S SYMMETRY SIDE EFFECT ... 101
5.1 ABSTRACT ... 103
5.2 INTRODUCTION ... 103
5.3 MATERIAL AND METHODS ... 104
5.3.1 Sample collection ... 104
5.3.2 Otolith shape analysis ... 105
5.3.3 Statistical analysis ... 106
5.4 RESULTS ... 107
5.5 DISCUSSION ... 110
5.6 REFERENCES ... 112
6. INTEGRATING MICROSATELLITE AND OTOLITH METHODOLOGIES TO
ASSESS POPULATION STRUCTURE OF BLUE WHITING (MICROMESISTIUS POUTASOU) OFF THE PORTUGUESE COAST ... 115
6.1 ABSTRACT ... 117
6.2 INTRODUCTION ... 118
6.3 MATERIAL AND METHODS ... 120
6.3.1 Sample collection ... 120
6.3.2 Microsatellite marker analysis ... 122
6.3.3 Otolith shape ... 123
6.3.4 Statistical analysis ... 124
6.4 RESULTS ... 126
xxi
6.6 REFERENCES ... 136
7. GENERAL CONCLUSIONS ...143
xxiii
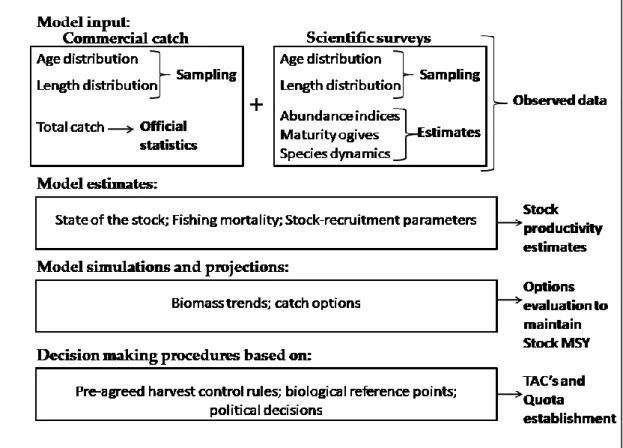
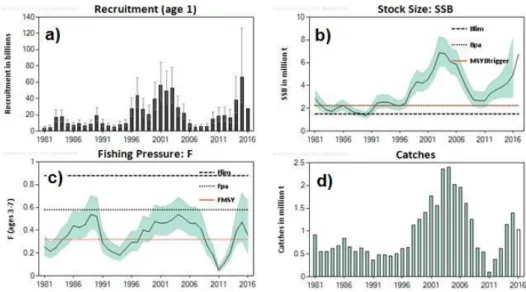
Figure 1-1 World capture fisheries and aquaculture production from 1950 until 2014 (from FAO 2016). ... 4 Figure 1-2 Catches for all countries in the world, plus High Seas, by large-scale (industrial) and small-scale sectors (artisanal, subsistence, recreational), with discards (overwhelmingly from industrial fisheries) presented separately (from Pauly and Zeller 2016). ... 5 Figure 1-3 Data flow of information in general stock assessment practices. ... 9 Figure 1-4 An overview of part of the global fisheries assessment, based on ecosystem and stock assessment models and on data collected under scientific research surveys. The white circle represents the developing or underdeveloped countries and the grey area represents the developed countries. Only 7 fish case studies from Asia, Africa and South America (i.e., continents with immense fisheries) and 59 from developed countries in North America, Europe and Oceania, were identified in the map (from Pauly and Zeller, 2017). ... 10 Figure 1-5 Blue whiting (Micromesistius poutassou) (Risso 1826)... 12 Figure 1-6 Distribution map of blue whiting. Distribution range colours indicate degree of suitability of habitat which can be interpreted as probabilities of occurrence, at light yellow – minimum values (relative probabilities of occurrence between 0.01 and 0.19) and at red – maximum values (relative probabilities of occurrence between 0.80 and 1.00) (from www.aquamaps.org, version of Aug. 2016. Web. Accessed 8 Sep. 2017). - Porcupine Bank. ... 13 Figure 1-7 The percentage contribution to the overall catch by fishery area (southern and northern: North Sea, main spawning area and Norwegian Sea) from 1988 until 2016 (from ICES, 2017a). ... 19 Figure 1-8 Distribution of blue whiting catches (in percentage) by quarter from 2000 until 2016 (from ICES, 2017a). ... 19 Figure 1-9 Blue whiting stock estimates from 1981 until 2016: a) recruitment estimates (billions); b) spawning stock biomass estimates (million tonnes) for the blue whiting stock
xxiv
3 and 7 years). The dashed lines correspond to the established values for Flim, Fpa and FMSY
for blue whiting stock; d) total catches in million tonnes (from the 2016 advice sheet of whb-comb stock ICES areas 27.1-9, 12 and 14 (ICES, 2016c)). ... 21 Figure 1-10 Blue whiting total catches (tonnes) from the Portuguese fleet, for the period between 1988 and 2016. For the period 2004 until 2016, the total catches were decomposed in the amount of landings (tonnes) and in the amount of discards (tonnes) (data from DGRM – landings; and IPMA – discards). ... 22 Figure 1-11 Blue whiting landings by port (percentage) in the Portuguese coast, for the period between 1998 and 2016 (data from DGRM). ... 23 Figure 1-12 Total length (cm) of the landed blue whiting sold at auction and by contracts between 2004 and 2014. This data has been collected under the PNAB discards sampling program. The centre line of each box represents the median; the box limit indicates the 25th and 75th percentiles, the whiskers delimit the non-outliers range and the points represent the outliers (data from IPMA). ... 23 Figure 1-13 Blue whiting abundance (number per hour) for the northern (from Caminha to Lisboa), southwestern (from Lisboa to Sagres) and southern (from Sagres to Vila Real de St. António) off Portugal (PT) between 1998 and 2015, from the PBTS autumn surveys (data from IPMA). ... 24 Figure 1-14 Blue whiting abundance (number per hour) by length class (cm) between 1998 and 2015, from the PBTS (data from IPMA). ... 25 Figure 1-15 Thesis structure and the interaction between chapters... 28 Figure 2-1 Weight-length relationships of blue whiting, from the Portuguese coast (between 1990 and 2011), by sex. ... 46 Figure 2-2 Weight-length relationships of blue whiting, from the Portuguese coast (between 1990 and 2011), by semester. ... 47 Figure 2-3 Sex combined maturity ogive of blue whiting, from the Portuguese coast (between 1990 and 2011), describing the proportion of matures by length class (cm). ... 47 Figure 2-4 The von Bertalanffy growth curves for the Portuguese coast (between 1990 and 1999) (present study), Nowergian coast, North Sea, Norwegian Sea and Porcupine according to Monstad (1990) for females (a) and males (b). ... 48 Figure 2-5 Standardized spawning stock biomass of blue whiting females (FSSB) by year (between 1990 and 2011), for the Portuguese coast (o....), combined stock using the abundances indices from the International Ecosystem Survey in the Nordic Seas (IESNS) (2000-2003) (____) and from the IBWSS survey (2004-2010) (---). ... 49 Figure 2-6 Geographical position of the sampling stations in which were represented the proportion of blue whiting immature, mature and spawning females, from the surveys between 1990 and 2011 and 20, 100 and 200m isobaths (contour lines). Pie charts represent the proportion of total number of immature females (grey), of mature females (white) and of spawning females (black). x-axes corresponds to longitude west (degrees)
xxv
Figure 3-1 Portuguese continental margin showing the sampling stations for bottom trawl surveys conducted between 1990 and 2011, where blue whiting was sampled, and 100m, 200m and 500m isobaths. + Fixed stations; ● random stations. x-axis correspond to longitude west (degrees) and y-axis to latitude north (degrees). ... 72 Figure 3-2 Length (cm) distribution of blue whiting individuals by depth. (a) Females and (b) males. Sampling stations covered the depth range 20m-750m (see Figure 3-1). Centre line of each box represents the median; box limit indicates the 25th and 75th percentiles and the whiskers delimit the non-outliers range. ... 74 Figure 3-3 Blue whiting proportion of females by season (autumn and winter) and area. Centre line of each box represents the median, box limit indicates the 25th and 75th percentiles and the whisker delimits the non-outliers range. Horizontal line indicates sex ratio 1:1. ... 75 Figure 3-4 The average of (a) proportion of females (mean ± SD) and (b) abundance index (mean number of individuals caught per hour) by year for blue whiting on the Portuguese shelf. ... 77 Figure 3-5 The percentage immature, mature and spawning fishes, data combined from both sexes, in the samples by season (autumn and winter) and for each of the three areas (north, southwest and south). ... 77 Figure 3-6 Fulton condition factor (K) for mature blue whiting, by sex (F – females (dark grey); M– males (light grey)) and by season (autumn and winter) along the areas of sampling: (a) north, (b) southwest and (c) south. Centre line of each box represents the median, box limit indicates the 25th and 75th percentiles and the whisker delimits the non-outliers range. .... 78 Figure 4-1 Blue whiting left (top) (with the transect line) and right (bottom) otoliths from fishes with: (a) 1 year old and (b) 4 years old. ... 93 Figure 4-2 Blue whiting left otolith profile along the long axis from fishes with: (a) 1 year old (Figure 4-1a) and (b) 4 year old (Figure 4-1b). The arrows indicate the rings position in the profile density plot... 93 Figure 4-3 Fish length (cm) by age according to classifications by: a) readers and b) ImageJ application. Symbols correspond to fish’s sex: ▲indeterminate; ● females; and ■ males.95 Figure 4-4 Age-bias plot of estimations by readers and by ImageJ application. The dashed line represents the age-agreement between procedures. Values represent number of otoliths in percentage. ... 96 Figure 5-1 A lateral image of the right otolith, showing the otolith position in the scanner surface: (a) the distal surface (concave side); (b) the proximal surface (convex side). .... 106 Figure 5-2 Total length (cm) and total weight (g) of the blue whiting samples collected during October 2015 (n=17) and March 2016 (n=23). ... 107 Figure 5-3 Number of females (n=22), indeterminate (n=2) and males (n=16) in the blue whiting samples from March 2016 and October 2015. ... 108 Figure 5-4 Mean otolith outline shapes formed with reverse Fourier transform of the outline using the first 34 harmonics showing the overlap and variations between: (i) left from the
xxvi
(grey solid line). ... 109 Figure 5-5 Mean otolith outline shapes formed with reverse Fourier transform of the outline using the first 34 harmonics showing the overlap and variations between: (iii) right from the proximal surface (dark grey dash line) and left from the proximal surface (grey solid line); (iv) right from the distal surface (dark grey dash line) and left from the distal surface (grey solid line). ... 110 Figure 6-1 Sampling locations of blue whiting in the Northeast Atlantic, Mediterranean and Adriactic Sea. The samples locations collected for otolith shape analysis and genetic (white), only for otolith shape (orange) and only for genetic (yellow). IRL – Ireland Shelf (Porcupine Bank); PT-CAM – Caminha; PT-LIS – Lisboa; PT-SW- Portuguese Southwest Shelf (Sines); PT-VSA – Vila Real de Santo António; MED – Mediterranean Sea (south of Cape of Palos); ADR – Adriatic Sea. The prefix “PT” denominates the samples collected off Portugal. Map from Google maps. ... 121 Figure 6-2 Magnitude of Delta (K) as a function of K (mean ± SD over 10000 replicates). Calculated for each model using the absolute values of the second order rate of change of the likelihood distribution (mean ± SD) according to the formula: |L′′(K)| = |L′(K + 1) – L′(K)|. Delta(K) (∆K) as ∆K = m|L′′(K)|/s[L(K)]. The modal value of this distribution is the true K(*) or the uppermost level of structure, here two clusters (according to the method by Evanno, Regnaut and Goudet, 2005). ... 127 Figure 6-3 Relative relationships between the blue whiting collected in the different locations, in the Northeast Atlantic (IRL, PT-CAM, PT-LIS, PT-VSA), Mediterranean (MED) and Adriatic (ADR) Seas, according to Principal component analysis (PCA) based on correlation matrix of allele frequencies. ... 128 Figure 6-4 Multidimensional scaling plot of the otolith shape from the blue whiting samples: a) from IRL (red), PT-SW1 (blue) and MED (green) (i); b) only from the Portuguese coast, PT-CAM (green), PT-LIS (red), PT-SW1 (grey), PT-SW2 (black), and PT-VSA (blue) (ii). The symbols: ●- samples without depth information (commercial fishery); ▲ – samples in which the depth information was available (PT surveys). The size of ▲is proportional to the increase in depth (m), the levels are: 100, 134, 147, 148, 180, 259, 324 and 385. ... 129 Figure 6-5 Mean otolith outline shapes formed with reverse Fourier transform of the outline using the first 36 Fourier harmonics showing the overlap and variations between three clusters (IRL (red), PT-SW1 (blue) and MED (green)). ... 130 Figure 6-6 Mean otolith outline shapes formed with reverse Fourier transform of the outline using the first 36 Fourier harmonics showing the overlap between the Portuguese areas (PT-CAM (green dotted line), PT-LIS (red dotted line), PT-SW2 (black line), PT-VSA (blue dotted line) and PT-SW1 (black dotted line)). ... 130 Figure 6-7 Mean otolith outline shapes formed with reverse Fourier transform of the outline using the first 36 Fourier harmonics showing the overlap between the Portuguese areas
xxvii
Figure 8-1 Future steps for the assessment of blue whiting considering the southern and the northern components. The numbers corresponds to the essential points in need to improve. ... 155
xxix
Table 2-1 Gear, mesh size, trawls speed and tows duration of the Portuguese surveys (1990 and 2011). ... 43 Table 3-1 Mean proportion of blue whiting females (standard deviation in brackets) by length class (cm) by survey season and study area on the Portuguese shelf. NA – not available. 76 Table 3-2 Summary of the generalized mixed model results for blue whiting proportion of females on the Portuguese shelf. df – degrees of freedom; std. error – standard error. ... 76 Table 6-1 Sampling location, date of sampling, sample size (n) according to the type of analysis (OS – otolith shape; G – genetic) and fish total length (Lt) in cm of blue whiting. The samples from IRL, PT-CAM, PT-LIS, PT-SW2 and PT-VSA were collected during scientific surveys. The samples from PT-SW1, MED and ADR were from the commercial fishery. ... 121 Table 6-2 Detailed information of the samples (OS – otolith shape; G – genetic) collected along the Portuguese coast, number of hauls by sample location and the respective depth of sampling (meters). ... 122 Table 6-3 The number of alleles, population wide Fit, fixation indices between samples (FST)
and within samples (FIS) for each locus (MpouBW13, MpouBW09, MpouBW08, Tch06,
MpouBW07, Mmer-UEAW01) across all sample locations. The table is sorted in ascending order based on FST. ... 126
Table 6-4 Allelic richness for each locus (MpouBW13, MpouBW09, MpouBW08, Tch06, MpouBW07, Mmer-UEAW01) and sample location (IRL, PT-CAM, PT-LIS, PT-VSA, MED and ADR)... 126 Table 6-5 P-values from the pair-wise FST-distance between sample locations (IRL, PT-CAM,
PT-LIS, PT-VSA, MED and ADR) across all loci, determined using the Fisher’s method from Genepop. ... 127 Table 6-6 Summary of the generalized model results applied to the RDA covariates of blue whiting otolith shape Fourier descriptors (PF=36) across the three areas (IRL, PT-SW1 and MED) (i).Interactions between factors are noted by a colon (:). df – degrees of freedom; Std. error – standard error. *< 0.001 ... 128 Table 6-7 Summary of the generalized model results applied to the RDA covariates of immature blue whiting otolith shape Fourier descriptors (PF=36) from the Portuguese Coast
xxxi
ACFM Advisory Committee on Fishery Management
ALKs Age-length keys
ANOVA Analysis of variance APE Average percent error
Blim Limit reference point for spawning stock biomass (SSB)
Bpa Precautionary reference point for SSB
BMSY SSB that results from fishing at FMSY for a long time
Btrigger SSB that triggers a specific management action
CFP Common Fisheries Policy
Ch. Chapter
CPUE Catch Per Unit Effort
CPR Continuous Plankton Recorder CV Coefficient of variation
DCF Data Collection Framework
df degrees of freedom
EBA Ecosystem-based-approach stock assessment models EBM Ecosystem-based-management
EC European Commission EFD Elliptic Fourier Descriptors
xxxii
FCT Fundação para a Ciência e Tecnologia
F Fishing mortality
Fpa Precautionary reference point for fishing mortality (mean
over defined age range)
Flim Limit reference point for fishing mortality (mean over
de-fined age range)
FMP Fishing mortality reference point as defined in management
plans.
FMSY Fishing mortality consistent with achieving MSY
FSSB Female Spawning Stock Biomass GLM Generalized linear model
GLMM Generalized linear mixed model HCR Harvest Control Rule
IBWSS International Blue Whiting Spawning Stock Survey ICES International Council for the Exploration of the Sea
IFREMER L'Institut Français de Recherche pour l'Exploitation de la Mer
IPMA Instituto Português do Mar e da Atmosfera K Fulton’s condition factor
L50 Length at which 50% of the population are mature
LO Landing obligation
LPUE Landings Per Unit Effort
M Natural mortality
MAY Maximum average yield MLS Fish minimum landing size
xxxiii
within the ICES MSY framework NEA Northeast Atlantic
PCA Principal Components Analysis
PNAB Plano Nacional de Amostragem Biológica PBTS Portuguese Bottom-Trawl Survey
PT Portugal
R Recruitment
SAM State-space fish stock Assessment Model SCAA Statistical Catch-at-Age Analysis
SD Standard deviation
SIMWG ICES Stock Identification Methods Working Group SSB Spawning stock biomass
SR Sex-ratio, proportion of females SRR Stock-recruitment relationship
std.error standard error
STECF Scientific, Technical and Economic Committee on Fisheries (EU) VPA Virtual Population Analysis
whb FAO species code for blue whiting
WKPELA ICES Benchmark Workshop on Pelagic Stocks XSA Extended Survivol Analysis
xxxv
Age-length keys - The age structure for a large number of fish can be estimated
by summarizing the relationship between age and length for a relatively small subsample of fish and then applying this summary to the entire sample of fish, which is named as an age-length key.
Asymptotic growth – Is usually expressed as L∞, asymptotic fish length at
which growth is zero from the von Bertalanffy model. This is not the maximum length of the animal. Rather L∞ is the asymptote for the model of average
length-at-age. As with any average, some individuals will be larger than aver-age; thus, some animals will be larger than L∞. L∞ only has meaning in fish
pop-ulations where mortality is low enough to allow fish to reach an age at which the mean length (virtually) ceases to increase.
Age reading - Age classification has been based in age readings under
stereo-microscopic otoliths observation. The otolith grows in size as fish grows; ring bands are formed in the otoliths surface registering periods of rapid and slow growth, opaque bands appear alternating with translucent bands. Age classifi-cation was made considering the number of translucent rings in the otolith; one translucent ring was equivalent to one year.
Aquaculture - The farming of aquatic organisms in inland and coastal areas,
involving intervention in the rearing process to enhance production, such as regular stocking, feeding, protection from predators; and the individual or cor-porate ownership of the stock being cultivated.
Bayesian method - Assessment method that quantifies uncertainties and
xxxvi
By-catch - Part of a fishing catch taken incidentally in addition to the target
spe-cies towards which fishing effort is directed. Some or all of it may be returned to the sea as discards.
Catchability - The fraction of a fish stock which is caught by a defined unit of
the fishing effort.
CPUE – The quantity of fish caught (in number or in weight) with one standard
unit of fishing effort; e.g. number of fish taken per 1000 hooks per day or weight of fish taken per hour of trawling. CPUE is often considered an index of fish biomass (or abundance). Sometimes referred to as catch rate.
Choke species - Species with the lowest quota in a mixed-fishery, which restrict
the fishing opportunities for other quota species.
Demersal fish - Fish that spend most of their life with contact with or
depend-ency on the bottom. Usually refers to the adult stage of a species.
Discards - That component of a catch thrown back after capture. Normally,
most of the discards can be assumed not to survive. They are typically discard-ed because they are non-target species, below minimum landing size, above or below the ideal market size (high grading) or because the quota for that species has been exhausted.
Discard-ban – see landing obligation (LO).
Ecosystem - An organizational unit consisting of an aggregation of plants,
ani-mals (including humans) and micro-organisms, along with the non-living com-ponents of the environment.
Ecosystem approach - Ecosystem approach to fisheries management.
Manage-ment that takes into account the effects of fisheries on the ecosystem, and the effects of the ecosystem on the fish stocks.
Epipelagic zone – Corresponds to the zone of an ocean extending from the
sur-face to a depth of about 200 meters; light penetrates this zone, allowing photo-synthesis.
xxxvii
seasonal distribution of fishing, and the growth and migration of the fish.
Exclusive Economic Zone (EEZ) - A zone under national jurisdiction (up to
200-nautical miles wide) declared with the provisions of 1982 United Nations Convention of the Law of the Sea, within which the coastal State has the right to explore and exploit, and the responsibility to conserve and manage, the living and non-living resources.
Fishery – Group of vessel voyages targeting the same (assemblage of) species
and/or stocks, using similar gear, during the same period of the year and with-in the same area.
Fisheries management - The integrated process of information gathering,
anal-ysis, planning, decision-making, allocation of resources and formulation and enforcement of fishery regulations by which the fishery management authority controls the present and future behaviour of interested parties in the fisheries, in order to ensure the continued productivity of the living resources.
Fishing fleet - An aggregation of fishing vessels of a particular country (e.g. the
European Union fishing fleet) or using a particular gear (a purse seine fleet).
Fishing mortality - The part of the total mortality rate that is due to fishing.
Fishing mortality is usually expressed as an instantaneous rate and can range from 0 per year (for no fishing) to high values such as 1.0 or more per year.
F0.1 - The fishing mortality rate at which the marginal yield-per-recruit (i.e. the
increase in yield-per-recruit in weight for an increase in one unit of fishing mor-tality) is only 10 percent of the marginal yield-per-recruit on the unexploited stock. The fishing mortality rate at which the slope of the yield-per-recruit curve is only one-tenth the slope of the curve at its origin.
Forage species – Small pelagic species used as prey by a predator for its food. Fully fished - State of a stock which current catches are close to the Maximum
Sustainable Yield (MSY) or Maximum Average Yield (MAY). Increases in fish-ing effort would not increase significantly the yields and would substantially increase the risk of overfishing. Fully fished stocks are primary targets for effort and capacity controls.
Growth model - Fish growth models can be divided into two categories. The
xxxviii
hind the actual growth processes. The most used growth model is the von Ber-talanffy, but other different statistical models are available, that also fit empiri-cal data quite well: for example, the Logistic, Gompertz and Richards’s growth models.
Growth rate – Represents the fish change in size (length and weight) along
time. In the von Bertalanffy growth model is denominated as k.
Hardy–Weinberg equilibrium – Is a principle stating that the genetic variation
in a population will remain constant from one generation to the next in the ab-sence of disturbing factors. When mating is random in a large population with no disruptive circumstances, both genotype and allele frequencies will remain constant because they are in equilibrium.
HCR – An algorithm for pre-agreed management actions as a function of
varia-bles related to the status of the stock. For example, a control rule can specify how F or yield should vary as a function of spawning biomass. Also known as ‘decision rules’ or ‘harvest control laws’.
Landings - Weight of what is landed from a fishery at a landing site. It is
differ-ent from the catch because it does not include discards.
Landing obligation – Article 15 of the new CFP Basic Regulation (Council
Reg-ulation No 1380/2013) introduces new rules on discards including: (i) a landing obligation (LO) under which all catches of regulated species must be landed and counted against quotas of each Member State; and (ii) a requirement that catch of species subject to the LO below a minimum conservation reference size (MCRS) be restricted to purposes other than direct human consumption.
Large-scale fisheries – Also denominated as industrial fisheries. Commercial
fishery involving large fishing vessels, with capacity for store large amounts of fish and some of those vessels are also equipped with fish processing machines.
LPUE – Landings per unit effort, similar to CPUE, but based on that part of the
catches that are landed and reported.
Management plan - A management plan includes the decision-making
pro-cesses (harvest control rules, tactical decision making) and the sanctions on im-plementation and the requirements for monitoring and reporting. Management plans may also exist in the form of rebuilding plans or recovery plans.
xxxix
ciated performance criteria, the implementation measures (e.g. input or output control) and what is considered a relevant knowledge base for decisions.
Maturity ogive - A distribution curve with the cumulative proportions of
im-mature and im-mature individuals by age or by length.
Maximum Sustainable Yield (MSY) - The largest average catch that can be
tak-en continuously (sustained) from a stock under average tak-environmtak-ental condi-tions. It is often used as a management goal.
Mesopelagic fish – Fish that inhabits the intermediate depths of the ocean
be-tween 100 and 1000m. Most of mesopelagic species make extensive vertical mi-grations into the epipelagic zone at night to feed, and thereafter migrate down several hundred meters to their daytime depths.
Metier – Homogeneous sub-division of a fishery by fleet (e.g. the Portuguese
bottom-otter trawl crustacean fishery).
Minimum landing size (MLS) - The lowest individual size allowed in landings
or markets. Established by fishery management and enforced through control at landing sites or markets, it is intended to minimize the catch of small (under-sized) fish or juveniles giving them a better chance to grow before being vul-nerable to fishing. Based on yield per recruit considerations and models, it aims at avoiding or correcting growth overfishing.
Moratorium - A mandatory cessation of fishing activities on a species (e.g. the
blue whale, cod), in an area (e.g. a sanctuary), with a particular gear (e.g. large scale driftnets), and for a specified period of time (temporary, definitive, sea-sonal, or related to re-opening criteria).
Natural mortality - Deaths of fish from all causes except fishing (e.g. ageing,
predation, cannibalism, disease and perhaps increasingly pollution). It is often expressed as a rate that indicates the percentage of fish dying in a year; for ex-ample a natural mortality rate of 0.2 implies that approximately 20% of the population will die in a year from causes other than fishing.
Overfished - A stock is considered overfished when its size falls below a
xl lead to an increase in the total catch.
Panmitic population - A population in which mating is entirely random and
any two (male and female) individuals are equally likely to mate. Random mat-ing (or panmixis) is one of the assumptions of the Hardy–Weinberg equilibrium but is probably uncommon in natural populations, in which spatial structuring and assortative mating are usually evident.
Pelagic fish - Fish that spend most of their life swimming in the water column
with little contact with or dependency on the bottom. Usually refers to the adult stage of a species.
Population – A group of fish of one species which shares common ecological
and genetic features. The stocks defined for the purposes of stock assessment and management do not necessarily coincide with self-contained populations.
Quota - A share of the total allowable catch (TAC) allocated to an operating
unit such as a country, a vessel, a company or an individual fisher (individual quota) depending on the system of allocation. Quotas may or may not be trans-ferable, inheritable and tradable.
Recruits or recruitment - The new age group of the population entering the
ex-ploited component of the stock for the first time or young fish growing into or otherwise entering that exploitable component.
Semi-pelagic species – A species that partially lives their life on the bottom and
in the water column (pelagic).
Small-scale fisheries – Also denominated as artisanal fisheries. Traditional
fisheries involving fishing households (as opposed to commercial companies), using relatively small amount of capital and energy, relatively small fishing vessels (if any), making short fishing trips, close to shore, mainly for local con-sumption.
Spawning stock biomass – Abbreviation is SSB. The total weight of all fish
(both males and females) in the population which contributes to reproduction. Conventionally defined as the biomass of all individuals beyond age at first ma-turity or size at first mama-turity, i.e. beyond the age or size class in which 50% of the individuals are mature. Most often used as a proxy for measuring egg pro-duction, the SSB depends on the abundance of the various age classes compos-ing the stock and their past exploitation pattern, rate of growth, fishcompos-ing and natural mortality rates, onset of sexual maturity, and environmental conditions.
xli
and directed migrations due to seasonal or reproductive activity can occur. Such a group can be regarded as an entity for management or assessment pur-poses. The impact of fishing on a species cannot be fully determined without knowledge of the stock structure.
Stock assessment - The process of collecting and analysing biological and
sta-tistical information to determine the changes in the abundance of fishery stocks in response to fishing, and, to the extent possible, to predict future trends of stock abundance. Stock assessments are based on resource surveys; knowledge of the habitat requirements, life history, and behaviour of the species; the use of environmental indices to determine impacts on stocks; and catch statistics. Stock assessments are used as a basis to assess and specify the present and probable future condition of a fishery.
Stock collapse - Reduction of a stock abundance by fishing and/or other causes
to levels at which the production is negligible compared to historical levels. The word is normally used when the (reduction) process is sudden compared with the likely time scale of recovery, if any, but is sometimes used melodramatically for any case of overfishing.
Stock-recruitment relationship - The relationship between the level of parental
biomass (e.g. spawning stock size) and subsequent recruitment level. Determi-nation of this relationship is useful to analyse the sustainability of alternative harvesting regimes and the level of fishing beyond which stock collapse is like-ly. The relation is usually blurred by environmental variability and difficult to determine with any accuracy. Such a relationship always exists in principle, in that the existence of a parent stock is a prerequisite for the generation of re-cruitment. However, in many cases there exist regulatory mechanisms such that the number of recruits is not strongly related to the parent stock size over the range of stock sizes observed: this situation is sometimes described as the ab-sence of a stock-recruitment relationship, but is more logically described as a special case of a stock-recruitment relationship. Some stock assessment meth-ods incorporate the estimation of such a relationship directly into the model, either explicitly (e.g. some age-structured assessments) or implicitly (most stock production models).
Target species - Those species that are primarily sought by the fishers in a
par-ticular fishery.
Total Allowable Catch (TAC) - It is the total catch allowed to be taken from a
stock in a specified period (usually a year), as defined in the management plan. The TAC may be allocated to the stakeholders in the form of quotas as specific quantities or proportions.
xlii current ones.
Year class – All the fish of a stock spawned or hatched in a given year.
Yield per recruit – The expected lifetime yield per fish recruited in the stock at
a specific age. Depends on the exploitation pattern (fishing mortality at age) or fishing regime (effort, size at first capture) and on natural mortality.
xliii
The revision of the scientific studies concerning blue whiting (Micromesistius
poutassou), conducted to the identification of specific important knowledge gaps
on the stock structure and biology along the Portuguese Coast, which has arose several questions that span the proposed work.
Could the life history parameters (growth, maturity) and females spawning stock biomass of the blue whiting from the Portuguese coast show evidences supporting the existence of two stock com-ponents?
Does the blue whiting sex-ratio, size distribution and condition changes along the Portuguese coast?
Should ImageJ be used as an automatic approach to improve the accuracy and precision of blue whiting ageing?
Could the otolith surface’s (distal versus proximal), from which the images were recorded, have influence in the diagnostic of the oto-lith symmetry shape (between the left and the right) on blue whit-ing?
What is the stock structure of blue whiting off Portugal based on microsatellite markers analysis and on otoliths shape analysis? The answer to these questions, that is the purpose of this work, is presented in this thesis.
3
1.1 Fisheries
Fisheries provide livelihood to millions of persons and contribute to national economies through employment in fishing, processing and ancillary services, as well as through subsistence based activities at the community level. Fish is one of the most traded food, with consumption in developing and developed countries increasingly derived from imports, while underdeveloped countries, are more heavily reliant on local supply (FAO, 2014).
Fish consumption per capita increased from an average of 9.9kg in the 1960s to 14.4kg in the 1990s and 19.7kg in 2013. In 2014, fish provided more than 3.1 billion people with almost 20% of their average per capita intake of animal protein in developing countries (FAO, 2016), compared with 8% in developed countries (Toye, 2007).
The total fish production in 2014 exceeded the 167 million tons, 55% were supplied by the capture fisheries and 45% by the aquaculture production (Figure 1-1). The same source estimates that in 2025, that ratio should be inverted, with 48% of the fish income from fisheries and 52% from the aquaculture (FAO, 2016). Notwithstanding, in the structure of the global fisheries the supply is still dominated by fishery catch, while in developing countries transition to supply dominated by aquaculture is already taking place (Toufique and Belton, 2014; Thilsted et al., 2016). The emerging aquaculture fish production present several constraints, mainly their impacts concerning the environment (production discharges effluents, spreads aquatic pathogens and invasive species and alters habitats with the related loss of ecosystem services) and wild fish sustainability (Péron, Mittaine and Le Gallic, 2010). Pelagic forage fish (e.g. anchoveta, herring, sardines and blue whiting) are used to fishmeal at aquaculture farms and fish oil production instead of human food consumption (Tacon and Metian, 2009), corresponding to around 30% of the total catches (Naylor et al., 2009). In average, 4kg to 5kg of forage fish are need to produce 1kg of fishmeal and between 20kg to 25kg of forage fish to obtain 1kg of fish oil (Péron, Mittaine and Le Gallic, 2010).
4
Figure 1-1 World capture fisheries and aquaculture production from 1950 until 2014 (from FAO 2016).
For the majority of coastal populations fish is an important protein source. Portugal appears in the list as one of the countries with higher fish consumption in the European Union (EU) (Bjørndal, Lappo and Ramos, 2015). In 2013, the Portuguese fish consumption per capita was 53.8kg, compared with an average of 20kg within the EU and occupying rank 3 in fish consumption worldwide (FAO, 2014). Consequently, fishing activities play an important socio-economic role on supplying national fish market demand (Leitão et al., 2014).
An overview of the catches over the last decade for all countries of the world, indicate that since 1996, total world catches are declining at a rate of 1.2 million tonnes per year (Zeller et al., 2016). The decrease is more evident in the catches from the industrial fleet, in the small-scale fisheries the annual catch remains almost invariant since 2000 (Figure 1-2).
5 Figure 1-2 Catches for all countries in the world, plus High Seas, by large-scale (industrial) and small-scale sectors (artisanal, subsistence, recreational), with discards (overwhelmingly from industrial fisheries) presented separately (from Pauly and Zeller 2016).
The progressive advances in fishing technology may temporarily maintain high catch rates and mask the decline in stock levels, but eventually the fish abundance diminish and the fishery collapses (Clark, 1996). In the history of fisheries, the decline in fishing resulted from fish stock collapses of many species along the years. The fishery of the pacific sardine (Northern and Southern West Pacific) with an average landing over 600,000tons per year by 1940 began to collapse a few years later. In 1970, the pacific sardine catches were less than 100tons per year (Radovich, 1982). In the same decade (1970), the North Atlantic Icelandic spring and summer spawning herring (Perissi et al., 2017) and the Peruvian anchoveta (Watson and Pauly, 2001) fisheries collapsed. The greatest decline was experienced by what once was one of the world’s most abundant cod stocks. The Grand Banks cod stock in Newfoundland, collapsed in the earlier 1990’s (Hutchings and Reynolds, 2004). Taking into account that for many, fisheries are critical sources of food and income, alternative employment options are often limited and may not be desirable given traditional and cultural ties to the sea and fishing livelihoods. The impact of fisheries collapse can be devastating; in Iceland, the herring collapse provoked the drastic fall in the number of Herring Salting industries a few years later (Perissi et al., 2017); and in Canada, the collapse of the cod fishery led to
6
changes in the social structure and dynamics of rural communities as the northern cod moratorium led to mass layoff of over 10,000 fishery workers (Schrank, 2005).
In 2004, there were estimated 41million full-time or part-time fishery workers worldwide who were involved directly in the catching and fish farming. A further 123million were involved indirectly in secondary activities (postharvest processing, distribution, and marketing activities) (World Bank 2008). Fisheries employment is unevenly distributed around the world, with a high proportion concentrated in developing countries. This disparity between participation in the fisheries of developed and developing countries lies in the scale of fishing operations. The developed countries fish with sophisticated industrial fleets (Teh and Sumaila, 2011). In contrast, small-scale fisheries are prevalent in many developing countries, where fishing is generally carried out by individuals or household units at a localized scale (Andrew et al., 2007).
Oceans should continue to provide for a substantial portion of the world's protein needs. The past trends of overfishing, wide-scale disruption of coastal habitats and the rapid expansion of non-sustainable aquaculture enterprise, however, threaten the world's food security (Watson and Pauly, 2001). An effective fisheries management is the needed answer to improve the economic situation of fishing communities. Part of the solution is to reduce discards by finding market-based approaches that will increase the value for all by-catch fish.
Discards constitute a substantial part of the worldwide catch that is every year returned to the sea (Catchpole et al., 2017) (Figure 1-2). Reasons for discarding include legal obligations, e.g. minimum landing sizes (MLS) and target species quota exhausted. Discard of by-catch species are usually associated to their economic value (e.g. low or no market value) (Damalas, 2015). By-catch occurs when fishing gear is nonselective, so that both targeted and non-targeted species are caught from the same effort (Melstrom, 2015). High-levels of discards have been considered a problem in European and global fisheries for many years. Discards vary throughout EU fisheries – in some cases representing more than 60% of the catch, while in other cases – including pelagic fisheries – could be very low (STECF, 2015). From these, 11% of the EU total discards are of fish under MLS, also usually from choke species (STECF, 2015).
7 The European Commission (EC) has identified the ‘discard problem’ as a driver of poor economic performance and a significant component of marine ecosystem functioning (Commission’s green paper on the reform of the CFP-COM 2009/163 final). Towards eradicating this problem the reformed Common Fisheries Policy (CFP—EU regulation1380/2013) introduced the landing obligation (LO) to all catches. The LO regulation was introduced on 1 January 2015 for small pelagic fish which have a total allowable catch (TAC) such as mackerel, herring and sprat, and is being rolled out to all demersal and remaining species which have TACs in a phased manner between 2016 and 2019 (Catchpole et al., 2017).
In addition, numerous technical regulations and associated amendments have been introduced in almost all developed fisheries worldwide in an attempt to improve fishing gear selectivity, reduce discards and enhance the status of fish stocks (Alzorriz et al., 2016 and references therein). Passive gears, such as gillnets, are characterized by low retention probabilities at small length classes, as well as at large length classes, with the catch of medium-sized length classes. In trawls and other active gears, the selective pattern allows smaller fish with specific morphological characteristics of passing through the meshes and escaping, whereas larger fish is being retained in the codend (Stepputtis et al., 2016). The gear size selectivity is an important achievement, since capture and discarding of small immature fish reduces the potential biomass of the exploitable stock and affects subsequent recruitment (Graham, Kynoch and Fryer, 2003). Although, the capture of larger individuals induces early maturation at smaller sizes, leading to reduced fecundity and also fisheries yield reduction (Kuparinen and Merilä, 2007). Thus, gear selectivity can have impact at the community level: not only remove large individuals of the target species, but also decrease the relative abundances of species with the capability to grow to large sizes (Jennings, Greenstreet and Reynolds, 1999). Trawls and active gears have also marked impacts on the ocean substratum. Physical disturbance of the substratum results from direct contact with the fishing gear and the turbulent resuspension of surface sediments. The magnitude of the impact is determined by the speed of towing, physical dimensions and weight of the gear, type of substratum and strength of currents or tides in the area fished. The effects may persist for a few hours in shallow waters with strong tides or for decades in the deep sea (Jennings and Kaiser, 1998). Direct consequences include the modification of the