UNIVERSIDADE DE LISBOA
FACULDADE DE CIÊNCIAS
DEPARTAMENTO DE ENGENHARIA GEOGRÁFICA, GEOFÍSICA E ENERGIA
The land-atmosphere coupling and climate extremes in Africa
João António Martins Careto
Mestrado em Ciências Geofísicas
Especialização em Meteorologia
Dissertação orientada por:
Doutora Rita M. Cardoso
E
Dedicatory
To my advisors Professor Doctor Pedro Soares and Doctor Rita Cardoso for the introduction in this thematic, as well for the precious teachings and advices which contributed to the valorization of this work.
To Climate Research Unit, Global Precipitation Climatology Centre, FLUXNET global network and
Global Land Evaporation Amsterdam Model for the available observationally based data.
To my colleagues from the Climate Modeling Laboratory, from the Instituto D. Luiz (Faculdade de Ciências da Universidade de Lisboa), for all the availability, help and precious advices given.
To my friends and colleagues from Faculdade de Ciências da Universidade de Lisboa, for all the support and help during this work.
To my family and friends, for all the support, help and understanding, making this work possible.
Abstract
Soil moisture is one of the most important variables of the climate system as it constrains evapotranspiration, affecting the water and energy balances at the surface, mainly over transition areas between humid and dry climates. An analysis of the energy and moisture balance, heat waves and droughts for the Africa Coordinated Regional Downscaling Experiment (Africa-CORDEX) is performed in present climate and used to evaluate heat and moisture projections for the future. Two different RCM sets from Africa-CORDEX were exploited. One is driven by ERA-Interim reanalysis (1990-2008) and the other by Atmosphere-Ocean Global Circulation Models (AOGCMs) from the Coupled Model Intercomparison Project (CMIP5, 1960-2100), featuring the Intergovernmental Panel on Climate Change (IPCC) RCP4.5 and RCP8.5 scenarios, and focused in two periods (1971-2000 and 2071-2100). Multi-Model ensembles means were produced, for better assessing changes for the future, as well as the relationship between the fluxes partitioning and heat waves. Precipitation, Soil Moisture, Latent and Sensible Heat Fluxes, Mean, Maximum and Minimum Temperatures are also assessed and validated against observationally based databases (CRU, GPCC, FLUXNET and GLEAM) for seasonal and climatological time-scales. Overall, models display a good agreement with observations, except for some cases where strong biases are found over large areas of Africa. The multi-model ensemble is found to perform better than individual models. However, the few observations over Africa, limit the validation of individual variables and different metrics. The 10 days non-overlapping mean correlations between latent and sensible heat fluxes and, between latent and maximum temperatures are used to assess the seasonal coupling strength. Also, the Bowen ratio and the Evaporative Fraction are computed in order to evaluate the different climate evolutions and coupling for each model. Overall, all models can represent the strong soil moisture-temperature coupling regions, where those areas coincide with transition zones identified on both Bowen ratio and Evaporative Fraction. However, differences are found for individual RCMs meaning that each model represents its own reality. These strong coupling regions also correspond to regions of more heat wave events in present climate. Nonetheless, in present climate, soil moisture-temperature feedback not influence heat wave event duration, which seems to be controlled by the synoptic conditions. In future, more heat waves are expected in Africa due to an increase of mean surface temperature, but also due to changes in the spatial distribution of strong coupling regions. Drought is assessed for both Hindcast and CMIP5 simulations (Historic, RCP8.5 and RCP4.5) with the SPEI index. In the future, for both scenarios, all models agree with longer and more intense droughts over Africa. Additionally, a new coupling metric is introduced, for monthly time-scales, which considers the positive temperature extremes and the negative latent heat flux extremes. In areas where negative soil moisture anomalies influence the flux partitioning, leading to a surface increase of temperature, this metric correlate well with lower mean SPEI values for a determined period.
Resumo
A humidade do solo é uma das variáveis mais importantes no contexto do acoplamento terra-atmosfera. Em certas regiões, a humidade do solo é a principal variável que constringe a evapotranspiração, afetando o balanço energético à superfície, podendo assim afetar a temperatura na baixa troposfera. Em regiões onde anomalias negativas de humidade do solo influenciem a temperatura, eventos de seca podem levar a situações em que anomalias da temperatura sejam muito superiores áquilo que seriam em condições normais e a intensificação de eventos de onda de calor. Neste trabalho, efetua-se uma comparação entre as regiões de forte e fraco acoplamento com a distribuição espacial do número e duração média de eventos de ondas de calor, bem como uma caracterização presente e futura de secas sobre o continente africano, tendo como base modelos regionais retirados do portal do Coordinated Regional Downscaling Experiment (Africa-CORDEX) para a região de África. Duas simulações foram consideradas, uma onde os modelos regionais são forçados pela reanálise ERA-Interim (simulação
Hindcast) de 1990 a 2008, e outra onde os modelos regionais são forçados por modelos de circulação
global (Atmosphere Ocean Coupled Circulation Models, AOGCMs) de 1960 a 2100. O forçamento dos AOGCMs foi obtido a partir do portal do projeto de Intercompação de modelos fase 5 (Coupled Model Intercomparison Project Phase 5, CMIP5), considerando dois senários de forçamento radiativo no final do século XXI do IPCC: RCP 4.5 e RCP 8.5. Neste ultimo caso, a simulação é dividida em dois períodos:
Historic (1971-2000) para caracterizar o clima presente, e Future (RCP4.5 e RCP8.5 ambos no período
2071-2100) para caracterizar o clima futuro. A análise para o clima presente é feita principalmente com
Historic, onde a simulação Hindcast é usada para validar as diferentes métricas consideradas, e para o
RCP8.5, onde neste caso, anomalias entre RCP8.5 e Historic são consideradas. Ambos os cenários apresentam resultados semelhantes, mas a amplitude das diferenças para o RCP8.5 é superior. Todas as variáveis consideradas neste trabalho (precipitação, humidade do solo, fluxos de calor latente e sensível e ainda temperaturas médias, máximas e mínimas) foram avaliadas e validadas, à escala sazonal e também à escala climatológica, em relação a bases de dados construídas baseadas em observações (CRU, GPCC, FLUXNET e GLEAM). A validação é feita tendo como base mapas sazonais e climatológicos de viés para a precipitação e temperaturas, e mapas sazonais de viés para as outras variáveis. Diagramas de Taylor foram também considerados. Estes diagramas são úteis, pois permitem avaliar um modelo, em relação a uma referência, em termos de desvio padrão, correlação e erro médio quadrático para médias sazonais e climatológicas. De um modo geral, com algumas exceções, todos os modelos conseguem caracterizar o clima médio e sazonal de África. No entanto alguns modelos, em certas regiões apresentam anomalias elevadas relativamente às observações. O acoplamento entre a humidade do solo e temperatura é avaliado sazonalmente para África, considerando as correlações entre calor latente e sensível e entre calor latente e temperatura máxima, calculadas a partir de médias de 10 dias não sobrepostas. De modo geral, todos os modelos são capazes de representar as principais zonas de forte acoplamento, apresentando diferenças nas distribuições espaciais destas regiões, e que comparando com a razão de Bowen e Fração Evaporativa, correspondem a zonas de transição entre climas húmidos e áridos (i.e., climas tipo mediterrâneo). Para as ondas de calor, foi calculado o número médio de eventos normalizado pelo número de anos de cada modelo, e ainda a duração média das ondas de calor. Ambas as métricas foram determinadas para todos os períodos. No clima presente, não existe qualquer relação entre a duração média de eventos com as zonas de forte e fraco acoplamento, onde a duração é controlada principalmente pelas condições sinóticas. No entanto, existe uma relação entre o número de ondas de calor com as zonas de forte acoplamento, onde mais eventos são espectáveis de ocorrer nestas zonas em relação à média. No futuro, num cenário de alterações climáticas e com o
incremento do balanço de radiação à superfície, tanto o calor latente como o calor sensível também aumentam, de modo a manter o balanço energético à superfície, o que consequentemente leva a um aumento da temperatura à superfície. No entanto, previsões de alterações nos padrões e frequência de precipitação a nível global e aumento da capacidade de retenção de água pela atmosfera, devido ao incremento da temperatura, podem levar a uma redução geral da humidade do solo, especialmente em zonas de forte acoplamento. Esta diminuição da água disponível provoca uma anomalia negativa permanente da evapotranspiração em relação às condições presentes, levando a um subsequente aumento do fluxo de calor sensível e consequente aumento da temperatura. Para além disso, no futuro, uma expansão das regiões de forte acoplamento é previsível, onde em algumas situações, zonas que no presente são consideradas de fraco acoplamento, periodicamente ou permanentemente poderão passar a ser consideradas de regiões de forte acoplamento. Nas áreas consideradas de forte acoplamento, no presente, onde a evapotranspiração não é muito elevada, no futuro transformar-se-ão em zonas áridas ocorrendo um desacoplamento da superfície. Para além disso, no futuro, um aumento significativo na frequência e duração de ondas de calor é esperado por toda a África, exceto nas zonas mais áridas. Este aumento deve-se essencialmente ao incremento da temperatura média, mas também devido ao aumento da média e variabilidade da temperatura, provocadas pelo diferente balanço entre os fluxos. A caracterização dos eventos de secas é feita para cada período usando o índice SPEI (Standardized Precipitation Evapotranspiration Index), de modo a determinar o número de meses, fração da área com diferentes intensidades (moderada, severa e extrema) e duração média de cada evento de seca. O índice SPEI para ambos os cenários RCP, é calibrado com os valores referentes ao período Historic. No futuro, apesar dos modelos exibirem diferentes resultados entre si, todos apontam no sentido de um aumento da duração e intensidade de eventos de seca. Para além da análise feita anteriormente, uma nova medida para o acoplamento entre a humidade do solo e temperatura é introduzida aqui. Esta nova métrica resulta da soma, num determinado número de meses, da multiplicação diária entre extremos positivos da temperatura máxima e extremos negativos do fluxo de calor latente, sendo comparável com os valores médios do SPEI para esses meses. Esta métrica é avaliada para períodos de ondas de calor no continente Africano, já estudadas anteriormente. Magnitudes elevadas desta métrica correspondem a situações em que anomalias negativas da humidade do solo, efetivamente influenciam a temperatura à superfície durante ondas de calor, para uma região específica. Nessa região, existe alguma correspondência com valores negativos médios do índice SPEI. No entanto em zonas de fraco acoplamento, eventos de seca muito intensos e duradouros podem provocar situações onde a evapotranspiração passe a ser restringida pela humidade do solo e não pela energia disponível.
Index
Dedicatory
III
Abstract
IV
Resumo
V
List of Figures
VIII
List of Tables
XV
1. Introduction
1
2. Data and Methods
7
2.1 Africa-CORDEX RCM Simulations
7
a) Hindcast Simulation
8
b) Historic and Future Simulations
8
2.2 Observational Data Sets
10
a) Climate Research Unit
10
b) Global Precipitation Climatology Centre
10
c) FLUXNET
11
d) GLEAM
11
2.3 Land-Atmosphere Coupling Metrics
12
2.4 Extremes
14
a) Heat Waves Indices
14
b) Drought Index (SPEI)
14
c) Latent Heat Flux-Temperature Coupling Magnitude
17
3. Model and Ensembles Validation
20
3.1 Climatological Precipitation, Maximum, Mean and Minimum Temperatures
against CRU Database
20
3.2 Precipitation against GPCC Dataset
26
3.3 Seasonal Upward Surface Fluxes, Soil Moisture and Temperatures
29
4. Land-Atmosphere Coupling and Extremes in Present Climate
33
4.1 Surface Fluxes
33
4.2 Pearson Correlations
37
a) Evaporative Fraction and Soil Moisture
37
b) Latent and Sensible Heat Fluxes
40
4.3 Heat Waves
45
4.4 Drought, SPEI 12-months timescale
48
4.5 Latent Heat Flux-Temperature Coupling Magnitude
52
5. Land-Atmosphere Coupling and Extremes in Future Climate
55
5.1 Surface Fluxes
57
5.2 Pearson Correlations:
59
a) Evaporative Fraction and Soil Moisture
59
b) Latent and Sensible Heat Fluxes
62
5.3 Heat Waves
66
5.4 Drought, SPEI 12-months timescale
69
6. Conclusions
72
References
75
List of Figures
Figure Legend Pag.
2.1 Africa-CORDEX domain. 7
2.2 PDF test, from ‘allfitdist’ toolbox for MATLAB® environment for (a) Hindcast, (b)
Historic, (c) RCP4.5 and (d) RCP8.5 based on Bayesian information criterion. 19
3.1 Climatological mean (a) Precipitation in mm day−1, (b) Mean Daily temperature in ºC, (c) Maximum Daily Temperature in ºC and (d) Minimum Daily Temperature in ºC, derived from the Climate Research Unit (CRU) gridded monthly data for the Historic period (1971 to 2000).
20 3.2 Precipitation bias in mm day−1 relative to CRU database (Figure 3.1a) for the
climatological mean for Historic (1971-2000). Hindcast (1990-2008) ensemble is also shown.
22 3.3 Mean temperature bias in ºC relative to CRU database (Figure 3.1b) for the
climatological mean for Historic (1971-2000). Hindcast (1990-2008) ensemble is also shown.
22
3.4 Maximum temperature (TASMAX) bias in ºC relative to CRU database (Figure
3.1c) for the climatological mean for Historic (1971-2000). Hindcast (1990-2008) ensemble is also shown.
23
3.5 Minimum temperature (TASMIN) bias in ºC relative to CRU database (Figure 3.1d)
for the climatological mean for Historic (1971-2000). Hindcast (1990-2008) ensemble is also shown.
23 3.6 Taylor diagram of Historic, a) Precipitation, b) Daily Mean Temperature, c) Daily
Maximum Temperature, d) Daily Minimum Temperature and for Hindcast, e) Precipitation, f) Daily mean Temperature, g) Daily Maximum Temperature, h) Daily Minimum Temperature relative to CRU database. On each diagram, the red dot denotes the ensemble mean.
24
3.7 Seasonal Taylor diagrams for the Historic (1971-2000) for (columns) TAS, TASMAX and TASMIN. The seasons are (rows) MAM, JJA, SON and DJF. On each diagram, the red dot denotes the ensemble mean.
25 3.8 Seasonal and climatological precipitation derived from the Global Precipitation
Climatology Centre (GPCC) for the Historic period (1971-2000) for (a) MAM, (b) JJA, (c) SON, (d) DJF and (e) climatological.
27 3.9 Historic model and ensemble precipitation (PR) biases relative to the GPCC
database (Figure 3.7) for the period 1971 to 2000. 28
3.10 Taylor diagrams for precipitation of all models and ensemble from the Historic (1971-2000) relative to GPCC database for a) MAM, b) JJA, c) SON, d) DJF and e) climatological. On each diagram, the red dot denotes the ensemble mean.
28
3.11 Seasonal Taylor diagrams for the Historic (1971-2000) for (columns) HFLS, HFSS
and MRSO. The seasons (rows) are MAM, JJA, SON and DJF. On each diagram, the red dot denotes the ensemble mean.
29 3.12 Mean daily cycles of the nearest grid point from the Historic and Hindcast
ensembles for the HFLS against three FLUXNET stations: a) SD-DEM, b) SN-DHR and c) ZA-KRU.
31 3.13 Mean daily cycles of the nearest grid point from the Historic and Hindcast
ensembles for the HFSS against three FLUXNET stations: a) SD-DEM, b) SN-DHR and c) ZA-KRU.
32
4.1 MAM (a) Bowen ratio and (b) Evaporative Fraction for Historic (1971-2000). The
Hindcast (1990-2008) ensemble is also shown. 34
4.2 JJA (a) Bowen ratio and (b) Evaporative Fraction for Historic (1971-2000). The
4.3 SON (a) Bowen ratio and (b) Evaporative Fraction for Historic (1971-2000). The
Hindcast (1990-2008) ensemble is also shown. 35
4.4 DJF (a) Bowen ratio and (b) Evaporative Fraction for Historic (1971-2000). The
Hindcast (1990-2008) ensemble is also shown. 35
4.5 MAM 10 days of nonoverlapping means correlation between MRSO and
Evaporative Fraction (EVAPFR) for Historic (1971-2000). The Hindcast (1990-2008) ensemble is also shown. Values lower than 0 are depicted as gray.
38
4.6 JJA 10 days of nonoverlapping means correlation between MRSO and Evaporative
Fraction (EVAPFR) for Historic (1971-2000). The Hindcast (1990-2008) ensemble is also shown. Values lower than 0 are depicted as gray.
38
4.7 SON 10 days of nonoverlapping means correlation between MRSO and Evaporative
Fraction (EVAPFR) for Historic (1971-2000). The Hindcast (1990-2008) ensemble is also shown. Values lower than 0 are depicted as gray.
39
4.8 DJF 10 days of nonoverlapping means correlation between MRSO and Evaporative
Fraction (EVAPFR) for Historic (1971-2000). The Hindcast (1990-2008) ensemble is also shown. Values lower than 0 are depicted as gray.
39
4.9 MAM 10 days of nonoverlapping means correlation between HFLS and HFSS for
Historic (1971-2000). The Hindcast (1990-2008) ensemble is also shown. Correlations below the 20% significance level and areas of low Evaporative Fraction (less than 0.1) are depicted as gray.
41
4.10 JJA 10 days of nonoverlapping means correlation between HFLS and HFSS for
Historic (1971-2000). The Hindcast (1990-2008) ensemble is also shown. Correlations below the 20% significance level and areas of low Evaporative Fraction (less than 0.1) are depicted as gray.
41
4.11 SON 10 days of nonoverlapping means correlation between HFLS and HFSS for
Historic (1971-2000). The Hindcast (1990-2008) ensemble is also shown. Correlations below the 20% significance level and areas of low Evaporative Fraction (less than 0.1) are depicted as gray.
43
4.12 DJF 10 days of nonoverlapping means correlation between HFLS and HFSS for
Historic (1971-2000). The Hindcast (1990-2008) ensemble is also shown. Correlations below the 20% significance level and areas of low Evaporative Fraction (less than 0.1) are depicted as gray.
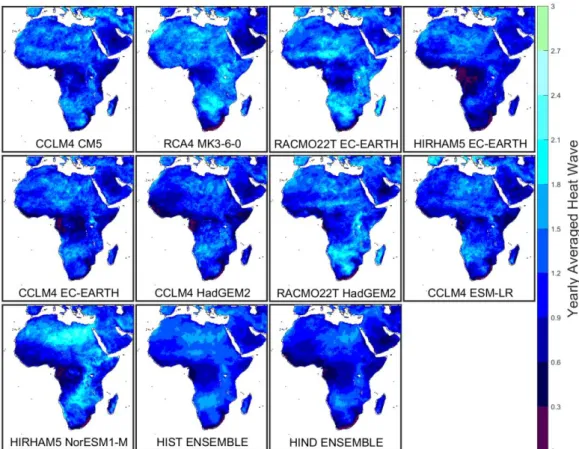
43 4.13 Yearly average number of heat waves for the Historic (1971-2000). Hindcast
(1990-2008) ensemble is also shown. 46
4.14 Mean heat wave duration for Historic (1971-2000). Hindcast (1990-2008) ensemble
is also shown. 46
4.15 Boxplot of number of months in drought (percentage of months with SPEI below
-1), for all land points of the Historic (1971-2000). The ensemble is the data of all models. Hindcast (1990-2008) ensemble is also shown.
49 4.16 Boxplots of the fraction area in drought with different drought intensities (orange:
fraction area in moderate drought; red: fraction area in severe drought; dark red: fraction area in extreme drought), over time for all land points for the Historic (1971-2000). The ensemble is the data of all models. Hindcast (1990-2008) ensemble is also shown.
50
4.17 Boxplot of mean drought duration for all land points of Historic (1971-2000) normalized by the number of year of each model. The ensemble is the data of all models. Hindcast (1990-2008) ensemble is also shown.
50 4.18 Magnitudes and SPEI index for known heat waves periods, based on Russo et al.
(2016). Temperature Magnitude (MT) for (a) DJF of 1997-1998, (b) MAM of 1998, (c) DJF of 2004-2005 and (d) SON of 2008. Latent Heat Flux Magnitude (MH) (e) DJF of 1997-1998, (f) MAM of 1998, (g) DJF of 2004-2005 and (h) SON of 2008. Latent Heat Flux-Temperature Coupling Magnitude (LETCM) (i) DJF of 1997-1998, (j) MAM of 1997-1998, (k) DJF of 2004-2005 and (l) SON of 2008. Mean values of SPEI index (m) DJF of 1997-1998, (n) MAM of 1998, (o) DJF of 2004-2005 and (p)
SON of 2008. Black boxes denote areas of strong soil moisture-temperature coupling.
4.19 Probability of exceeding a certain Latent Heat Flux-Temperature Coupling Magnitude (LETCM) for Hindcast (green), Historic (black), RCP4.5 (blue) and RCP8.5 (red) for all land points of the Africa-CORDEX domain. These magnitudes are computed as the sum of a daily magnitude that results from the multiplication between the Temperature Magnitude (MT) and Latent Heat Flux Magnitude (MH) from March to February for all years of each. Bolt lines denotes the multi-model ensemble.
54
5.1 (a) HFLS and (b) HFSS anomalies between RCP8.5 (2071-2100) and Historic
(1971-2000) ensembles. 56
5.2 (a) PR, (b) TASMAX and (c) TASMIN anomalies between RCP8.5 (2071-2100)
and Historic (1971-2000) ensembles. 56
5.3 (a) MAM and (b) JJA Evaporative Fraction anomalies between RCP8.5 (2071-2100)
and Historic (1971-2000). The RCP4.5 (2071-2100) ensemble is also shown. 57
5.4 (a) SON and (b) DJF Evaporative Fraction anomalies between RCP8.5 (2071-2100)
and Historic (1971-2000). The
RCP4.5 (2071-2100) ensemble is also shown.
58
5.5 MAM 10 days of nonoverlapping means correlation between MRSO and
Evaporative Fraction (EVAPOFR) anomalies between RCP8.5 (2071-2100) and Historic (1971-2000). The RCP4.5 (2071-2100) ensemble anomaly is also shown.
60
5.6 JJA 10 days of nonoverlapping means correlation between MRSO and Evaporative
Fraction (EVAPOFR) anomalies between RCP8.5 (2071-2100) and Historic (1971-2000). The RCP4.5 (2071-2100) ensemble anomaly is also shown.
60
5.7 SON 10 days of nonoverlapping means correlation between MRSO and Evaporative
Fraction (EVAPOFR) anomalies between RCP8.5 (2071-2100) and Historic (1971-2000). The RCP4.5 (2071-2100) ensemble anomaly is also shown.
61
5.8 DJF 10 days of nonoverlapping means correlation between MRSO and Evaporative
Fraction (EVAPOFR) anomalies between RCP8.5 (2071-2100) and Historic (1971-2000). The RCP4.5 (2071-2100) ensemble anomaly is also shown.
61
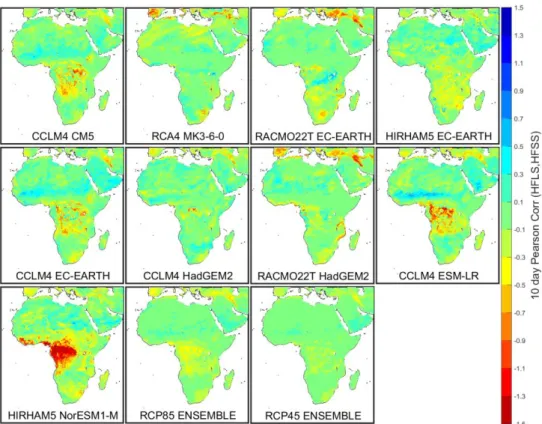
5.9 MAM 10 days of nonoverlapping means correlation between latent heat flux
(HFLS) and sensible heat flux (HFSS) anomalies between RCP8.5 (2071-2100) and Historic (1971-2000). The RCP4.5 (2071-2100) ensemble is also shown.
63 5.10 JJA 10 days of nonoverlapping means correlation between latent heat flux (HFLS)
and sensible heat flux (HFSS) anomalies between RCP8.5 (2071-2100) and Historic (1971-2000). The RCP4.5 (2071-2100) ensemble is also shown.
63
5.11 SON 10 days of nonoverlapping means correlation between latent heat flux (HFLS)
and sensible heat flux (HFSS) anomalies between RCP8.5 (2071-2100) and Historic (1971-2000). The RCP4.5 (2071-2100) ensemble is also shown.
64 5.12 DJF 10 days of nonoverlapping means correlation between latent heat flux (HFLS)
and sensible heat flux (HFSS) anomalies between RCP8.5 (2071-2100) and Historic (1971-2000). The RCP4.5 (2071-2100) ensemble is also shown.
64
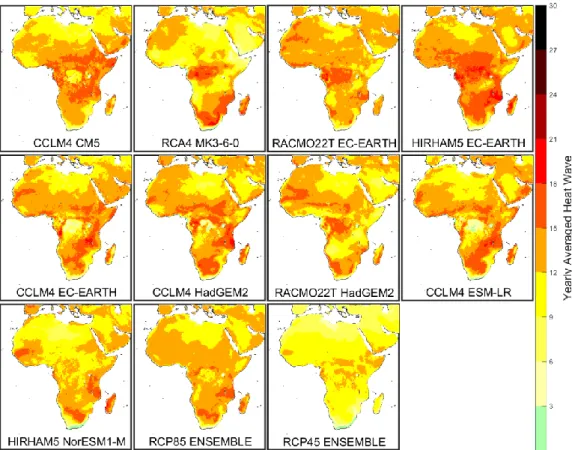
5.13 Yearly average number of heat waves for the RCP8.5 (2071-2100). RCP4.5
(2070-2100) ensemble is also shown. For the RCP8.5 and RCP4.5, the Historic 90th
percentile was used
67
5.14 Mean heat wave duration for RCP8.5 (2071-2100). RCP4.5 (2071-2100) ensemble
is also shown. 67
5.15 Boxplots of number of months in drought (percentage of months with SPEI below
-1), for all land points of the RCP8.5 (2071-2100) models. The ensemble is the data of all models. RCP4.5 (2071-2100) ensemble is also shown. SPEI index for RCP8.5 and RCP4.5 are computed based on Historic as reference period.
69 5.16 Fraction area in drought, with different intensities (orange: fraction area in moderate
drought; red: fraction area in severe drought; dark red: fraction area in extreme drought), over time for all land points for the RCP8.5 (2071-2100) models. The ensemble is the data of all models. RCP4.5 (2071-2100) ensemble is also shown.
SPEI index for RCP8.5 and RCP4.5 are computed based on Historic as reference period.
5.17 Boxplot of mean drought duration for all land points of RCP8.5 (2071-2100) normalized by the number of years of each model. The ensemble the data of all models. RCP4.5 (2071-2100) ensemble is also shown. SPEI index for RCP8.5 and RCP4.5 are computed based on Historic as reference period.
70 A.1 (a) Climatological mean Precipitation in mm day−1, (b) Mean Daily temperature in
ºC, (b) Maximum Daily Temperature in ºC and (c) Minimum Daily Temperature in ºC, derived from the Climate Research Unit (CRU) gridded monthly data for the Hindcast period (1990 to 2008).
79
A.2 Precipitation bias in mm day−1 relative to CRU database (Figure 3.1a) for the
climatological mean for Hindcast (1990-2008). 79
A.3 Mean temperature bias in ºC relative to CRU database (Figure 3.1b) for the
climatological mean for Hindcast (1990-2008). 80
A.4 Maximum temperature (TASMAX) bias in ºC relative to CRU database (Figure
3.1c) for the climatological mean for Hindcast (1990-2008). 80
A.5 Minimum temperature (TASMIN) bias in ºC relative to CRU database (Figure 3.1b)
for the climatological mean for Hindcast (1990-2008). 80
A.6 Regions localizations and climate types over Africa mainland and Madagascar
island following the Köppen-Geiger climate classification. These regions were chosen based on land-atmosphere coupling results from Koster et al. (2006); Seneviratne et al. (2010); Miralles et al. (2012) and Lorenz et al. (2015); and from the domains used by Hernández-Díaz et al. (2013) overlapped on Figure 4 from Peel et al. (2007).
81
A.7 MAM (a) Bowen ratio and (b) Evaporative Fraction for Hindcast (1990-2008). 82
A.8 JJA (a) Bowen ratio and (b) Evaporative Fraction for Hindcast (1990-2008). 83
A.9 SON (a) Bowen ratio and (b) Evaporative Fraction for Hindcast (1990-2008). 84
A.10 DJF (a) Bowen ratio and (b) Evaporative Fraction for Hindcast (1990-2008). 85
A.11 MAM 10 days of nonoverlapping means correlation between MRSO and
Evaporative Fraction (EVAPFR) for Hindcast (1990-2008). Values lower than 0 are depicted as gray.
86
A.12 JJA 10 days of nonoverlapping means correlation between MRSO and Evaporative
Fraction (EVAPFR) for Hindcast (1990-2008). Values lower than 0 are depicted as gray.
86
A.13 SON 10 days of nonoverlapping means correlation between MRSO and Evaporative
Fraction (EVAPFR) for Hindcast (1990-2008). Values lower than 0 are depicted as gray.
86
A.14 DJF 10 days of nonoverlapping means correlation between MRSO and Evaporative
Fraction (EVAPFR) for Hindcast (1990-2008). Values lower than 0 are depicted as gray.
87
A.15 MAM 10 days of nonoverlapping means correlation between HFLS and HFSS for
Hindcast (1990-2008). Correlations below the 20% significance level and areas of low Evaporative Fraction (less than 0.1) are depicted as gray.
87
A.16 JJA 10 days of nonoverlapping means correlation between HFLS and HFSS for
Hindcast (1990-2008). Correlations below the 20% significance level and areas of low Evaporative Fraction (less than 0.1) are depicted as gray.
87
A.17 SON 10 days of nonoverlapping means correlation between HFLS and HFSS for
Hindcast (1990-2008). Correlations below the 20% significance level and areas of low Evaporative Fraction (less than 0.1) are depicted as gray.
88
A.18 DJF 10 days of nonoverlapping means correlation between HFLS and HFSS for
Hindcast (1990-2008). Correlations below the 20% significance level and areas of low Evaporative Fraction (less than 0.1) are depicted as gray.
88
A.19 MAM 10 days of nonoverlapping means correlation between HFLS and TASMAX
for Hindcast (1990-2008). Correlations below the 20% significance level and areas of low Evaporative Fraction (less than 0.1) are depicted as gray.
A.20 JJA 10 days of nonoverlapping means correlation between HFLS and TASMAX for Hindcast (1990-2008). Correlations below the 20% significance level and areas of low Evaporative Fraction (less than 0.1) are depicted as gray.
89
A.21 SON 10 days of nonoverlapping means correlation between HFLS and TASMAX
for Hindcast (1990-2008). Correlations below the 20% significance level and areas of low Evaporative Fraction (less than 0.1) are depicted as gray.
89
A.22 DJF 10 days of nonoverlapping means correlation between HFLS and TASMAX for
Hindcast (1990-2008). Correlations below the 20% significance level and areas of low Evaporative Fraction (less than 0.1) are depicted as gray.
89
A.23 MAM 10 days of nonoverlapping means correlation between HFLS and Daily
Maximum Near Surface Air Temperature (TASMAX) for Historic (1971-2000). Hindcast (1990-2000) ensemble is also shown. Correlations below the 20%
significance level and areas of low Evaporative Fraction (less than 0.1) are depicted as gray.
90
A.24 JJA 10 days of nonoverlapping means correlation between HFLS and TASMAX for
Historic (1971-2000). Hindcast (1990-2000) ensemble is also shown. Correlations below the 20% significance level and areas of low Evaporative Fraction (less than 0.1) are depicted as gray.
90
A.25 SON 10 days of nonoverlapping means correlation between HFLS and TASMAX
for Historic (1971-2000). Hindcast (1990-2000) ensemble is also shown. Correlations below the 20% significance level and areas of low Evaporative Fraction (less than 0.1) are depicted as gray.
91
A.26 DJF 10 days of nonoverlapping means correlation between HFLS and TASMAX for
Historic (1971-2000). Hindcast (1990-2000) ensemble is also shown. Correlations below the 20% significance level and areas of low Evaporative Fraction (less than 0.1) are depicted as gray.
91
A.27 Yearly average number of heat waves for the Hindcast (1990-2008). 92
A.28 Mean heat wave duration for Hindcast (1990-2008). 92
A.29 Boxplots of number of months in drought (percentage of moths with SPEI below -1)
for all land points for the (left) Hindcast ensemble (1990-2008) and (right) Historic ensemble (1971-2000), against SPEI computed with CRU database for the same periods respectively. Blue boxplots are relative to modeled SPEI and red boxplots are relative to CRU SPEI.
92
A.30 Fraction area in (a) moderate drought (SPEI between -1 and -1.5), (b) severe
drought (SPEI between -1.5 and -2) and (c) extreme drought (SPEI bellow -2) for all land points for the Hindcast ensemble (1990-2008) against SPEI computed with CRU database for the same period (black line).
93 A.31 Boxplots of fraction area in (left) moderate drought (SPEI between -1 and -1.5),
(center) severe drought (SPEI between -1.5 and -2) and (right) extreme drought (SPEI bellow -2) for Hindcast (1990-2008) against SPEI computed with CRU database. Blue boxplots are relative to modeled SPEI and red boxplots are relative to CRU SPEI.
93
A.32 Boxplots of fraction area in (left) moderate drought (SPEI between -1 and -1.5), (center) severe drought (SPEI between -1.5 and -2) and (right) extreme drought (SPEI bellow -2) for Historic (1971-2000) against SPEI computed with CRU database. Blue boxplots are relative to modeled SPEI and red boxplots are relative to CRU SPEI.
93
A.33 Boxplots of mean drought duration for all land points for (left) Hindcast (1990-2008) and (right) Historic (1971-2000) against SPEI computed using CRU database. Blue boxplots are relative to modeled SPEI values and red boxplots are relative to CRU SPEI.
94 A.34 Boxplots of the percentage of number of months in drought, for all land points of
A.35 Fraction area in drought, with different intensities (yellow: fraction area in moderate drought; red: fraction area in severe drought; dark red: fraction area in extreme drought), over time for all land points for the Hindcast (1990-2008).
94 A.36 Boxplots of the fraction area in drought with different intensities (yellow: fraction
area in moderate drought; red: fraction area in severe drought; dark red: fraction area in extreme drought), over time for all land points for the Hindcast (1990-2008). The ensemble is the data of all models.
95 A.37 Boxplot of t mean drought duration for all land points of Hindcast (1990-2008)
divided by the number of years. The ensemble is the data of all models. 95
A.38 MAM Bowen ratio anomalies between RCP8.5 (2071-2100) and Historic
(1971-2000). The RCP4.5 (2071-2100) ensemble is also shown. 96
A.39 JJA Bowen ratio anomalies between RCP8.5 (2071-2100) and Historic (1971-2000).
The RCP4.5 (2071-2100) ensemble is also shown. 96
A.40 SON Bowen ratio anomalies between RCP8.5 (2071-2100) and Historic
(1971-2000). The RCP4.5 (2071-2100) ensemble is also shown. 97
A.41 DJF Bowen ratio anomalies between RCP8.5 (2071-2100) and Historic
(1971-2000). The RCP4.5 (2071-2100) ensemble is also shown. 97
A.42 MAM (a) Bowen ratio and (b) Evaporative Fraction anomalies between RCP4.5
(2071-2100) and Historic (1971-2000). 98
A.43 JJA (a) Bowen ratio and (b) Evaporative Fraction anomalies between RCP4.5
(2071-2100) and Historic (1971-2000). 99
A.44 SON (a) Bowen ratio and (b) Evaporative Fraction anomalies between RCP4.5
(2071-2100) and Historic (1971-2000). 100
A.45 DJF (a) Bowen ratio and (b) Evaporative Fraction anomalies between RCP4.5
(2071-2100) and Historic (1971-2000). 101
A.46 MAM 10 days of nonoverlapping means correlation between MRSO and
Evaporative Fraction (EVAPOFR) anomalies between RCP4.5 (2071-2100) and Historic (1971-2000).
101
A.47 JJA 10 days of nonoverlapping means correlation between MRSO and Evaporative
Fraction (EVAPOFR) anomalies between RCP4.5 (2071-2100) and Historic (1971-2000).
102
A.48 SON 10 days of nonoverlapping means correlation between MRSO and Evaporative
Fraction (EVAPOFR) anomalies between RCP4.5 (2071-2100) and Historic (1971-2000).
102
A.49 DJF 10 days of nonoverlapping means correlation between MRSO and Evaporative
Fraction (EVAPOFR) anomalies between RCP4.5 (2071-2100) and Historic (1971-2000).
102
A.50 MAM 10 days of nonoverlapping means correlation between HFLS and HFSS
anomalies between RCP4.5 (2071-2100) and Historic (1971-2000) for all models and ensemble.
103
A.51 JJA 10 days of nonoverlapping means correlation between HFLS and HFSS
anomalies between RCP4.5 (2071-2100) and Historic (1971-2000) for all models and ensemble.
103
A.52 SON 10 days of nonoverlapping means correlation between HFLS and HFSS
anomalies between RCP4.5 (2071-2100) and Historic (1971-2000) for all models and ensemble.
103
A.53 DJF 10 days of nonoverlapping means correlation between HFLS and HFSS
anomalies between RCP4.5 (2071-2100) and Historic (1971-2000) for all models and ensemble.
104
A.54 MAM 10 days of nonoverlapping means correlation between HFLS and TASMAX
anomalies between RCP4.5 (2071-2100) and Historic (1971-2000) for all models and ensemble.
104
A.55 JJA 10 days of nonoverlapping means correlation between HFLS and TASMAX
anomalies between RCP4.5 (2071-2100) and Historic (1971-2000) for all models and ensemble.
A.56 SON 10 days of nonoverlapping means correlation between HFLS and TASMAX anomalies between RCP4.5 (2071-2100) and Historic (1971-2000) for all models and ensemble.
105
A.57 DJF 10 days of nonoverlapping means correlation between HFLS and TASMAX
anomalies between RCP4.5 (2071-2100) and Historic (1971-2000) for all models and ensemble.
105
A.58 MAM 10 days of nonoverlapping means correlation between latent heat flux
(HFLS) and TASMAX anomalies between RCP8.5 (2071-2100) and Historic (1971-2000). The RCP4.5 (2071-2100) ensemble is also shown.
106 A.59 JJA 10 days of nonoverlapping means correlation between latent heat flux (HFLS)
and TASMAX anomalies between RCP8.5 (2071-2100) and Historic (1971-2000). The RCP4.5 (2071-2100) ensemble is also shown.
106
A.60 SON 10 days of nonoverlapping means correlation between latent heat flux (HFLS)
and TASMAX anomalies between RCP8.5 (2071-2100) and Historic (1971-2000). The RCP4.5 (2071-2100) ensemble is also shown.
107 A.61 DJF 10 days of nonoverlapping means correlation between latent heat flux (HFLS)
and TASMAX anomalies between RCP8.5 (2071-2100) and Historic (1971-2000) for all models and ensemble. The RCP4.5 (2071-2100) ensemble is also shown.
107
A.62 Number of heat waves normalized by the number of years of each model anomalies
between RCP4.5 (2071-2100) and Historic (1971-2000). 108
A.63 Mean heat wave duration for RCP4.5 (2071-2100). 108
A.64 Boxplot of months in drought (percentage of months with SPEI bellow -1) for all
land points of the RCP4.5 (2071-2100). The ensemble is the data of all models. 108
A.65 Boxplot of the fraction area with different drought intensities (orange – moderate drought, red – severe drought and dark red – extreme drought) for all land points for RCP4.5 (2071-2100). The ensemble is the data of all models.
109 A.66 Boxplots of mean drought duration for all land points for RCP4.5 (2071-2100)
List of Tables
Table Legend Pag.
2.1 Africa-CORDEX Hindcast RCMs. 8
2.2 Africa-CORDEX Historic and Future RCMs. 9
2.3 Africa-FLUXNET stations characteristics. 11
2.4 Drought index classifications for SPEI. 17
3.1 Regional boxes (vertices). 30
3.2 Pearson correlations between Historic (1980-2000) total soil moisture and root-zone soil moisture taken from GLEAM database for the Africa-CORDEX focus domain and regions defined on Table 3.1 and Figure A.6. The correlation for the Hindcast ensemble (1990-2008) is also shown.
31
4.1 Seasonal Historic ensemble (1971-2000) Bowen ratio, Evaporative Fraction, 10 days
of nonoverlapping means correlations between MRSO and HFLS, between HFLS and HFSS and between HFLS and TASMAX for all regions and Africa-CORDEX domain. Red values denote the JJA and DJF main strong coupling regions. Also, values for the domain mean for the same seasons are highlighted.
44
4.2 Annual mean number of heat waves, mean heat wave duration and 10 days of nonoverlapping means correlation between HFLS and HFSS for the Historic ensemble (1971-2000). Values depicted as red represents the mean over the main strong coupling regions and Africa-CORDEX domain for JJA and DJF.
47
4.3 Median of the number of months in drought, fraction area in drought (moderate, severe and extreme) and number of droughts for the ensemble of Hindcast and Historic. Between parenthesis is the difference between Historic and Hindcast.
51
5.1 Seasonal RCP8.5 ensemble (2071-2100) Bowen ratio, Evaporative Fraction, 10 days
of nonoverlapping means correlations between MRSO and HFLS, between HFLS and HFSS and between HFLS and TASMAX for all regions and Africa-CORDEX domain. Red values denote the JJA and DJF main strong coupling regions. Also, values for the domain mean for the same seasons are highlighted. Blue values indicate the new strong coupling region for the JJA.
65
5.2 Annual mean number of heat waves, mean heat wave duration and 10 days of nonoverlapping means correlation between HFLS and HFSS for the RCP8.5 ensemble (1971-2000). Values depicted as red represents the mean over the main strong coupling regions and Africa-CORDEX domain for JJA and DJF.
68
5.3 Median of the number of months in drought, fraction area in drought (moderate, severe and extreme) and number of droughts for the ensemble of Hindcast, Historic, RCP4.5 and RCP8.5. Between parenthesis is the difference between Historic and Hindcast, RCP4.5 and Historic, RCP8.5 and Historic.
71
A.1 Pearson correlations between Hindcast (1990-2008) total soil moisture and root-zone soil moisture taken from GLEAM database for the Africa-CORDEX focus domain and regions defined on Table 3.1 and Figure A.6.
List of abbreviations, acronyms and
symbols
AOGCM - Atmosphere-Ocean Coupled Global Circulation Model; CDF - Cumulative Distribution Function;
CORDEX - Coordinated Regional Downscaling Experiment; CRU - Climate Research Unit;
ECMWF - European Centre for Medium-Range Weather Forecasts; EVAPFR – Evaporative Fraction;
GLACE - Global Land-Atmosphere Coupling Experiment; GLEAM - Global Land Evaporation Amsterdam Model; GPCC - Global Precipitation Climatology Centre; HFLS - Surface Upward Latent Heat Flux; HFSS - Surface Upward Sensible Heat Flux;
IPCC - Intergovernmental Panel on Climate Change; IQR – Inter-Quartile Range ;
ITCZ - Intertropical Convergence Zone ;
LETCM - Latent Heat Flux-Temperature Coupling Magnitude; MH - Latent Heat Flux Magnitude;
MT - Temperature Magnitude;
MRSO – Total (i.e. vertically integrated) Soil Moisture Content; PDF - Probability Density Function;
PDSI - Palmer Drought Severity Index; PET - Potential Evapotranspiration; PR - Precipitation;
RCM - Regional Climate Model;
RCP - Representative Concentration Pathways; RMSE - Root Mean Square Error;
RSDS - Shortwave Downwelling Radiation; SD - Standard Deviation;
SPEI - Standardized Precipitation Evapotranspiration Index; TAS - Near-Surface Air Temperature;
TASMAX - Daily-Maximum Near-Surface Air Temperature; TASMIN - Daily-Minimum Near-Surface Air Temperature; DJF - December, January and February season;
MAM - March, April and May season; JJA - June, July and August season;
SON - September, October and November season; NA-SA - Northern Africa Semi-Arid region; NA-SW - Northern Africa Semi-Humid region; EA - East Africa region;
CNA – Central Northern Africa region; CSA - Central Southern Africa region; SA-W - South Africa-West region;
1. Introduction
Droughts and heat wave events are some of the most deadly and costly climate extremes (Easterling et al., 2000a and b; Robinson., 2001; Vicente-Serrano., 2006; Vicente-Serrano et al., 2010) and are projected to be more frequent and intense in the future (Schär et al., 2004; Seneviratne et al., 2006, 2010, Fontaine et al., 2013; Russo et al., 2014, 2016; Lorenz et al., 2015). In certain areas of the globe (e.g. Mediterranean and Sahel), drought and heat waves are tightly connected, as a dry spell might induce stronger heat waves through land-atmosphere coupling (Fischer et al., 2007a and b; Fischer and Schär., 2010; Seneviratne et al., 2010; Hirschi et al., 2011; Miralles et al., 2012). Conversely, heat waves might cause soil dissection leading to or intensifying a drought event.
Transition areas between wet and dry climates are considered regions of strong land-atmosphere coupling (Koster et al., 2006; Seneviratne et al., 2006, 2010, 2012; Fischer et al., 2007a and b; Miralles et al., 2012; Lorenz et al., 2015; Knist et al., 2017). The variability of these transition areas is higher, for variables such as the surface or root-zone soil moisture, latent heat flux (or evapotranspiration), sensible heat flux and surface temperature (e.g. Seneviratne et al., 2006; 2010; Lorenz et al., 2015). A large part of this variability is due to the soil moisture-temperature feedback (Seneviratne et al., 2006, 2010; Fischer et al., 2007a and b; Fischer and Schär., 2010). In the literature, the terms coupling and feedback are used indifferently. Seneviratne et al. (2010) defined coupling as the degree to which one variable controls another. A two-way coupling is called feedback, and represents the interactions between two or more variables. Coupling isn’t limited to states or processes (e.g. soil moisture-temperature coupling), it could be related to interfaces, just as the interface between the soil and atmosphere (e.g. land-atmosphere coupling). In this case, it relates to the degree in which ground processes will affect the lower atmosphere. Koster et al. (2006) defined land-atmosphere coupling strength as the degree to which anomalies at the land surface will affect or interact with low tropospheric processes. Coupling cannot be determined a priori by looking at the code of a model, neither is explicitly parametrized. However, it results from complex interactions between numerous processes, which are frequently parametrized, e.g., evapotranspiration.
One of the most important variables in the context of land-atmosphere coupling is soil moisture. Generally, soil moisture is defined as the water present in unsaturated soil (Seneviratne et al., 2010). In the context of the current work only the land energy balance and the feedback between surface properties and temperature is relevant. The energy balance at the surface considers the radiative balance, storage, transport, sensible and latent heat fluxes. The radiative balance at the surface, during the day is positive, meaning an excess of energy. This excess of energy is mostly compensated by sensible and latent heat fluxes towards the atmosphere which are highly relevant to the soil moisture-temperature feedback. This feedback has three components: first, the relationship between soil moisture and latent heat flux; second, the balance between latent and sensible heat fluxes; third, the relationship between sensible heat flux and near surface temperature. If there is an increase of radiation at the surface, latent heat flux or evapotranspiration rises, through the evaporation of soil moisture. If there is no reestablishment over time, soil moisture decreases, leading to a possible drought event and to a decrease of the latent heat flux. To keep the surface energy balance, and considering that transport and storage of energy is negligible, a decrease of the latent heat flux will lead to an increase of the sensible heat flux, which in turn, will lead to an increase of surface temperature. This soil moisture-temperature feedback may progress until there is no more soil water to evaporate, reaching a maximum temperature or, more plausible, as long as synoptic conditions would allow it, and that may evolve to a heat wave event (Miralles et al., 2014).
One of the first metrics created to quantify the land-atmosphere coupling was developed by Koster et al. (2002, 2004, 2006), the Global Land-Atmosphere Coupling Experiment (GLACE). GLACE is a model inter-comparison study and consists of two idealized ensembles. The first is a ‘write’ ensemble, where soil moisture is computed and saved at each time-step. The second is a ‘read’ ensemble, where, at each time step, soil moisture is substituted by the climatological soil moisture of the first ensemble. The coupling metric is obtained by the difference between normalised variances of two ensembles under investigation (Lorenz et al., 2015). The objective of this study is the identification of “hot spots” or regions of strong coupling for numerous models, and is focused on impacts of soil moisture on sub-seasonal climate variability. While GLACE only considers an ensemble simulation for a single year or season, Seneviratne et al. (2006) proposed an alternative, to access the impact of soil moisture-temperature coupling on longer time scales, in which a multiyear simulation is considered. Seneviratne et al. (2006) also proposed a variance analysis, using a coupled and an uncoupled simulation, which describes the percentage of inter-annual variance of the mean seasonal temperatures that can be explained by land-atmosphere coupling. This is computed as the subtraction of the variances of the coupled and uncoupled simulations, divided by the variance of the coupled simulation. Both metrics are similar, as both explain the amount of variance due only to land-atmosphere coupling. GLACE-type experiments are complex and computationally demanding (Lorenz et al., 2015), therefore, over time, other coupling metrics were developed (e.g. Dirmeyer, 2011; Findell et al., 2011; Miralles et al., 2012 and Decker et al., 2015). Miralles et al., (2012) proposed two soil moisture-temperature coupling metrics, based on observations. The first is based in the difference between two long-term correlations: one between temperature and sensible heat flux, and the other between temperature and an energy term. This energy term is computed as the difference between radiative balance minus potential latent heat flux. The second is a daily coupling metric based in anomalies of the same three terms described, all normalized by the standard deviation of each term. The correlation between latent and sensible heat fluxes and the correlation between surface air temperature and latent heat flux are also considered a useful land-atmosphere coupling metrics, as both variables are components of the surface energy balance (Knist et al., 2017). These types of metrics could be depicted as a reverse measure of the soil moisture-temperature coupling and are only meaningful on regions where evapotranspiration is relatively large (Seneviratne et al., 2006; 2010). These two metrics (Miralles et al., 2012; Knist et al., 2017) have the advantage of being able to be computed on standard model outputs and do not require special experimental designs, such as GLACE, allowing an inter-comparison between different models. Each metric described, addresses individual processes in the land-atmosphere feedback system and they can show different results. Great care should be taken when comparing different metrics, since each have different units and ranges which can lead to inconsistent inferences. Also, the definition of “strong” and “weak” coupling may not be consistent for different studies (Knist et al., 2017).
Heat waves are phenomena that often lead to high mortality, particularly in risk groups such as the elderly, infants and persons with pre-existing cardiovascular and respiratory diseases (Fischer and Schär., 2010) Heat waves are sustained periods of time when temperature is higher than a defined threshold. It is accepted that heat waves in Europe or North America requires subsidence with clear skies and advection of warm air, characteristics of a stationary anticyclonic system (Xoplaki et al., 2003; Black et al., 2004; Meehl and Tebaldi., 2004). If a stationary anticyclonic system due to a blocking pattern is present, then under these conditions, a heat wave event has a high probability of occurrence. Additionally, anomalously strong coupling may be found in areas of negative soil moisture anomalies and high atmospheric demand of water. Or, in other words, the continuous depletion of soil moisture and subsequent reduction of evapotranspiration could amplify air temperatures through the soil moisture-temperature feedback (Teuling et al., 2010; Miralles et al., 2012). Nevertheless, soil dissection and rainfall deficits, before and during a heat wave do not play a major role in the event duration, since the latter is mainly influenced by the synoptic conditions (Miralles et al., 2014). Fischer et al. (2007a b)
and Fischer and Schär. (2010) computed the number of hot days for two simulations, one fully coupled and other uncoupled, for past and future climates. In these studies, the impact of different soil moisture amounts on temperature for the 2003 European heat wave is assessed, and it is shown that negative soil moisture anomalies, due to springtime precipitation deficits and high atmospheric demand of water, effectively affected surface temperatures, with stronger anomalies over regions of soil moisture deficits. Drought is one of the main natural hazards that causes environmental, agricultural and economic damages (Vicente-Serrano et al., 2010). This phenomenon occurs when water availability is significantly below normal levels, which could be due to precipitation deficits over prolonged periods and/or high demand of water by the atmosphere (Vicente-Serrano, 2013). Drought are different from other natural disasters, since its effects accumulate slowly over time and its consequences may be present over extended periods after the event (Wilhite, 2000). Because of this, it is difficult to assess its start, duration and end, making it very problematic to quantify its intensity, magnitude and spatial extent. Drought also has a time multi-scalar characteristic (McKee et al, 1993). For example, for lower timescales in a certain period, wet and dry spells may occur intercalated, but, on longer timescales for that same period, it could be a single drought. Drought time-scales refer to the time lag that normally exists between the beginning of a drought event, and the identification of its consequences (Vicente-Serrano, 2013). Different ecosystems respond in diverse ways to drought. For example, vegetation in arid biomes react as soon as there is a water deficit. In humid biomes, plants also react to shorter time scales, but in this case, plants have poor adaptability to water shortage. On the other hand, the vegetation on transition zones respond to long time scales, since plants can withstand water deficits, but lack the fast response of arid biomes to drought (Vicente-Serrano, 2013). On long timescales, drought can not only contribute to an increase in aridity associated to the wilting of the vegetation or its replacement by sparser and more drought resistant species but also severely affect hydrological systems (Koster et al., 2004; Vautard et al., 2007; AghaKouchak et al., 2010; Dai, 2011; Dai, 1013; Vautard et al., 2007).
One of the first indices developed to objectively quantify drought was the Palmer Drought Severity Index (PDSI, Palmer., 1965). PDSI is a two-layer bucked type index that considers a simple water balance between precipitation and potential evapotranspiration for a single site (Alley, 1984). One of the main criticisms of PDSI over the years is that PDSI values are not comparable between two different locations (Alley, 1984; Karl, 1983; Soulé, 1992; Akinremi et al., 1996; Weber and Kkemdirim, 1998). Another problem with PDSI is that it does not consider the multi-scalar characteristic of drought. Subsequently, other indices appeared, such as the self-calibrated-PDSI (sc-PDSI, Wells et al., 2004) that solved most of the mentioned problems. Nevertheless, the main shortcoming of the PDSI was not solved and it relates to its fixed timescale (9 to 12 months).
The Standardized Precipitation Index (SPI, McKee et al., 1993; Vicente-Serrano., 2006) was developed and has a multi-scalar characteristic. This index can be computed for timescales higher than one month and since it is standardized it can be compared over time and space. Although the main variable that controls the beginning, duration, end and intensity of droughts is precipitation (Chang and Kleopa, 1991; Heim, 2002), the main criticism of SPI is that it does not consider other variables that can influence drought, such as evapotranspiration or wind speed. For this reason, a new index was developed, designated Standardized Precipitation Evapotranspiration Index (SPEI, Vicente-Serrano et al., 2010). SPEI combines the multi-temporal nature of SPI with the sensitivity of PDSI to changes in evapotranspiration demand, and similarly to SPI, SPEI values are comparable over time and space.
Over the last century, temperatures in Africa have risen by more than 0.5oC (Jones and Moberg, 2003; Kruger and Shongwe, 2004; Schreck and Semazzi, 2004; Christy et al., 2009; Collins, 2011), increasing the probability of heat wave events in some regions (Fontain et al., 2013). In a climate change scenario, where mean temperature increases (Hulme et al., 2001; Serdeczny et al., 2017), the probability of temperatures extremes is enhanced, and as never seen before heat waves could become more frequent,
more intense and last longer (Min et al, 2011; Coumou and Rahmstorf, 2012; IPCC, 2012; Russo et al., 2014, 2016).
One of the most useful techniques to obtain regional climate projections is the dynamical downscaling approach in which a regional climate model at high resolution, takes initial and boundary conditions from an Atmosphere-Ocean coupled Global Circulation Models (AOGCMs) with lower resolution. In this approach, the input data for climatic projections should be carefully chosen (León et al., 2012). Recently a downscaling program named Coordinated Regional Downscaling Experiment, supported by the World Climate Research Program (WCRP, CORDEX) was implemented. The project aims to develop a coordinated ensemble of high-resolution Regional Climate projections in order to produce detailed climate data for all land regions of the world, at user-relevant scales and support climate change impact and adaptation research (Jones et al., 2012; 2013; Lennard and Kalognoumou, 2013). CORDEX involves 2 phases. In a first stage, Regional Climate Models (RCMs) are run for common continental regions for the recent past (1989-2008), forced by the European Centre for Medium-Range Weather Forecasts (ECMWF) Era-Interim reanalysis (Dee et al., 2011). In the second pahse regional climate simulations were performed, driven by many AOGCMs, participants of the Coupled Model Intercomparison Project, Phase 5 (CMIP5). The latter cover the period 1960-2100 providing projections for different greenhouse gas concentrations according to the Intergovernmental Panel on Climate Change Representative Concentration Pathways scenarios (IPCC RCP scenarios). The Representative Concentration Pathways are four greenhouse gas concentration scenarios (RCP2.6, RCP4.5, RCP6.0 and RCP8.5) adopted for the IPCC fifth assessment report (AR5) in 2014 (Moss et al., 2010). These scenarios describe four possible outcomes of how much will be the radiative forcing values in the year 2100, relative to pre-industrial values (Moss et al., 2010). Given that climate change in Africa has been overlooked, it was identified as the priority domain.
Model results from the Africa-CORDEX ensemble, forced by Era-Interim reanalysis, were assessed and validated in the recent past. For example, Nikulin et al. (2012) evaluates precipitation against CRU, GPCP and other observational based databases where all RCM analysed can reproduce the main details of precipitation over Africa. However, individual models display substantial biases depending on season and region. Overall, the multi-model mean ensemble outperforms individual models in most cases. Kim et al. (2014) validates precipitation, mean, maximum and minimum temperatures with a previous version of CRU database. All models analysed can simulate the precipitation climatology with mean biases inferior to 10%. Spatially, all models correlate well with CRU, but individual RCMs overestimates the spatial variability of precipitation. For temperatures, on general, models perform better for mean and maximum temperature than for minimum temperature. Buontempo et al., (2015) assess and validates ensembles from HadRM3P RCM over Africa for precipitation and temperature and advances that dynamical downscaling it is an asset for assessing recent past a future climate. Panitz et al. (2014) validates precipitation for COSMO-CLM model for 0.11º and 0.44 resolution, against numerous observationally based databases. Results shows the ability of CCLM to maintain the large-scale information from the driving model and results for mean annual and inter-annnual variability are better than the forcing simulation. However, results are not satisfactory enough to reproduce the complex African climate and further research is needed.
The African continent spans a myriad of climates, that range from very dry (e.g. Sahara or Kalahari deserts) to very wet climates such as the tropical rainforests of the Democratic Republic of Congo (Peel et al., 2007). It is one of the most vulnerable continent to climate extremes such as drought and heat waves, due to its exposure to high temperatures and low adaptive capacity (IPCC, 2014). Overall Africa despite having contributed little to climate change, it is likely to pay a heavy price in the future (IPCC, 2014; Russo et al., 2016). To improve the understanding of the climate change impact on the coupling between atmosphere-land, its link to heat waves and droughts, data from the Africa Coordinated Regional Downscaling Experiment (Africa-CORDEX, Giorgi et al., 2009) is used in the current thesis.
Firstly, all models used are assessed and validated against observationally based databases such as GPCC, CRU, GLEAM and FLUXNET. Secondly, coupling strength, heat waves and drought are evaluated for present climate and as anomalies between future (2071-2100) and present climate (1971-2000).
As mentioned, the main objective of this work is to assess the future changes in heat waves and droughts, and the relationship between soil moisture and temperatures anomalies in the context of Land-Atmosphere Coupling. Toward that end, two coupling metrics were considered, as well as the number and mean duration of heat wave events. To evaluate duration and intensity of drought events, SPEI index is computed for all periods. Additionally, to the state-of-the-art methods for coupling characterization, following the amplitude metric proposed by Russo et al. (2016), a new Latent Heat Flux-Temperature Coupling Magnitude is introduced and is applied to heat waves periods. This metric is based only on maximum temperature and upward latent heat flux to assess the relationship between these variables and is compared with the SPEI values. In the next chapter, an introduction to the data, methods and metrics is performed. In Chapter 3, all variables, for Hindcast and Historic simulation are evaluated and validated for the Africa-CORDEX domain. The analysis of land-atmosphere coupling, heat waves and droughts over Africa is done in Chapter 4 and for the future in Chapter 5. In Chapter 6 conclusions are drawn.
2. Data and Methods
2.1 Africa-CORDEX RCM Simulations
This study is based on data from Africa-CORDEX RCM simulations. The Africa-CORDEX focus domain is shown in Figure 2.1, covering an area comprised between 45.76º𝑆 to 42.24º𝑁 and between 24.64º𝑊 to 60.28º𝐸.
Fig 2.1. Africa-CORDEX domain1.
Four different simulations/periods from CORDEX portal were used: 1) RCMs forced by the Era-Interim reanalysis simulation from 1989 to 2008 (from now on: Hindcast); 2) RCMs forced by CMIP5 AOGCMs simulation from 1971 to 2000 (from now on: Historic); 3) the same RCMs forced by the same CMIP5 AOGCMS forced by two IPCC RCP scenarios (RCP 8.5 and RCP 4.5, or Future when referring to both scenarios), both with a time span from 2071 to 2100. All RCMs have a 0.44º resolution. The variables considered are: Surface Upward Latent Heat Flux (or HFLS, Wm−2); Surface Upward Sensible Heat Flux (or HFSS, Wm−2); Total (i.e. vertically integrated) Soil Moisture Content, or total amount of soil water in solid and liquid state present in a soil column (or MRSO, kgm−2); Precipitation, in both solid and liquid state (or PR), with units kgm−2s−1 or mm day−1 by multiplying by 86400 sec; Daily-Mean Near-Surface Air Temperature, at 2m (or TAS, K); Daily-Maximum Near-Surface Air Temperature, (or TASMAX, K); Daily-Minimum Near-Surface Air Temperature (or TASMIN, K); and
Downwelling Shortwave Radiation (RSDS, Wm−2).
Since the Historic and Future simulations are forced by free-running GCMs, the climates of each individual RCM are not synchronized. Thus, for building the ensemble, each common day of the year, between all models for each variable was averaged, with the same weight, in order to build a mean day year.
a. Hindcast Simulation
The output from 7 RCMs driven by Era-Interim reanalysis simulations are used as benchmark to the results obtained from the Historic. The models used are summarized in Table 2.1. Note that only data from 1990 onwards was used since it is the common time span to all models.
Table 2.1. Africa-CORDEX Hindcast RCMs.
AOGCM MODEL
ID
Institution RCM
MODEL ID Institution Calendar Period Acronyms
ECMWF-ERAINT European Centre for Medium-Range Weather Forecasts CLMcom-CCLM4-8-17 Climate Limited-area Modelling Community Proleptic Gregorian 1989 2008 CCLM4 ERAINT ECMWF-ERAINT European Centre for Medium-Range Weather Forecasts DMI-HIRHAM5 Danish Meteorological Institute Proleptic Gregorian 1989 2010 HIRHAM5 ERAINT ECMWF-ERAINT European Centre for Medium-Range Weather Forecasts KNMI-RACMO22T Royal Netherlands Meteorological Institute, De Bilt, The
Netherlands Standard 1979 2012 RACMO22T ERAINT ECMWF-ERAINT European Centre for Medium-Range Weather Forecasts MOHC- HadGEM3-RA
Met Office Hadley Centre Proleptic Gregorian 1990 2008 HADGEM3-RA ERAINT ECMWF-ERAINT European Centre for Medium-Range Weather Forecasts MOHC-HadRM3P
Met Office Hadley Centre Proleptic Gregorian 1990 2011 HADRM3P ERAINT ECMWF-ERAINT European Centre for Medium-Range Weather Forecasts SMHI-RCA4 Swedish Meteorological and Hydrological Institute, Rossby Centre Standard 1980 2010 RCA4 ERAINT ECMWF-ERAINT European Centre for Medium-Range Weather Forecasts MPI-CSC-REMO2009 Helmholtz-Zentrum Geesthacht, Climate Service Centre, Max Planck Institute for
Meteorology Proleptic Gregorian 1989 2008 REMOO2009 ERAINT
b. Historic and Future Simulations
The model characteristics for both the Historic and Future periods are summarized on Table 2.2. The output from 9 RCMs driven by CMIP5 ensemble models are analysed and validated. The Historic period is used to characterize the present climate over Africa while the RCP4.5 and RCP8.5 scenarios are used to evaluate the future changes.
Table 2.2. Africa-CORDEX Historic and Future RCMs.
AOGCM MODEL
ID
Institution RCM
MODEL ID Institution Calendar
Period Acronyms Historic Future CNRM-CM5 Centre National de Recherches Météorologiques/Centre Européen de Recherche et de Formation Avancées en Calcul Scientifique, France CLMcom- CCLM4-8-17 Climate Limited-area Modelling Community Proleptic Gregorian 1971 2000 2071 2100 CCLM4 CM5 CSIRO-Mk3-6-0 Commonwealth Scientific and Industrial
Research Organization in collaboration with the Queensland Climate
Change Centre of Excellence, Australia SMHI-RCA4 Swedish Meteorological and Hydrological Institute, Rossby Centre 365 days 1971 2000 2071 2100 RCA4 MK3-6-0 ICH EC-EARTH EC-EARTH consortium KNMI-RACMO22T Royal Netherlands Meteorological Institute, De Bilt, The Netherlands Standard 1971 2000 2071 2100 RACMO22T EC-EARTH ICH EC-EARTH EC-EARTH consortium DMI-HIRHAM5 Danish Meteorological Institute Proleptic Gregorian 1971 2000 2071 2100 HIRHAM5 EC-EARTH ICH EC-EARTH EC-EARTH consortium CLMcom- CCLM4-8-17 Climate Limited-area Modelling Community Proleptic Gregorian 1971 2000 2071 2100 CCLM4 EC-EARTH MOHC- HadGEM2-ES
Met Office Hadley Centre CLMcom- CCLM4-8-17 Climate Limited-area Modelling Community 360 day 1971 2000 2071 2099 CCLM4 HADGEM2 MOHC- HadGEM2-ES
Met Office Hadley Centre KNMI-RACMO22T Royal Netherlands Meteorological Institute, De Bilt, The Netherlands 360 day 1971 2000 2071 2099 RACMO22T HADGEM2 MPI-ESM-LR Helmholtz-Zentrum Geesthacht, Climate Service Centre, Max Planck Institute for
Meteorology CLMcom- CCLM4-8-17 Climate Limited-area Modelling Community Proleptic Gregorian 1971 2000 2071 2100 CCLM4 ESM-LR NCC- NorESM1-M Norwegian Climate Centre, Norway DMI-HIRHAM5 Danish Meteorological Institute Proleptic Gregorian 1971 2000 2071 2100 HIRHAM5 NORESM1-M