2019
UNIVERSIDADE DE LISBOA
FACULDADE DE CIÊNCIAS
DEPARTAMENTO DE ENGENHARIA GEOGRÁFICA, GEOFÍSICA E ENERGIA
The Madeira tip-jet and variability of extratropical water vapor
pumping in the Atlantic basin
Luís Henrique Cotrim Fróis
Mestrado em Ciências Geofísicas
Especialização em Meteorologia e Oceanografia
Dissertação orientada por:
Doutor Miguel Nogueira
Prof. Doutor Pedro Miranda
i
Acknowledgements
I would like to thank my thesis advisors, Doctor Miguel Nogueira and Professor Pedro Miranda, for their inestimable guidance throughout this past year, and the many thrilling hours that we spent huddled around a computer screen, attempting to work out what a map was trying to tell us. Enormous thanks to them also for their efforts to review this thesis, even though my delays in writing it meant that it had to be done in an obscenely short length of time.
I must thank my mother, stepfather, and father, for just being there and caring. My cat also deserves an acknowledgment, for reminding me constantly of what it looks like to live without a worry in the world.
Finally, thanks to Frederico and José for the occasional break from work spent discussing language-learning apps, reports of Indian eccentrics who have been holding an arm up continuously for decades, and other assorted topics.
This work was funded by the following project: Projeto Exploratório do Programa Investigador FCT 2015, Ref.ª IF/00817/2015.
ii
Resumo
O Aeroporto da Madeira é frequentemente afetado por eventos de vento intenso, que causam problemas nas operações de aeronaves. Esta situação levou ao estabelecimento de certos valores críticos de intensidade do vento médio e de rajadas, a partir dos quais o aeroporto encerra. A elevada frequência desses eventos deve-se em grande parte ao facto de o aeroporto se situar numa das extremidades da ilha da Madeira: nos extremos ocidental e oriental da ilha, ocorre a formação de jatos de baixa altitude, denominados tip jets. Um tip jet forma-se quando o escoamento encontra uma barreira de formato elíptico e ocorre aceleração em torno da extremidade da barreira. No caso da Madeira, o vento sopra predominantemente de nordeste, devido à localização da ilha em relação à circulação associada ao Anticiclone dos Açores, pelo que os jatos estendem-se para sudoeste a partir dos extremos da ilha.
As análises feitas em todo este trabalho restringem-se aos meses de junho a setembro (JJAS), uma vez que nessa época do ano as perturbações nas operações do aeroporto são particularmente relevantes, tendo em conta o tráfego aéreo associado ao turismo. Por outro lado, pretendia-se estudar a relação dos ventos locais com mecanismos de larga escala, e nos meses de verão há uma menor frequência de estruturas transientes, como depressões, que pudessem complicar esse estudo.
Recorreu-se ao modelo Weather Research and Forecasting (WRF) para representar o padrão típico do escoamento de superfície na região da Madeira, onde estão claramente presentes os dois
tip jets e a esteira que existe entre eles. Estabeleceu-se a relação entre esse padrão espacial e a
variabilidade da frequência de eventos de vento intenso observados em 13 estações meteorológicas distribuídas pela ilha da Madeira. Consideraram-se nesta fase do trabalho os dados para os meses JJAS dos anos 2009-2017, uma vez que este era o período máximo comum para o qual todas as estações tinham dados disponíveis. As estações situadas nos dois extremos da ilha registam frequências de ventos fortes mais elevadas, em todos os anos, do que as que se situam em zonas da ilha onde o efeito da formação dos tip jets não se sente.
Compararam-se os resultados obtidos com a simulação do WRF de resolução horizontal mais fina com os de outras de menor resolução e ainda com os da reanálise ERA5 (5th generation European Centre for Medium Range Weather Forecasting reanalysis), de resolução inferior à das
simulações do WRF. Deste modo, foi possível avaliar o valor acrescentado do uso de simulações de alta resolução na reprodução da variabilidade espacial do vento na Madeira. Concluiu-se que a simulação de alta resolução é aquela que melhor permite reproduzir a referida variabilidade entre as estações.
Pretendia-se ainda averiguar se o aumento que se verificara na frequência de condições de fecho do aeroporto, nos anos de 2016 e 2017, calculada a partir de dados das estações meteorológicas, correspondia à realidade. Nesses anos, a frequência de condições de vento intenso foi superior a todos os anos desde 2009. Na verdade, verificam-se as mesmas características da evolução temporal dessa frequência nos resultados obtidos com o modelo WRF, e em certas estações também na ERA5.
Usando dados da reanálise ERA5, calculou-se a intensidade do vento de larga escala numa secção zonal a norte da ilha da Madeira (isto é, a montante, em relação à direção do vento predominante). Mostrou-se que existe uma forte ligação entre o vento a montante e as condições de vento observadas no aeroporto, um resultado consistente com a ideia de que as segundas são em grande parte uma resposta ao primeiro, através do efeito do tip jet. Assim, é possível usar os dados de
iii
baixa resolução da ERA5 para obter uma variável que serve de proxy para estudar a variabilidade do vento local. O uso dessa variável proxy permite estender o estudo ao período para o qual existem dados da ERA5, isto é, todos os anos desde 1979. Isto constitui uma grande vantagem, uma vez que apenas existem observações para um período mais limitado, e executar simulações de alta resolução para longos períodos de tempo é computacionalmente dispendioso. O resto do trabalho focou-se por isso em dados da ERA5 para os meses JJAS no período 1979-2017. Verificou-se que a série temporal do vento a norte da Madeira não apresenta tendência estatisticamente significativa, pelo que o mesmo deve ser verdade em relação à frequência de condições de vento intenso no aeroporto que levem ao seu encerramento.
Exploraram-se, subsequentemente, mecanismos de larga escala que pudessem controlar a variabilidade do vento a norte da Madeira. Para fazer esse estudo à escala intra-sazonal, recorreu-se a um método que consistiu em comparar mapas condicionais: para certos campos horizontais da ERA5, calculou-se a média dos 10% dos dias do período em estudo com maior intensidade do vento a norte da Madeira, e a média dos 10% dos dias com menor intensidade do vento.
Mostrou-se que a variabilidade do vento a montante da Madeira — e, por isso, do vento no aeroporto —, tanto à escala interanual como intra-sazonal, se relaciona fortemente com a localização e a intensidade do Anticiclone dos Açores: o vento a montante é tanto mais forte quanto maior a intensidade do Anticiclone e quanto maior a sua extensão para leste. A influência da extensão para leste deve-se à intensificação, no ramo oriental do anticiclone, do gradiente zonal de pressão à superfície, o qual acelera o escoamento para sul.
Explorou-se uma ligação, a escalas intra-sazonais, entre o referido vento a montante e a Oscilação de Madden-Julian (MJO). Trata-se de um fenómeno que envolve a propagação para leste de células de convecção profunda tropical, com uma periodicidade da ordem das dezenas de dias. A conjetura de que essa ligação exista baseia-se, por um lado, na observação de diferenças nos padrões espaciais de convecção profunda nos trópicos, nos mapas condicionados pela intensidade do vento a norte da Madeira; por outro lado, existem, na série temporal do vento a norte da Madeira, oscilações com períodos associados à MJO. Usou-se ainda um índice da MJO, o qual tem associada uma fase que indica aproximadamente em que faixa de longitudes ao longo dos trópicos se encontra, em cada dia, a zona de convecção profunda. Verificou-se que a distribuição de frequência das fases é diferente quando se considera todo o período em estudo ou apenas os 10% dos dias com vento a norte da Madeira mais forte ou mais fraco.
Estudou-se ainda a ligação entre o vento a norte da Madeira e a variabilidade da humidade na alta troposfera (upper-tropospheric humidity, UTH). Um trabalho anterior mostrou que a UTH, tanto nas regiões tropicais como subtropicais, é controlada em parte pela fase da MJO. Os mapas condicionados mostram que os dias com vento mais intenso na Madeira correspondem, em média, a valores mais baixos da UTH numa certa região subtropical, resultado que está de acordo com a relação entre a fase da MJO e a UTH observada no referido estudo anterior. Por fim, sugere-se que os mesmos processos que controlam a variabilidade do vento a norte da Madeira podem influenciar também a quantidade de vapor de água exportada dos trópicos para a bacia do Atlântico Norte, através da circulação associada à célula de Hadley. Os mapas condicionados da componente meridional do transporte de vapor no Atlântico mostram que existem diferenças no padrão espacial das regiões onde esse fluxo ocorre para norte ou para sul.
Palavras-chave: Vento; tip jet; Anticiclone dos Açores; convecção tropical; Oscilação de
iv
Abstract
The Madeira Airport operations are often disrupted by strong wind events. This is largely due to the airport’s location on one of the edges of the island, where there is acceleration of the prevailing northerly flow, with jet streams (called tip jets) forming downstream of the edges. The present work focuses on the months of June to September, when airport disruptions due to strong winds are most frequent and have the greatest impacts for Madeira’s tourism-based economy.
The Weather Research and Forecasting (WRF) model was used to generate a limited-area simulation covering the Madeira Island region over the 2009-2017 period. The simulation was forced by the European Centre for Medium Range Weather Forecasting (ECMWF) fifth-generation reanalysis (ERA5) and, thus, a relatively good degree of synchronization with the “real atmosphere” was expected. Indeed, the simulation was shown to reproduce the summer wind variability observed in 13 weather stations distributed throughout the island. Additionally, the added value of high-resolution simulations was demonstrated for the Madeira wind simulation, by comparing between three WRF simulation domains with different spatial resolutions (9 km, 3 km, and 1 km) and, also, with the coarser-resolution (0.25º) ERA5 reanalysis. Furthermore, the relatively long WRF simulation allowed the characterization the typical pattern of the near-surface air flow in the Madeira region and relate it to the variability in frequency of strong wind events.
The results showed a strong link between the wind conditions observed at the airport and the strength of the large-scale, predominantly northerly wind upstream of the island computed from ERA5 data. In this sense, the coarse-resolution dataset may be used as a proxy for the variability of the local winds. Subsequently, the inter-annual and intra-seasonal variability of the upstream wind was shown to be tightly related to the location and strength of the Azores High. Additionally, a link between the intra-seasonal variability and the Madden-Julian Oscillation (MJO) was explored, based, on the one hand, on the emergence of distinct deep tropical convection spatial patterns in composite maps conditioned on the wind speed upstream of Madeira, and, on the other, on the existence of oscillations in the time series with periods typically associated with the MJO. Finally, it is suggested that the processes which control the variability of the upstream wind might have an influence on the spatial pattern of north-south vapour transport over the North Atlantic.
v
Contents
Acknowledgements ... i Resumo ... ii Abstract ... iv List of figures ... viList of tables ... vii
List of abbreviations ... vii
1. Introduction ... 1
2. Data and methods ... 3
2.1 Data ... 3
2.2 Methods ... 6
3. Results — variability of strong wind events in Madeira ... 8
3.1 Main features of spatial of wind conditions around Madeira ... 8
3.2 Large-scale upstream wind speed as a proxy for local response ... 10
4. Results — large-scale mechanisms ... 13
4.1 Position and strength of the Azores High ... 13
4.1.1 Inter-annual variability ... 13
4.1.2 Intra-seasonal variability ... 15
4.2 Intra-seasonal variability: the Madden-Julian Oscillation ... 18
4.3 Madeira wind as proxy for the variability of large-scale water vapor transport ... 21
5. Conclusions ... 26
vi
List of figures
Figure 2.1 — Boundaries of the three nested domains where the WRF model simulation was run. ... 4 Figure 2.2 — Colour plots of the terrain height field in an area encompassing the islands of Madeira and Porto Santo, for the WRF domains a) d03; b) d02; c) d01; and d) ERA5. Each coloured square is centred on a gridpoint. The outlines of the islands’ coastlines are shown in black. The locations of the 13 weather stations are also shown. ... 5 Figure 2.3 — Schematic showing how the eight phases of the MJO index are defined in the (RMM1, RMM2) plane. The approximate locations of the enhanced convective signal of the MJO for each location of the phase space are labelled. Adapted from Wheeler and Hendon (2004). ... 6 Figure 2.4 — JJAS time series of the number of days in each year for which the mean value of 𝑉𝑁 is above the 90th percentile (blue) or below the 10th percentile (orange) of the entire series. Values of trends (slope of regression line) and p-values for null hypothesis of no trend are shown. ... 7 Figure 3.1 — Mean JJAS 10-metre wind speed and 10-metre wind fields: a) for the highest-resolution WRF simulation (domain d03), with the entire 2009-2017 period; b) for the WRF d03 simulation, conditioned on the representative “airport closure condition”; c) as in a), for ERA5; d) as in b), for ERA5. ... 8 Figure 3.2 — Root mean square error of the parameterized, bias-corrected time series of the mean hourly wind (above) and peak hourly gust (below), relative to the corresponding observed time series at each station. Colours represent the 4 gridded datasets. Horizontal lines show the stations-mean RMSE for each dataset. ... 9 Figure 3.3 — Percentage of JJAS hours in each year in the 2009-2017 period for which the representative “airport closure condition” (hourly gust above 25 knots) was true, for all 13 stations. Colours represent the 5 datasets for which time series of the gust at the stations were computed. ... 10 Figure 3.4 — a) Frequency distribution of hourly 10-m wind speed and direction averaged along section 𝑆𝑁, for every year in the 2009-2017 period. b) Same as in a), but conditioned on the condition of hourly gust above 25 knots. The direction from which the wind blows is expressed as an angle measured clockwise from north. ... 11 Figure 3.5 — JJAS mean 𝑉𝑁. Least-squares regression lines are shown for the entire series and the 1979-2016 series, along with their slopes (trends of the series) and p-values for a null hypothesis of no trend. ... 12 Figure 4.1 — Features of the region defined by JJAS mean ERA5 MSL pressure above 1021.5 hPa. Each point represents one year in the 1979-2017 period. a) “Centre of mass” (pressure-weighted mean position); b) westernmost gridpoint; c) easternmost gridpoint. Colour scale shows JJAS mean wind speed upstream of Madeira; marker shapes correspond to values of the spatial maximum in the mean MSL pressure field (hPa). ... 14 Figure 4.2 — Composite maps of ERA5 𝑣-component of 10-m wind (colour), 10-m wind field (arrows) and MSL pressure (contours, with labels in hPa), for all JJAS days in the 1979-2017 period with 𝑉𝑁 above the 90th percentile or below 10th percentile of the entire series. ... 16
Figure 4.3 — Same as Figure 4.2, but for the ERA5 500-hPa vertical velocity instead of 𝑣10. 17 Figure 4.4 — Composite maps of ERA5 500-hPa vertical velocity anomaly, for the latitudinal strip 20ºS-20ºN, for all JJAS days in the 1979-2017 period with 𝑉𝑁 above the 90th percentile or
below 10th percentile of the entire series. Black contours denote 𝜔500 = 0 in the 1981-2010
climatological mean. ... 18 Figure 4.5 — Time series of daily mean 𝑉𝑁 for years 2011-2017 (left) and their discrete Fourier transform amplitude spectra (right). ... 19
vii
Figure 4.6 — Mean of the 39 discrete Fourier amplitude spectra for the years in the 1979-2017 period... 20 Figure 4.7 — Frequency distribution of the daily MJO phase for each of three subsets of the JJAS days in the 1979-2017 period: all days (green); the 10% days with the weakest 𝑉𝑁 (blue); the 10% days with the strongest 𝑉𝑁 (orange). ... 20 Figure 4.8 — Composite maps of ERA5 250-hPa relative humidity anomaly, for all JJAS days in the 1979-2017 period with 𝑉𝑁 above the 90th percentile or below 10th percentile of the entire
series. Anomalies were computed relative to 1981-2010 climatology (contours). ... 22 Figure 4.9 — Correlation index, 𝑟, between the JJAS 1979-2017 daily mean time series of 𝑉𝑁 and ERA5 250-hPa relative humidity, both series previously filtered with a 10-day moving average. Values of 𝑟 below 0.2 were masked. ... 23 Figure 4.10 — As in Figure 4.2, but with north-south component of the column-integrated water vapour flux shown in colour. ... 25
List of tables
Table 2.1 — Identification of the 13 weather stations. The first four listed are located at the Madeira Airport. Values of the height were not available for these. ... 3
List of abbreviations
ERA5 – fifth-generation European Centre for Medium Range Weather Forecasts reanalysis EOF – empirical orthogonal function
JJAS – June, July, August, September MJO – Madden-Julian Oscillation MSL – mean sea level
PC – principal component RH – relative humidity
RH250 – 250-hPa relative humidity RMM – Real-time Multivariate MJO Index RMSE – root mean square error
UTH – upper-tropospheric humidity
1
1. Introduction
Strong wind events are relatively common at the Madeira Airport, disrupting airport operations because landing and take-off are not permitted when certain thresholds of measured mean wind speed or wind gust are exceeded. At the time that this work started, observations from weather stations at the airport had shown an apparent increase in the frequency of occurrence of these events in the years 2016 and 2017, relative to the years since 2009. This raised the question of whether such an increase was real or a spurious artefact, since it occurred shortly after those weather stations had been replaced. If an increase in the frequency of strong wind events did occur, two other important questions emerge: is it associated with climate change, that is, does it represent an increasing trend in a warming climate? What are the key physical mechanisms controlling this change in frequency? Here, these three questions are tackled using observations from 13 weather stations covering Madeira Island, the fifth-generation European Centre for Medium Range Weather Forecasts reanalysis (ERA5) (C3S, 2017), and the Weather Research and Forecasting (WRF) model. In addition, we used data from WRF simulations and the reanalysis to assess the added value of using high-resolution simulations to reproduce the observed spatial variability, within Madeira Island, of the frequency of strong wind events. The present work focuses on the months of June through September (JJAS) for two main reasons: at that time of year the impact of the strong winds on airport operations is greater; and there are comparatively few transient structures such as depressions, which might complicate the study of the large-scale situation.
The strong wind events during JJAS at the Madeira Airport are linked to the Madeira Island tip jet effect, as will become clear in the results below. A tip jet is defined by Doyle and Shapiro (2009) as a low-level jet stream that forms downstream of the vertex of a large elliptical barrier, such as Madeira Island. Several previous studies have focused on the tip jet which forms downstream of Cape Farewell, on the southern tip of Greenland (e.g., Doyle and Shapiro, 2009; Våge et al., 2009). These studies have considered two non-mutually exclusive mechanisms as causing tip jets. One is acceleration implied by conservation of the Bernoulli function as the air undergoes orographic descent down the lee slope of the barrier, where the Bernoulli function is defined as the sum of enthalpy, kinetic energy, and gravitational potential energy (Doyle and Shapiro, 2009; Våge et al., 2009). The other mechanism consists of blocking by the barrier’s high topography, which causes deflection and acceleration around and downstream of the tip. The Madeira tip jet has received less attention. The results of Grubišić et al. (2015) showed the structure of the surface wind to the south of Madeira, where two jet streams can be seen extending southwards and westwards from the eastern and western edges of the island, although the focus of that study was on the island’s wake, which is formed between the two jets. Grubišić et al. (2015) also showed that the prevailing large-scale surface winds are from the northeast, owing to the island’s position in the eastern branch of the Azores High, so that tip jets are formed to the south of it. Given the role of the tip jet effect in causing the strong wind events forcing the airport to close, we then establish a link between the frequency of those events, in the summer months, and the wind speed averaged along a section upstream (north) of the island, computed with ERA5 data. Such a link means that the coarse-resolution upstream wind time series can be considered a good proxy for the local wind speed variability at the Madeira Airport. This fact allows us to focus on this proxy for conditions at the airport. In particular, by using ERA5 data, which are available for all years since 1979, we are able to use this proxy variable to answer the question of whether the observed strengthening of the wind is a manifestation of a long-term trend. The long-term proxy time series also allows us to investigate the large-scale mechanisms that control the upstream wind variability (and thus the variability of the wind at the Madeira Airport). In particular, we explore the importance of the position and strength of the Azores High and the strength of deep convection in the tropics. The latter factor is related to the strength of the Azores High via the Hadley cell, which involves deep ascent of air in the tropics and subsidence
2
in the subtropical ridge. The Azores High represents this descending branch of the cell, therefore the strength of the Hadley circulation (and hence of tropical deep convection) is related to the strength of the Azores High (Iqbal et al., 2019).
The possible link between the Madeira wind and tropical deep convection on intra-seasonal time scales then motivates the exploration of a possible connection with the Madden-Julian Oscillation. This is a feature of variability in the tropical troposphere which consists of the eastward propagation of cloud complexes associated with deep convection cells in the tropics (Madden and Julian, 1996). These cells are seen to move between the Indian Ocean and the central Pacific (Madden and Julian, 1996; Wheeler and Hendon, 2004), although some of the oscillation’s effects, such as anomalies in zonal winds and the upper-troposphere velocity potential, often move around the entire circumference of the globe (Madden and Julian, 1996). The period of this oscillation varies within a broad range: Wheeler and Hendon (2004) found this to be 30-80 days, while Madden and Julian (1996) report a range of 22-79 days, and conclude that the MJO most frequently occurs with a period of around 45 days. It should be noted that the MJO has, according to Wheeler and Hendon (2004), a zonal wavenumber between 1 and 3, that is, it is possible for there to be more than one region of strong convection propagating along the tropics at any given time.
We also explore a connection between the wind upstream of Madeira and the upper-tropospheric humidity (UTH), whose variability was found by Ryoo et al. (2008) to be influenced by the MJO. These authors used observations of water vapour from the Atmospheric Infrared Sounder (AIRS) aboard NASA’s Aqua satellite, during the winter. They found that, at the longitudes where the propagating area of enhanced tropical convection was found, there were generally positive values of the tropical UTH anomaly (represented by the 250-hPa relative humidity). At the same longitudes in the subtropics, there were generally negative UTH anomalies. The authors argue that this is because the subtropical anticyclones in the upper troposphere are located west of the longitudes of enhanced tropical convection, so that the flow at those longitudes is weak or equatorward and transport of water vapour from the tropics does not occur there. Finally, we further explore the connection between processes of water vapour transport to and from the tropics and the wind upstream of Madeira, by briefly analysing how the latter relates to the spatial pattern of north-south vapour transport over the North Atlantic.
The thesis is organized as follows. Section 2 describes the data used and methods employed. Section 3 shows the results obtained for the study of local wind conditions in the Madeira region, and section 4 the results relating to the connection with large-scale mechanisms. In section 5, the main conclusions are presented.
3
2. Data and methods
2.1 Data
Observations of near surface (10-meter) wind speed were obtained from 13 weather stations (Table 2.1; Figure 2.2a). These include 4 stations (identified as R23, R05, MID, ROS) belonging to the Portuguese airports management agency (ANA), located along the Madeira Airport landing track. The other 9 stations belong to the EMA (Estação Meteorológica Automática) network operated by the Portuguese Institute for Sea and Atmosphere (IPMA), with 8 of them distributed throughout Madeira Island, and 1 located in the Porto Santo Island, north of Madeira. The analysis using the station observations focused on the 2009-2017 period, corresponding to the largest common range for which there was data available from all 13 stations. Mean wind and wind gust observations were available at 10-minute intervals for all stations. These were subsequently converted into hourly mean and maximum wind speed, the latter being denoted the hourly peak gust.
Table 2.1 — Identification of the 13 weather stations. The first four listed are located at the Madeira Airport. Values of the height were not available for these.
Full name Abbreviation Location Height (m)
RW05 R05 32.69ºN, 16.78ºW - RW23 R23 32.71ºN, 16.77ºW - ROS ROS 32.67ºN, 16.81ºW - Mid MID 32.70ºN, 16.77ºW - Funchal_Obs FnO 32.65ºN, 16.89ºW 58 PtoSto_Aero PSt 33.08ºN, 16.35ºW 78 Funchal_Lido FnL 32.64ºN, 16.94ºW 25 Pta_SJorge PSJ 32.83ºN, 16.91ºW 257 Ch_Areeiro CdA 32.72ºN, 16.92ºW 1590 Lugar_Baixo LdB 32.68ºN, 17.09ºW 40 Pta_Pargo PdP 32.81ºN, 17.26ºW 298 Canical_PSLourenco PSL 32.75ºN, 16.71ºW 133 Lombo_Terca LdT 32.83ºN, 17.20ºW 931
The WRF simulation covered the 2009-2017 period. The simulation had three nested domains, identified in Figure 2.1 as d01, d02, d03, with horizontal resolutions of 9, 3 and 1 km, respectively. Initial and boundary conditions were obtained from the ERA5 reanalysis.
Data from ERA5 were used to represent large-scale conditions in later stages of the work. ERA5 has a temporal resolution of 1 hour, and a horizontal resolution of 0.25 degrees, starting from the year 1979 and extending to the present. Figure 2.2 presents the terrain height field in the Madeira and Porto Santo region for the 3 WRF domains and the ERA5 grid, each coloured square being centred on a gridpoint.
4
Figure 2.1 — Boundaries of the three nested domains where the WRF model simulation was run.
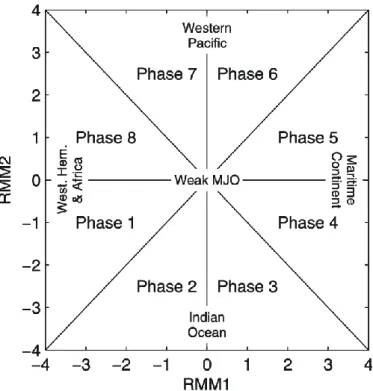
In order to explore the link between the wind in the Madeira region and the MJO, we used an index provided by the Australian Bureau of Meteorology (data available at http://www.bom.gov.au/climate/mjo/), which describes the state of the MJO for each day. The development of this index is described in Wheeler and Hendon (2004) (hereafter referred to as WH04). It consists of two daily series, known as Real-time Multivariate MJO series 1 and 2 (RMM1 and RMM2). They are obtained with principal component (PC) analysis: RMM1 and RMM2 are the PCs for the two leading empirical orthogonal functions (EOFs) of the combination of three near-equatorially averaged fields: 850-hPa zonal wind, 200-hPa zonal wind, and satellite-observed outgoing longwave radiation. The two leading EOFs each correspond to physical states in which the convection cells associated with the MJO are located at different longitudes along the equator.
Therefore, the state of the MJO on a particular day can be represented as a point in the plane defined by the two RMMs (Figure 2.3). Movement around the origin then corresponds to the zonal propagation of the pattern of tropical convection, which is almost always eastward (clockwise in Fig. 2.3), with periods of westward propagation lasting no more than several days (WH04). This plane was divided into eight regions as seen in Figure 2.3, each corresponding to a “phase” of the MJO, that is, roughly, to a region along the equator where there is enhanced convection. The distance from the origin represents the MJO amplitude, a measure of how strong the MJO pattern was on that day.
d03 d02 d01
5
Figure 2.2 — Colour plots of the terrain height field in an area encompassing the islands of Madeira and Porto Santo, for the WRF domains a) d03; b) d02; c) d01; and d) ERA5. Each coloured square is centred on a gridpoint. The outlines of the
islands’ coastlines are shown in black. The locations of the 13 weather stations are also shown.
a
b
c
6
Figure 2.3 — Schematic showing how the eight phases of the MJO index are defined in the (RMM1, RMM2) plane. The approximate locations of the enhanced convective signal of the MJO for each location of the phase space are labelled.
Adapted from Wheeler and Hendon (2004).
2.2 Methods
In the first part of the work, for each of the 4 gridded datasets (the 3 WRF domains plus ERA5), the nearest land gridpoint to every station was considered. (In the case of ERA5, only points with a value of the land-sea mask over 0.2 were considered. Given the relatively coarse resolution of ERA5, exactly three gridpoints met this condition, so that the ERA5 “nearest gridpoint” corresponding to each of the 13 stations was always one of these three.) For each of the 4 datasets, the hourly time series of the 10-metre 𝑢 and 𝑣 wind components for each of those “nearest gridpoints” was considered. An estimation of the hourly gust was obtained by multiplying the wind speed time series by a “gust factor” of 1.75, as recommended by the World Meteorological Organization (WMO) (Harper et al., 2008). Finally, the mean difference (bias) relative to the observed hourly gust time series was subtracted from each corresponding wind speed series and parameterized gust series.
The critical values of mean wind speed or gust above which landing or take-off at the Madeira Airport are not allowed depend on the wind’s direction and are different for landing and take-off; however, in this work, a representative simplified condition – hourly gust above 25 knots at the Airport stations – was considered as a proxy to the frequency of airport closure. This particular choice was based on the experience of the IPMA operations manager at the Madeira Island.
The ERA5 hourly time series of average 10-metre wind speed and direction, 𝑉𝑁 and 𝜃𝑁, taken along a
zonal section, 𝑆𝑁 (33.25ºN, 18ºW-16ºW), to the north of Madeira Island, was considered to represent
the large-scale wind conditions upstream of the island. This is based on the predominantly northerly synoptic wind conditions that characterize the Madeira Island during the summer, as will be shown in the results. The frequency distribution of 𝑉𝑁 and 𝜃𝑁 conditioned on the “closure condition” mentioned
above was compared with the non-conditioned distribution, so as to establish a connection between large-scale and local conditions.
7
The daily and JJAS means of 𝑉𝑁 are then used throughout the second part of the work, once we have
established that 𝑉𝑁 can be used as a proxy for the strength of the winds felt at the airport. In particular,
a number of analyses were carried out on certain daily horizontal fields and time series by comparing 2 subsets of them:
a) the average over the days, in the JJAS months, over the 1979-2017 period, when mean 𝑉𝑁 was above
the 90th percentile of the entire 𝑉𝑁 time series (𝑉𝑁,90 = 8.6 m/s);
b) similarly, for days with 𝑉𝑁 below the 10th percentile (𝑉𝑁,10= 3.2 m/s).
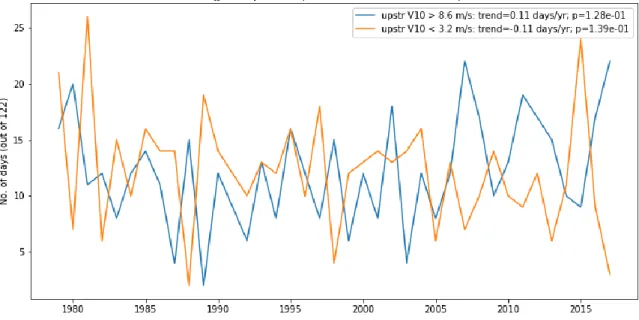
These two subsets of days are well distributed among the 39 years, and the number of days in each year with 𝑉𝑁 above or below those thresholds does not show a significant trend (Figure 2.4), therefore each
of those subsets of data should more or less evenly represent the entire period under study.
Figure 2.4 — JJAS time series of the number of days in each year for which the mean value of 𝑉𝑁 is above the 90th percentile (blue) or below the 10th percentile (orange) of the entire series. Values of trends (slope of regression line) and p-values for
8
3. Results — variability of strong wind events in Madeira
3.1 Main features of spatial of wind conditions around Madeira
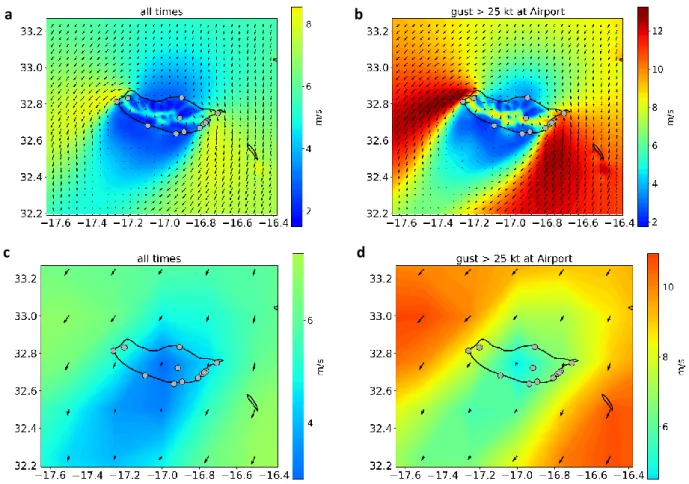
Figure 3.1 shows the mean 10-m wind and 10-m wind speed fields in the Madeira region, as represented by the 1-km resolution WRF simulation and by ERA5, for the months of JJAS, over the period 2009-2017. The mean of the same fields conditioned on the chosen condition of hourly gust above 25 knots (here, measured at the MID station) is also shown. The WRF results show wind blowing on the northern Madeira shore from the north/northeast. The flow appears to decelerate along the middle section of that shore, and two jet streams are seen to originate from either edge, extending themselves towards southwest (with stronger mean wind speeds in the conditioned case than in the overall mean). Between these jets, a wake is formed. Within the island, acceleration also appears to occur as the wind flows over the ridges located in the middle of the island (see Figure 2.2a), which is presumably due to compression of the flow over the ridges, and possibly also to kinetic energy gain as the air flows down the lee slope. The ERA5 wind field, due to its coarser resolution, is not able to capture the structure of the jet streams, although it does show a strip of weaker winds downstream of the island, corresponding to its wake.
Figure 3.1 — Mean JJAS 10-metre wind speed and 10-metre wind fields: a) for the highest-resolution WRF simulation (domain d03), with the entire 2009-2017 period; b) for the WRF d03 simulation, conditioned on the representative “airport
closure condition”; c) as in a), for ERA5; d) as in b), for ERA5.
Figure 3.2 shows the root mean square error (RMSE) of the bias-corrected 2009-2017 JJAS hourly time series of mean wind speed and peak gust for the 13 weather stations, for each of the 4 gridded datasets, relative to the corresponding observed time series. For most stations, as well as the 13-station average, the error increases among the 3 WRF domains as their resolution becomes lower. ERA5 has the highest stations-mean RMSE, even if, for some of the stations (such as FnO, FnL, PSt), the error is lower than for some or all of the WRF domains.
a b
9
Figure 3.2 — Root mean square error of the parameterized, bias-corrected time series of the mean hourly wind (above) and peak hourly gust (below), relative to the corresponding observed time series at each station. Colours represent the 4 gridded
datasets. Horizontal lines show the stations-mean RMSE for each dataset.
Figure 3.3 shows the yearly time series of the percentage of JJAS hours when the 25 knot gust threshold was exceeded, for all station locations, including data from observations, from the 3 WRF nested domains, and from ERA5. PSJ, FnO, FnL and LdB have consistently very low frequencies of strong gusts, never exceeding 5% of the hours in any year. This is because they are located in areas that are not affected by the tip-jets, nor any other type of persistent location wind acceleration mechanism (e.g. mountain breeze). All other stations are located either near one of the edges of the island from which the jet streams emanate, or, in the case of CdA, in the high-altitude middle region of the island where acceleration was seen to occur. The stations with the highest frequencies of the closure condition (across all datasets) are PSL and LdT, each being near the origin of one of jets. At PdP, however, the observed frequency is very low, since that station is sheltered from the western jet.
The temporal evolution of the strong-gust condition frequency from the observations is mostly well represented by the WRF simulation, with some exceptions. ERA5 performs generally worse: given that the Madeira Island is represented in the ERA5 grid by only three points, local spatial variability details are not captured. The increase in wind speed in the last two years is, in most cases, seen in the four airport stations, PSL, and LdT, both in the observations and, in most cases, in the WRF results. Even ERA5 displays some signal of the 2016-2017 enhancement in some of the stations located close to the island’s western and eastern tips, such as R23, MID, PSL and LdT. However, in the four airport stations, the correspondence between the values from higher-resolution WRF data and the ones obtained from observations is better from the year 2015 onwards than in the previous years, which suggests that the replacement of the weather stations may have had some effect on the observations. Specifically, the results suggest that the frequency of Airport closure conditions was perhaps being underestimated before the change.
ERA5 d03 d02 d01
10
Figure 3.3 — Percentage of JJAS hours in each year in the 2009-2017 period for which the representative “airport closure condition” (hourly gust above 25 knots) was true, for all 13 stations. Colours represent the 5 datasets for which time series
of the gust at the stations were computed.
The fact that WRF and, to a lower extent, ERA5 are able to reproduce the variability of the summer Airport closure frequency has important implications: first, and foremost, it allows us to establish that the increase in the frequency of strong wind events in the years 2016/17 given by observational data corresponded to a real increase in that frequency, rather than being an artefact of the replacement of the Airport weather stations. Second, it establishes the added value of the high-resolution WRF simulations, namely at 3-km and 1-km resolutions compared to the 9-km domain and to the 0.25º ERA5, in reproducing spatial variability over a small region.
3.2 Large-scale upstream wind speed as a proxy for local response
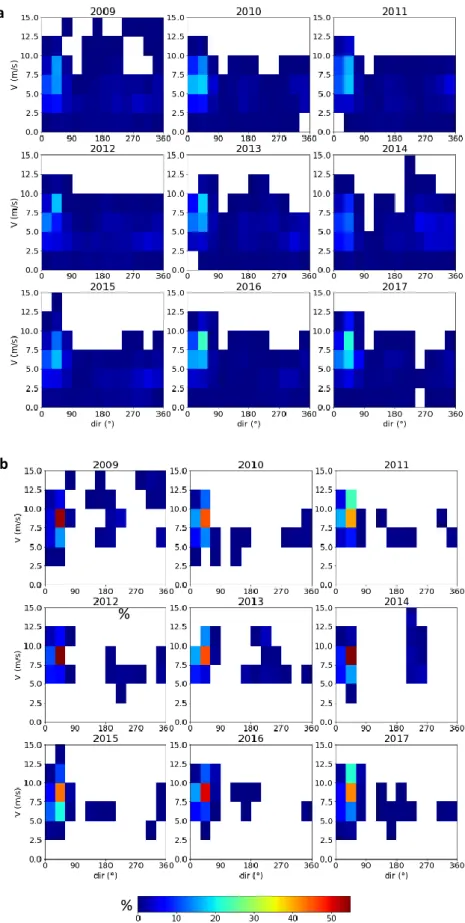
Figure 3.4 shows frequency distribution plots of the speed and direction of the ERA5 10-m wind, averaged along section 𝑆𝑁, for the JJAS months of every year in the 2009-2017 period. The same plots
are shown for the hours when the condition of “strong gust” at the airport was verified (as measured by the observed gust at MID exceeding 25 knots). The non-conditioned distributions show that, as expected, the wind north of Madeira blows most frequently from the north/northeast (direction 30º-60º, less frequently 0º-30º, measured clockwise from north). The most frequent wind speed values are between 5-7.5 or 7.5-10 m/s, depending on the year. When the “airport closure” condition is applied, the new distribution, while still having one peak, in the same region of the speed-direction plane as the all-times distribution, is much less spread out than the latter. The wind speed bins where the peak frequency is found have also been shifted somewhat, with the 10-12.5 m/s now being the second most frequent in some years, for directions 30º-60º. This result suggests a link between the occurrence of strong gusts at the airport and the mean wind conditions upstream of Madeira. This link may be explained by the fact that strong winds at Madeira Airport are associated with the formation of a tip jet along the eastern edge of the island. In turn, the tip jet is caused by the north-easterly wind blowing on the island’s northern shore (Grubišić et al, 2009). Indeed, the values of the observed MID gust themselves correlate moderately well with 𝑉𝑁 for the year range 2009-2017 (months of JJAS), and the correlation improves
if daily mean time series are used instead (Pearson’s correlation index, respectively: 𝑟 = 0.57; 𝑟 = 0.74).
11
Figure 3.4 — a) Frequency distribution of hourly 10-m wind speed and direction averaged along section 𝑆𝑁, for every year in the 2009-2017 period. b) Same as in a), but conditioned on the condition of hourly gust above 25 knots. The direction from
which the wind blows is expressed as an angle measured clockwise from north.
a
b
%
12
The yearly time series of the JJAS mean 𝑉𝑁 for all the years available from ERA5 up to 2017 is shown
in Figure 3.5. It shows a positive trend, computed as the slope of the line of least-squares best fit, with a p-value of 𝑝 = 0.08 for the null hypothesis of no trend. The trend could therefore be considered statistically significant for a significance level of 10%. However, the last two years (2016-2017) had the highest mean values of 𝑉𝑁 of the entire 39-year series (which is consistent with the increase in strong
gust frequency in those years observed in Figure 3.3). This may lead to a spurious trend being found. Indeed, computing the trend for the 1979-2016 or 1979-2015 series yields respectively 𝑝 = 0.24 and 𝑝 = 0.51. Therefore, this analysis does not allow us to relate the exceptionally high values of mean JJAS wind speed upstream of Madeira in the years of 2016-17 to a long-term trend. The same should apply to the strength of the gusts felt at the Madeira Airport, given the link between them that we have established.
Figure 3.5 — JJAS mean 𝑉𝑁. Least-squares regression lines are shown for the entire series and the 1979-2016 series, along with their slopes (trends of the series) and p-values for a null hypothesis of no trend.
13
4. Results — large-scale mechanisms
4.1 Position and strength of the Azores High
4.1.1 Inter-annual variabilityThroughout Section 4, the ERA5 mean wind in section 𝑆𝑁 is considered as a proxy for the JJAS airport
closure frequency (as determined by the “gust > 25 knots” threshold), based on the link between these two time series shown in the previous section. The main advantage of using mean upstream wind from ERA5 instead of the local gust value at the airport stations is that ERA5 extends over the 1979-2017 period, while both observations and high-resolution WRF simulations were only available over the 2009-2017 period (note that WRF simulations were limited by computational costs). Hence, the mechanisms governing the inter-annual variability of the airport closing frequency were investigated based on this long-term proxy time series.
First, the role of the intensity and location of the Azores High in the Madeira Airport closure was investigated. For every year in the 1979-2017 period, the average of the mean-sea-level (MSL) pressure field over the JJAS months was taken. The region of that field contained within the 1021.5-hPa isobar over the North Atlantic was used to roughly study the “position” of the Azores High. (This was the lowest maximum 0.5-hPa isobar in that pressure field across all years.)
Figure 4.1 shows that region’s centre of mass (4.1a) (that is, the mean of the positions, weighed by the MSL pressure), westernmost ERA5 gridpoint (4.1b) and easternmost gridpoint (4.1c), each point being coloured according to the mean 𝑉𝑁 for that year and shaped according to the maximum MSL pressure
reached within that region of the average MSL pressure field (a measure of the mean strength of the anticyclone during that summer). Visually, the strength of the wind upstream of Madeira does not appear to be related to the “centre” of the anticyclone or to its western “edge”. The plot of the eastern edge, however, suggests that in years of higher average 𝑉𝑁 the anticyclone was extended further to the east.
Indeed, there is a correlation of 𝑟 = 0.61 between JJAS mean 𝑉𝑁 and the longitude coordinate of the
points plotted in Figure 4.1c. The analogous correlations for the other two sets of points, meanwhile, are less than 0.2 in magnitude. There is also some correlation (𝑟 = 0.51) between 𝑉𝑁 and the maximum
MSL pressure in the JJAS mean field, as suggested by the scatter plots.
The inter-annual variability of the speed of the wind blowing on Madeira’s northern shore, then, is controlled to some extent by the strength of the Azores High, as would be expected, since the prevailing northerly wind is part of the circulation associated with that pressure centre. The relationship with the eastward extension of the anticyclone is less evident but also expected. The wind upstream of Madeira should be stronger when the MSL pressure zonal gradient is stronger, assuming the gradient or geostrophic wind approximations. This gradient should intensify when the anticyclone moves towards the eastern border of the Atlantic basin (in this case, the western Iberian coast), since its structure does not propagate into the continent and, therefore, the isobars at the surface should be brought closer together against the coast. In fact, 𝑉𝑁 is found to have a correlation of 𝑟 = 0.76 with the JJAS mean
14
Figure 4.1 — Features of the region defined by JJAS mean ERA5 MSL pressure above 1021.5 hPa. Each point represents one year in the 1979-2017 period. a) “Centre of mass” (pressure-weighted mean position); b) westernmost gridpoint; c) easternmost gridpoint. Colour scale shows JJAS mean wind speed upstream of Madeira; marker shapes correspond to values
of the spatial maximum in the mean MSL pressure field (hPa).
a
b
15 4.1.2 Intra-seasonal variability
In order to see which aspects of the spatial structures of certain horizontal fields differ depending on the strength of the wind upstream of Madeira, we averaged those fields (taken from ERA5) over the 10% of the 39*122 JJAS days in the 1979-2017 period with highest mean 𝑉𝑁 and, for contrast, the 10% with
lowest 𝑉𝑁.
Figure 4.2 shows the result of this analysis for the north-south component of the 10-m wind and the MSL pressure field, with the 10-m wind field for each subset of days also plotted. The differences in its features between the two situations are in accordance with the conjectures made earlier from the observation of Figure 4.1, when trying to account for the inter-annual variability of 𝑉𝑁. These composite
maps show that the same factors that have been discussed — the strength of the Azores High and its extension to the northeast as it encounters the Iberian coast — also have an influence on the intra-seasonal variability of the wind north of Madeira. In fact, in the mean weak-𝑉𝑁 situation, the
Madeira region finds itself in a weak-wind area to the north of the region of strong flow around the pressure centre.
Figure 4.3 shows the same analysis for the 500-hPa vertical velocity (𝜔500) in pressure coordinates
(negative values indicate upward motion, positive downward). Stronger subsidence associated with the Azores High is found in the strong-𝑉𝑁 map, as would be expected. A strip of upward motion above the
Gulf Stream region also stretches out further into the Atlantic in that case. There is also a slight change in the shape of the region of strong convection in the Atlantic Intertropical Convergence Zone. Physically, it would make sense that there should be a connection with the amount of tropical convection, since the latter is related, via the Hadley cell, to the strength (and possibly the position) of the subtropical high-pressure centres such as the Azores High.
16
Figure 4.2 — Composite maps of ERA5 𝑣-component of 10-m wind (colour), 10-m wind field (arrows) and MSL pressure
(contours, with labels in hPa), for all JJAS days in the 1979-2017 period with 𝑉𝑁 above the 90th percentile or below 10th percentile of the entire series.
17
18
4.2 Intra-seasonal variability: the Madden-Julian Oscillation
The difference in shape of the tropical region of strong convection in Figure 4.3 becomes more apparent if one looks at the composite anomaly maps for 𝜔500 (Figure 4.4). This anomaly is simply the difference
between the values plotted in Figure 4.3 and the 𝜔500 “climatology”, computed as the mean over the
30-year period 1981-2010. Figure 4.4 shows that there are differences in the location of the near-equatorial areas of strong mid-atmosphere ascent (which should roughly coincide with areas of strong convection) in all three ocean basins. This apparent link with the longitudinal patterns of tropical convection can lead to the conjecture that the intra-seasonal variability of 𝑉𝑁 may be influenced by the
Madden-Julian Oscillation.
Figure 4.4 — Composite maps of ERA5 500-hPa vertical velocity anomaly, for the latitudinal strip 20ºS-20ºN, for all JJAS days in the 1979-2017 period with 𝑉𝑁 above the 90th percentile or below 10th percentile of the entire series. Black contours
denote 𝜔500= 0 in the 1981-2010 climatological mean.
If this were the case, one would expect to find oscillations of 𝑉𝑁 with periods in the characteristic range
of the MJO. This is quite a broad range: WH04 give it as 30-80 days, and Madden and Julian (1994) mention that signals with periods shorter than 30 days have been found. The latter authors emphasize, however, that the MJO time scale is distinct from the synoptic time scale (that is, longer than 10 days). Figure 4.5 shows the daily time series of 𝑉𝑁 for some of the years in the period under study, along with
their Fourier amplitude spectra. Since each series has a length of 122 days, the period for the second harmonic in this analysis is 61 days, which belongs to the typical MJO range. Therefore, the signature of the conjectured MJO influence would consist in peak periods anywhere above ~15 days. These are indeed found, even if often not as a single peak. The mean of all 39 amplitude spectra is shown in Figure 4.6 and indicates that oscillations with time scales above synoptic ones do occur during the summer in the wind upstream of Madeira.
Figure 4.7 shows the frequency distribution of the daily MJO phase computed from the RMM indices provided by the Australian Bureau of Meteorology, for the two subsets of days that we have been using for conditional analysis, as well as the non-conditioned frequency distribution. It can be seen that phases 1, 2 and 8 occur more frequently in the top 10% strongest-𝑉𝑁 days than in either all days or the bottom
10%, whereas phases 3, 4, 5 and 6 occur less frequently in those days than in the other two sets of days. No correlation was found, however, between 𝑉𝑁 and the amplitude of the MJO index (that is, the distance
19
Figure 4.5 — Time series of daily mean 𝑉𝑁 for years 2011-2017 (left) and their discrete Fourier transform amplitude spectra (right).
20
Figure 4.6 — Mean of the 39 discrete Fourier amplitude spectra for the years in the 1979-2017 period.
Figure 4.7 — Frequency distribution of the daily MJO phase for each of three subsets of the JJAS days in the 1979-2017 period: all days (green); the 10% days with the weakest 𝑉𝑁 (blue); the 10% days with the strongest 𝑉𝑁 (orange).
21
The positions of the areas of negative 𝜔500 anomalies seen in Figure 4.4 should then have some
correspondence with the patterns associated with the MJO phases whose frequency is greater in each of the two situations. Since the effect of the MJO is mostly seen in a longitudinal range extending from eastern Africa to the central Pacific, it is not possible to relate it directly to the change seen in the Atlantic. All that can be discussed about that matter is that it is reasonable that the highest-𝑉𝑁 days
should have stronger negative 𝜔500 anomalies, given the aforementioned Hadley cell argument.
WH04 present, in their Figure 9, maps of the mean patterns of equatorial convection, for the months of May-June (in their case, using anomalies of satellite-measured outgoing longwave radiation as a proxy for convection strength), for each of the eight phases they have defined. In the strongest-𝑉𝑁 map, the
area of enhanced convection to the southwest of India is found in WH04’s phase 1 map, and the one on the eastern Pacific border and over Central America is similar to their phases 8 and 1. The same is not true of the region over the Maritime Continent. In the weakest-𝑉𝑁 map, the main strong-convection
regions found in our 𝜔500 map are generally found in WH04’s maps for phases 5, 6 and 7: in the South
China Sea, near the Philippines, and in the eastern Pacific, further away from America than in the strongest-𝑉𝑁 case.
4.3 Madeira wind as proxy for the variability of large-scale water vapor transport
Another field where a signal may be expected to be found if the connection with the MJO is true is the 250-hPa relative humidity (RH250), according to Ryoo et al. (2008), where it was observed (albeit for winter data) that the propagating regions of enhanced tropical deep convection generally corresponded to negative upper-tropospheric humidity anomalies in the subtropics, at the same longitudes, so that the signs of tropical RH250 anomalies were longitudinally out of phase with the subtropical ones. Figure 4.8 shows the 𝑉𝑁-conditioned composite maps of ERA5 RH250 anomalies with respect to the 1981-2010
climatology, which is plotted in contours. A region of negative anomalies of up to 8% is indeed found between 30ºN and 40ºN in the strong-𝑉𝑁 map, above the western border of the Atlantic basin: the same
longitudes where strong convection happens in the tropics, seen in these maps as the “tongue” of high climatological RH250 values extending itself westwards from the tropical African coast. In the weak-𝑉𝑁
case, positive anomalies of up to 7% are found in that subtropical region. This means that the strength of the wind upstream of Madeira can account for differences in RH250 in this region of up to 15%.
22
Figure 4.8 — Composite maps of ERA5 250-hPa relative humidity anomaly, for all JJAS days in the 1979-2017 period with
𝑉𝑁 above the 90th percentile or below 10th percentile of the entire series. Anomalies were computed relative to 1981-2010 climatology (contours).
23
Other regions of strong anomalies are found, with their signs swapping from one composite map to the other. Regions of anomalies with the opposite sign to those in the region discussed above are found contiguous to it, to the west and the north. The first is consistent with the observation by Ryoo et al. (2008) concerning the out-of-phase relationship between the zonal location of areas of positive and negative UTH anomalies in the subtropics and the tropics. The second agrees with the observation made in the 𝜔500 maps (Figure 4.3) that a strip of deep convection above the Gulf Stream region stretches
further east into the Atlantic in the strong-𝑉𝑁 case. To the north of this, there is a very wide region, in
the shape of a curve, with strong anomalies of the same sign and similar maximum magnitude as the ones in the first region. It is not evident how to account for this; it shows, however, that the variability of the wind upstream of Madeira is to some extent related to the RH250 as far north as 60-70ºN. The correlation map between the daily time series of 𝑉𝑁 and RH250 is shown in Figure 4.9. The series
have been filtered in order to remove high-frequency oscillations: a moving average of 10 days was applied to the 122-day series from each year, and the 39 resulting 113-day series for each of the two variables were stringed together in order to find the correlation index. In the subtropical region where the strong signal was observed in the composite maps, RH250 and 𝑉𝑁 have negative correlations, in
accordance with what was previously observed, with magnitudes of 0.4-0.5. Weaker negative correlations are found over and around the Mediterranean. Very low positive correlations are seen to the north of the first region, at 50ºN. As for the wide curve-shaped region where it had been seen that strong 𝑉𝑁 seemed to be associated with drier air in the upper troposphere, the two variables do not have a linear
correlation except over Great Britain, with |𝑟| no greater than 0.3.
Figure 4.9 — Correlation index, 𝑟, between the JJAS 1979-2017 daily mean time series of 𝑉𝑁 and ERA5 250-hPa relative humidity, both series previously filtered with a 10-day moving average. Values of 𝑟 below 0.2 were masked.
24
Finally, we suggest the possibility that, given the connection between the wind upstream of Madeira, tropical convection and the amount of humidity found in the subtropics, that the amount of water vapour exported from the tropics across the Atlantic basin via the Hadley cell may have a variability which is somewhat coherent with the wind speed upstream of Madeira. The latter might then be used as a proxy to study that variability. In Figure 4.10 we show the composite strong-𝑉𝑁, weak-𝑉𝑁 maps of the
north-south component of the column-integrated water vapour flux. The spatial structure over the North Atlantic for each situation is quite similar to what was seen in the maps of the 𝑣-component of the surface wind, which is not surprising considering that the specific humidity decreases quickly with height, so the near-surface circulation is very relevant to the variability of the vertically-integrated flux. This structure consists of two NW-SE oriented strips where the meridional flux is consistently northward or southward, mostly coincident with the regions where the circulation associated with the Azores High (as seen at the surface) has a meridional component of the same sign. Therefore, in the weak-𝑉𝑁 case
these regions are shifted to the west, accompanying the anticyclone’s structure, with weaker fluxes since the whole circulation is weaker in that case.
25
26
5. Conclusions
The WRF simulation was found to perform well at reproducing the spatial variability of the summer wind conditions around the island of Madeira, including their temporal evolution at different weather stations, while the ERA5 reanalysis shows a poorer performance in such small-scale studies. The error in reproducing the mean wind and gust at individual stations was found to be consistently smaller for higher resolutions. The observed enhancement in the frequency of strong wind conditions in the years 2016-2017 is also reproduced by WRF and, to some extent, by ERA5. Therefore, that observation can now be said with confidence to reflect a real increase in strong wind frequency.
The simulated spatial structure of the surface wind shows that the variability, among stations, in the frequency of occurrence of strong gusts is largely explained by the formation of two southward- and westward-spreading jet streams originating from the western and eastern edges of the island, which are formed, via the tip-jet effect, due the prevailing northerly winds which impinge on it. The locations in the island near either of the edges therefore have a higher frequency of strong wind events, as is the case with the Madeira Airport.
A strong link was found between the surface wind speed averaged over a zonal section upstream of the island, representing the strength of the prevailing northerly wind, and the observed frequency of events forcing the Airport’s closure. Indeed, the latter can be thought of as a local response, via the tip-jet effect, to those large-scale conditions. It is therefore reasonable to use them as a proxy to study the variability of the wind felt at the Airport. In particular, the fact that the average upstream wind shows no significant trend suggests that the same should be true of the frequency of airport closure conditions. The increase in that frequency which is seen in both local observations and the WRF simulation in the last two years of measurements may therefore be said to be a manifestation of natural variability of the large-scale wind.
The variability of the summer upstream wind, on both inter-annual and intra-seasonal time scales, is controlled to a great extent, as expected, by the strength of the Azores High and by its position, particularly by its extension towards the eastern edge of the Atlantic basin, which increases the zonal pressure gradient that causes southward acceleration of the flow. There is also some connection, on an intra-seasonal time scale, with the amount of deep convection in the tropical Atlantic, which is related to the strength of the anticyclone via the Hadley cell (Iqbal et al., 2019).
The Madden-Julian Oscillation appears to have some influence on the summer upstream wind’s intra-seasonal variability: oscillations with periods in the range associated with the MJO are found in the daily time series, and the regions of minimum values in composite mean fields of the mid-atmosphere vertical velocity anomaly (that is, regions of enhanced deep convection) differ in their locations according to the strength of the upstream wind.
Signals are found in the composite upper-tropospheric humidity anomaly fields which are consistent with the study by Ryoo et al. (2008) of the relationship between the MJO and UTH variability. The spatial pattern of the regions of northward and southward water vapour transport in the Atlantic is also related to the wind upstream of Madeira. These connections with the water vapour circulation should not have much value in helping to predict the wind conditions at Madeira Airport, but they do suggest that these variables are partly controlled by the same processes which influence the intra-seasonal variability of the wind in the Madeira region. Therefore, monitoring the latter might be useful for studying the transport of vapour over the North Atlantic basin.
27
References
Copernicus Climate Change Service (C3S), 2017: ERA5: Fifth generation of ECMWF atmospheric reanalyses of the global climate. Copernicus Climate Change Service Climate Data Store (CDS), accessed 2019.
Doyle J. D., Shapiro M. A., 1999: Flow response to large-scale topography: the Greenland tip jet. Tellus
A, 51, 728–748.
Grubišić, V., Sachsperger, J., Caldeira, R.M., 2015: Atmospheric Wake of Madeira: First Aerial Observations and Numerical Simulations. Journal of the Atmospheric Sciences, 72, 4755–4776. Harper, B.A., Kepert, J.D., Ginger, J., 2008. World Meteorological Organization Guidelines For
Converting Between Various Wind Averaging Periods In Tropical Cyclone Conditions August 2008.
Iqbal, M. J., Rehman, S. U., Hameed, S., & Qureshi, M. A., 2019. Changes in Hadley circulation: the Azores high and winter precipitation over tropical northeast Africa. Theoretical and Applied
Climatology, 137(3–4), 2941–2948.
Madden, R.A., Julian, P.R., 1994: Observations of the 40-50 Day Tropical Oscillation. Monthly Weather
Review, 122, 814–837.
Ryoo J.M., Waugh D.W., Gettelman, A., 2008: Variability of subtropical upper tropospheric humidity.
Atmospheric Chemistry and Physics, 8, 2643–2655.
Våge, K., Spengler, T., Davies, H.C., Pickart, R.S., 2009. Multi-event analysis of the westerly Greenland tip jet based upon 45 winters in ERA-40. Q. J. R. Meteorol. Soc., 135, 1999–2011.
Wheeler, M.C., Hendon, H.H., 2004: An All-Season Real-Time Multivariate MJO Index: Development of an Index for Monitoring and Prediction. Monthly Weather Review, 132, 1917-1932.