LONGITUDINAL MODELING OF YOUNG SWIMMERS’
PERFORMANCE AND BIOMECHANICS:
IDENTIFICATION, DEVELOPMENT AND FOLLOW-UP
DOUTORAMENTO EM CIÊNCIAS DO DESPORTO
JORGE FILIPE ESTRELA MORAIS
ORIENTADORES: TIAGO MANUEL CABRAL DOS SANTOS BARBOSA
ANTÓNIO JOSÉ ROCHA MARTINS DA SILVA DANIEL ALMEIDA MARINHO
JORGE MORAIS iii
This academic thesis was submitted with the aim of obtaining a doctoral degree in Sport Sciences according to the provision of the Portuguese Decree-Law 107/2008, June 25th.
JORGE MORAIS v Funding
The Portuguese Science and Technology Foundation (FCT) funded this thesis, under the Human Potential Operating Program, supported by the European Social Found (ESF), grant SFRH/BD/76287/2011.
JORGE MORAIS vii
To my parents… Dedicated to my beloved mother…
JORGE MORAIS ix
Table of Contents
Acknowledgments ... xi
List of publications ... xiii
Figures Index ... xv
Tables Index ... xvii
List of Abbreviations ... xix
Abstract ... xxi Resumo ... xxiii General Introduction ... 1 Chapter 1 ... 3 Chapter 2 ... 29 Chapter 3 ... 51 Chapter 4 ... 75
General Discussion and Conclusions ... 97
JORGE MORAIS xi
Acknowledgments
The development of this research, culminated in this doctoral thesis would not be possible without the contribution of so many people, therefore my sincere appreciation and gratitude.
First, to my supervisor Tiago Manuel Cabral dos Santos Barbosa (PhD) for all the guidance, support and motivation since the beginning of my academic journey, and most of all for his friendship.
To my co-supervisors, António José Rocha Martins da Silva (PhD) and Daniel Almeida Marinho (PhD) for their disposal in the manuscript preparation and setting the logistics for the data collection.
To those who participated in the data collection and/or in the manuscript preparation: Eduardo Pires, Henrique Neiva (PhD), Marc Moreira, Mário Costa (PhD), Mário Marques (PhD), Nuno Garrido (PhD), Pedro Forte, Sérgio Jesus, Tiago Poço, Vasco Lopes, Vítor Lopes (PhD).
To all athletes, coaches and researchers involved in this research project, showing full cooperation and disposal.
JORGE MORAIS xiii
List of publications
The following parts of this thesis are published:
Morais JE, Jesus S, Lopes V, Garrido ND, Silva AJ, Marinho DA, Barbosa TM. (2012). Linking selected kinematical, anthropometric and hydrodynamic variables to young swimmer performance. Pediatr Exerc Sci. 24: 649-664.
Morais JE, Marques MC, Marinho DA, Silva AJ, Barbosa TM. Longitudinal modeling in sports: young swimmers’ performance and biomechanics profile. (2014). Hum Mov Sci. 37: 111-122.
Morais JE, Silva AJ, Marinho DA, Seifert L, Barbosa TM. (2015). Cluster stability as a new method to assess changes in performance and its determinant factors over a season in young swimmers. Int J Sports Physiol Perf. 10: 261-268.
The following part of the present thesis is submitted and under review:
Morais JE, Silva AJ, Marinho DA, Lopes VP, Barbosa TM. (Submitted). Determinant factors of long-term performance development in young swimmers. Int J Sports Physiol Perf.
JORGE MORAIS xv
Figures Index
Chapter 1 Figure 1. Theoretical path-flow model. 10 Chapter 1 Figure 2. Overall confirmatory path-flow model including 18
all variables computed (2A) and deleting variable that allowed to reduce the residual error and improve the goodness-of-fit (2B) with the subsequent recomputation of remain data.
Chapter 2 Figure 1. Training volume per week (in km) throughout 36 the season. # – evaluation moments (Mi).
Chapter 2 Figure 2. Study design scheme. 36
M – moment; Wk – week; # – week’s number.
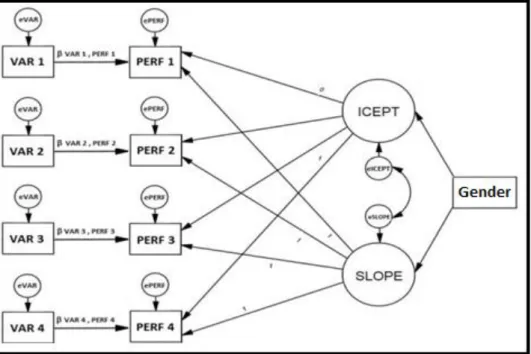
Chapter 2 Figure 3. Theoretical model. 37
Chapter 2 Figure 4. Growth confirmatory models for performance 43 and effects of the selected variables.
Chapter 3 Figure 1. Territorial map of the two canonical discriminant 64 functions in moment 1 (M1-A), moment 2 (M2-B) and
moment 3 (M3-C), respectively.
Chapter 4 Figure 1. Training volume per week (in km) in each 81 season, and the performance variation.
Chapter 4 Figure 2. The timeline for the data collection over the 82 three seasons (10 evaluation moments).
JORGE MORAIS xvii
Tables Index
Chapter 1 Table 1. Overall, boys and girls descriptive statistics of 16 anthropometric, kinematic, hydrodynamic and
swimming performance variables.
Chapter 1 Table 2. Overall, boys and girls Person´s correlation 17 coefficients between swimming performance and
remain variables selected.
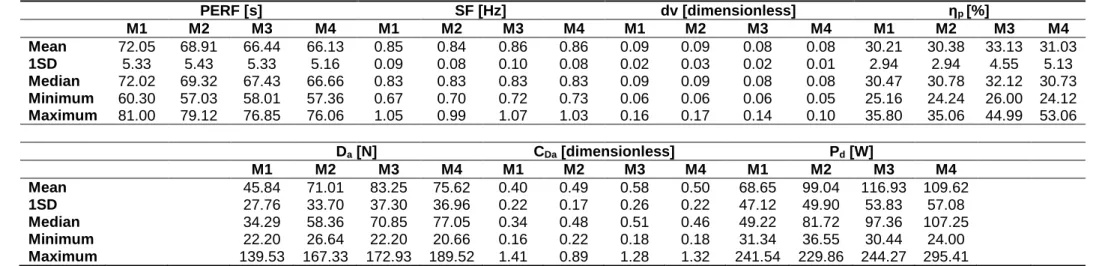
Chapter 2 Table 1. Descriptive statistics for selected kinematic and 41 hydrodynamic variables in each evaluation moment.
Chapter 3 Table 1. Performance and its determining factors for 63 swimmers classified in each cluster assessed at
baseline (moment 1), mid-season (moment 2), and end-season (moment 3).
Chapter 3 Table 2. Number of swimmers re-classified in each 66 cluster between baseline (moment 1) and mid-season
(moment 2), between mid-season (moment 2) and end-season (moment 3), and between baseline (moment 1) and end-season (moment 3). Distances between cluster centers for each pairwise comparison of clusters at each moment are also shown.
Chapter 4 Table 1. Descriptive statistics and variation (%; 95% CI) 86 of the anthropometrics between season #1 – early and
season #3 – late.
Chapter 4 Table 2. Descriptive statistics and variation (%; 95% CI) 87 of the technical and performance data between season
#1 – early and season #3 – late.
Chapter 4 Table 3. Parameters of the two models computed with 89 standard errors (SE) and 95% confidence intervals (CI).
JORGE MORAIS xviii
JORGE MORAIS xix
List of Abbreviations
AS – arm spana.u. – arbitrary unit
β – beta value for standardized coefficients Da – active drag
CDa – coefficient of active drag CFI – comparative fit index CI – confidence interval CP – chest perimeter
dv – intra-cyclic velocity fluctuation η2 – total eta square
FINA – Fédération Internationale de Natation HSA – hand surface area
ICC – intra-class correlation coefficient ICEPT – intercept
M – evaluation moment n – number of subjects % – percentage
ηp – propelling efficiency Pd – power to overcome drag Perf – swimming performance
r – Pearson product-moment correlation coefficient r2 – coefficient of determination
JORGE MORAIS xx
SCM – short course meter (swimming pool) SF – stroke frequency SI – stroke index SL – stroke length v – swimming velocity VAR – variable x2/df – chi-square/degrees of freedom z – standardized z-scores
JORGE MORAIS xxi
Abstract
These days, talent identification programs are becoming extremely useful providing important details on the performance determinants in young swimmers and how it change over time. This information might help swimmers to excel, and eventually reach an elite level. Therefore, the main aims of this thesis were: (i) to identify the main determinants of the young swimmers’ performance (study #1); (ii) observe and understand the young swimmers’ performance changes, and the determinant factors associated to it over one season (study #2); (iii) identify, classify and follow-up young swimmers, based on their performance and determinant factors, as well as their stability over one season (study #3); (iv) and develop a performance predictor model, over three consecutive seasons, based on the swimmers biomechanical profile (study #4). In study #1 it was computed a structural equation model for young swimmers’ performance based on selected kinematic, anthropometric, efficiency and hydrodynamic variables. It was verified that young swimmers’ performance depends from a set of anthropometric, kinematic, efficiency and hydrodynamic factors. In study #2 a latent growth curve model was developed. Young swimmers’ performance significantly improved, and with a significant inter-variability. Different determinant factors were responsible for such improvement in each evaluation moment. In study #3 a cluster analysis was used to classify, identify and follow-up the performance and its determinant factors. It was showed that within an age-group of prepubescent swimmers, three sub-groups with similar biomechanical characteristics were found. In study #4, a predictive model, over three consecutive seasons was developed based on biomechanics. The predictive model included an anthropometric, a kinematic and an efficiency factor, showing the multifactorial phenomenon that swimming is. The main conclusions of this thesis were that anthropometrics, kinematics, efficiency and hydrodynamics characterize young swimmers’ profile and their performance, showing an improvement during the time-frames evaluated.
Key-words: talent ID, training, kinematics, kinetics, anthropometrics, performance,
JORGE MORAIS xxiii
Resumo
Os programas de identificação de talentos estão a tornar-se de extrema utilidade, fornecendo dados importantes sobre os determinantes da performance em nadadores jovens, e como esta evolui ao longo do tempo. Esta informação pode ajudá-los a atingirem um nível de elite. No entanto, a literatura baseia-se estudos transversais ou em estudos longitudinais de curto prazo. Os principais objetivos desta tese foram: (i) identificar os principais determinantes da performance em nadadores jovens (estudo #1); (ii) observar e entender a evolução da performance em nadadores jovens, e os fatores determinantes associados, durante uma época (estudo #2); (iii) identificar, classificar e acompanhar nadadores jovens, com base na sua performance e fatores determinantes, bem como a sua estabilidade durante uma época (estudo #3); (iv) e desenvolver um modelo preditor da performance, durante três épocas consecutivas com base no perfil biomecânico dos nadadores (estudo #4). No estudo #1 desenvolveu-se um modelo de equações estruturais para a performance, com base em variáveis cinemáticas, antropométricas, eficiência e hidrodinâmicas. Verificou-se que a performance depende de um conjunto de fatores antropométricos, cinemáticos, eficiência e hidrodinâmicos. No estudo #2 foi desenvolvido um modelo de crescimento latente. A performance melhorou significativamente, e com uma inter-variabilidade significativa. Diferentes fatores determinantes foram responsáveis por essa melhoria em cada um dos momentos de avaliação. No estudo #3 foi utilizada a análise de clusters para classificar, identificar e acompanhar a performance e os seus fatores determinantes. Verificou-se em nadadores pré-púberes, existirem três subgrupos com características biomecânicas semelhantes. No estudo #4, foi desenvolvido um modelo preditivo, durante três épocas consecutivas, com base em fatores biomecânicos. O modelo preditivo incluiu uma variável antropométrica, uma cinemática e uma de eficiência, evidenciando que a natação competitiva é um fenómeno multifatorial. As principais conclusões foram que variáveis antropométricas, cinemáticas, eficiência e hidrodinâmicas caracterizaram o perfil dos nadadores jovens e a sua performance, mostrando uma melhoria nos períodos de tempo avaliados.
Palavras-chave: identificação de talentos, treino, cinemática, cinética, antropometria, performance, modelação
JORGE MORAIS 1
General Introduction
Research on young swimmers’ performance and its determinants are scarce and mainly based on cross-sectional designs (Saavedra et al., 2010; Jurimae et al., 2007; Geladas et al., 2005). For one side, this research design provides some information on the main determinants of young swimmers’ performance. Literature reports biomechanics (being anthropometrics, kinematics and hydrodynamics under this scientific field) as the main responsible for the young swimmers’ performance (Barbosa et al., 2014). On the other hand, these research designs unable to have an understanding of the swimmers’ changes over time, as well as, changes in the interaction among different determinants.
The best practice to gather a comprehensive insight on the relationships between all the factors that have an effect on swimming performance is designing longitudinal researches (Barbosa et al., 2015; Garrido et al., 2010; Latt et al., 2009a,b), albeit the number of papers reporting this are rather scarce. Having that said, as far as longitudinal studies reported in the literature goes, there are a few concerns that should be highlighted: (i) the sample: small and underpowered (on top of that, the subjects recruited are not always talented swimmers); (ii) the absence of modeling procedures and/or the data analysis selected not being the most cutting-edge and insightful; (iii) the time-frame (i.e. mostly short time-frames and/or with few evaluation moments) and; (iv) the relationship between the external and internal training loads are not provided or at least reported in a comprehensive way.
One of the new trends in sports sciences is the identification and development of talented young athletes. Overall, this process includes the identification, characterization and follow-up of young talented athletes (i.e. performance and its determinants) (Erlandson et al., 2008; Matthys et al., 2013; Robertson et al., 2014). In competitive swimming, as national and world records keep being broken, practitioners and researchers are willing to anticipate who will be the next top-ranked swimmer. Therefore, as in other sports, swimming fraternity is also keen to have a deep insight on this process.
Until recently, classical research designs and data analysis procedures (e.g. analysis of variance and regression models) selected in sports performance were not helpful
JORGE MORAIS 2
in gathering insight about such highly dynamic and complex relationships. Evidence has been gathered lately on this in adult/elite swimmers (Komar et al., 2014; Costa et al., 2013) despite definitive answers are needed. Yet, little or almost nothing is known about such relationships in young swimmers.
The majority of studies about young swimmers are based on correlations, analysis of variance and regression models (Vitor and Bohme, 2012; Latt et al., 2009a,b; Jurimae et al., 2007). These studies only provide the magnitude of association between the performance and its determinant factors, unable to report how those determinants interplay. One might consider that, as their adult/elite counterparts, young swimmers’ performance depends from interaction between several variables, belonging to different scientific fields (Barbosa et al., 2010a). That said, even though the same determinants can or cannot be in play, the partial contribution to the main outcome (i.e. performance) might be different from what has been reported earlier for adult/elite swimmers. Being biomechanics the domain with higher association to the young swimmers’ performance, one can speculate modeling such relationships would be interesting. Data on the change of the performance over time is also scarce. There is no information available in the literature if the partial contribution of each determinant is kept the same over time or not and if so, is there any relationship between these variations and the external training load?
Therefore, the aim of this thesis was to identify and follow-up young swimmers’ performance and its determinant factors over time.
The thesis features four research studies that enables to breakdown the main aim into:
identifying the main determinants of the young swimmers’ performance (chapter 1);
assess the changes in young swimmers’ performance and its determinants over one season (chapter 2);
identify, classify and follow-up over one season young swimmers, based on their performance and determinant factors, as well as assess their stability (chapter 3);
predict the performance based on the changes in the swimmers’ biomechanics over three consecutive seasons (chapter 4).
JORGE MORAIS 3
___________________________________________________________________
Chapter 1
Linking selected kinematic, anthropometric and hydrodynamic variables to young swimmer performance
JORGE MORAIS 5 Abstract
The aim of this study was to develop a structural equation model (i.e. a confirmatory technique that analyzes relationships among observed variables) for young swimmers’ performance based on selected kinematic, anthropometric and hydrodynamic variables. A total of 114 subjects (73 boys and 41 girls of mean age of 12.31 ± 1.09 years; 47.91 ± 10.81 kg body mass; 156.57 ± 10.90 cm height and Tanner stages 1-2) were evaluated. The variables assessed were the: (i) 100-m freestyle performance; (ii) stroke index; (iii) intra-cyclic velocity fluctuation; (iv) stroke length; (v) active drag; (vi) arm span and; (vii) hand surface area. All paths were significant (P < 0.05). However, in deleting the path between the hand surface area and the stroke index, the model goodness-of-fit significantly improved. Swimming performance in young swimmers appeared to be dependent on swimming efficiency (i.e. stroke index), which is determined by the remaining variables assessed, except for the hand surface area. Therefore, young swimmer coaches and practitioners should design training programs with a focus on technical training enhancement (i.e. improving swimming efficiency).
Key-words: confirmatory assessment, technical training, swim efficiency, predictive
JORGE MORAIS 7 Introduction
Swimming performance results from a multifactorial process that involves several scientific domains, such as the anthropometrics (Latt et al., 2009a; Geladas et al., 2005; Duché et al., 1993), hydrodynamics (Marinho et al., 2010a; Kjendlie and Stallman, 2008), kinematics (Barbosa et al., 2010a; Jurimae et al., 2007) and energetics (Greco et al., 2007; Poujade et al., 2002; Denadai et al., 2000). As in adult/elite swimmers, one of the main goals of swimming research is to identify the scientific domains and/or variables that predict swimming performance in children (i.e. young athletes) thereby enhancing the detection of future talent (Hohmann and Seidel, 2010; Silva et al., 2000). Nevertheless, research in young athletes ought to be less invasive, expensive and time-consuming than in adult/elite counterparts (Garrido et al., 2010). In this sense, several authors (Latt et al., 2010; Barbosa et al., 2010a; Kjendlie and Stallman, 2008) have estimated and/or measured variables in various scientific domains (i.e. anthropometric, hydrodynamic, kinematic and energetic) that are easy to collect and may predict performance and/or detect talented swimmers. Since swimming competition starts at an early age, it is important to know when and how these variables interact with each other, as well as with performance. Several authors studied these relationships (Barbosa et al., 2010a; Saavedra et al., 2010; Kjendlie and Stallman, 2008) aiming to describe and/or better understand this phenomenon. It is reported that young swimmers’ performance is strongly related with anthropometric and kinematic variables (Barbosa et al., 2010a; Vitor and Böhme, 2010). Moreover, both sets of variables are affected by the processes of growth and maturation (Latt et al., 2009b). Given this rationale, it seems that kinematic variables are those that best explain young swimmers’ performance. Swimming velocity (r2 = -0.93) and stroke frequency (r2 = -0.78) were highly correlated with 100-m freestyle performance (Latt et al., 2010). However, during growth and maturation processes, anthropometric variables are also related with swimming performance in young athletes (Saavedra et al., 2010; Latt et al., 2009a,b). The arm span (AS), seems to be a major performance determinant since it is correlated with stroke mechanics, namely the stroke length (SL) and stroke index (SI; Jurimae et al., 2007). Arm span (r2 = 0.48) and SI (r2 = 0.78) were reported as the best overall predictors in 100-m freestyle event (Latt et al., 2010). Moreover, hydrodynamic variables also play an important role in swimming performance
(Vilas-JORGE MORAIS 8
Boas et al., 2010) and are also commonly reported in studies involving young swimmers (Barbosa et al., 2010b; Marinho et al., 2010a). Understanding the relationships between human morphology and hydrodynamic resistance allows coaches to modify stroke mechanics to enhance performance (Benjanuvatra et al., 2001). Furthermore, active drag (Da) has an important role in swimming performance, being highly dependent on swimming technique (Kjendlie and Stallman, 2008).
A key question is to understand how these different scientific domains and variables interact to enhance swimming performance. In confirmatory research, analysis is driven by theoretical relationships among variables that are hypothesized and tested by the researchers. The present study aimed to confirm whether the hypothesized interaction takes place. A confirmatory model of such relationships based on existing exploratory research reported in the main literature could be useful, not only to prescribe appropriate periodization programs and training sets for young swimmers, but also to promote feasible and effective programs to detect and to select talent in competitive swimming. Structural equation modeling is a confirmatory technique (i.e. data analysis procedure) that assesses relationships among observed variables with the main goal of providing a quantitative test of the theoretical model hypothesized by the researchers. To our knowledge only one study has so far attempted to confirm correlates between young swimmers’ performance and at least some of these scientific domains (Barbosa et al., 2010a). The present paper is a follow-up from that study but more specially focused on understanding and developing the biomechanical factor (i.e. quantifying the partial contribution of the biomechanics domain to young swimmers’ performance) in the model reported by these authors (Barbosa et al., 2010a).
The aim of this study was to develop a structural equation model for performance in young swimmers based on selected kinematic, anthropometric and hydrodynamic variables. It was hypothesized that swimming performance in young swimmers might be related with these variables. The swimming performance is mainly related to swimming efficiency and this one to several kinematic, anthropometric and hydrodynamic variables.
JORGE MORAIS 9 Methods
Participants
A total of 114 young swimmers participating on a regular basis in regional and national level competitions volunteered as subjects. They comprised 73 boys and 41 girls with a chronological age of 12.31 ± 1.09 years (overall: 47.91 ± 10.81 kg of body mass; 156.57 ± 10.90 cm of height and Tanner stages 1-2 assessed by self-evaluation; boys: 12.72 ± 1.03 years old; 47.41 ± 10.09 kg of body mass, 157.20 ± 11.17 cm of height and Tanner stages 1-2 assessed by self-evaluation; girls: 11.47 ± 0.66 years old; 45.79 ± 6.66 kg of body mass, 154.56 ± 8.26 cm of height and Tanner stages 1-2 by self-evaluation).
Coaches and parents gave their consent for swimmers’ participation in this study and all procedures were in accordance to the Helsinki Declaration concerning human research. The Institutional Review Board of the University approved the study design.
Study design Theoretical model
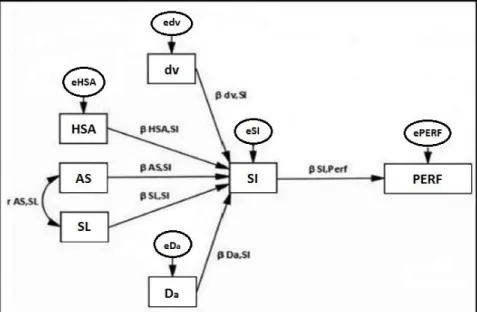
The theoretical model was designed according to exploratory state-of-the-art research and to test it was the object of our research. Figure 1 presents the theoretical model adopted for swimming performance based on selected kinematic, anthropometric and hydrodynamic variables in young swimmers. Swimming performance is related to kinematic (Barbosa et al., 2010a), anthropometric (Latt et al., 2009a; Duché et al., 1993) and hydrodynamic (Kjendlie and Stallman, 2008) variables. It was suggested that swimming performance depends on the relationship between the swimmer morphology, hydrodynamic resistance and swimming stroke mechanics (Benjanuvatra et al., 2001). The sequence of the theoretical model was designed according to these facts. For anthropometric assessment the surface area of the dominant hand (HSA) was computed. It is known that the propulsive surface is a key variable in increasing propulsive forces (e.g. propulsive drag and lift force). However, to the best of our knowledge, there are no studies deploying this variable in young swimmers. The AS is a variable reported on a regular basis in talent detection and selection (Hohmann and Seidel, 2010; Silva et al., 2000). The AS strongly affects not only the SL but also some hydrodynamic variables related to the body
JORGE MORAIS 10
length (Kjendlie and Stallman, 2008). Swimming with lower drag at constant velocity reduces the energy cost of swimming (Marinho et al., 2010a). The hydrodynamic variable assessed was the Da. The kinematic variables analyzed were the intra-cyclic velocity fluctuation (dv; Barbosa et al., 2008), the SL (Craig and Pendergast, 1979) and the SI (Costill et al., 1985). Intra-cyclic velocity fluctuation is the result of the propulsive and drag forces that interact on the swimmer and thus allows an overall assessment of the stroke mechanics (Barbosa et al., 2008). Stability or minimal change in SL at a high value is associated with higher performances (Sidney et al., 2010). The SI is strongly related to the energy cost of swimming (Costill et al., 1985). Indeed, the SI is the swimming economy estimator most often cited by the scientific community. It describes the swimmers’ ability to move at a given velocity with the fewest number of strokes (Costill et al., 1985). Performance was measured as the time spent in completing the 100-m freestyle event in an official competition. The 100-m freestyle was selected because it is the event in which most young swimmers participate on regular basis. It is also the most popular swimming event not only for young but also for adult/elite and master swimmers.
Figure 1. Theoretical path-flow model. AS – arm span; SL – stroke length; dv – intra-cyclic velocity fluctuation; HSA – hand surface area; Da – active drag; SI – stroke index; PERF – performance; β xi,yi – beta value for regression model between exogenous (xi) and endogenous (yi) variables; exi – disturbance term for a given endogenous variable; rxi,yi – correlation coefficient between two variables; xi→yi – variable yi depends from variable(s) xi; xi↔yi – variable yi is associated to variable xi.
JORGE MORAIS 11 Performance data collection
Swimming performance was assessed against time lists of the 100-m freestyle event in short course competitions (i.e. 25-m swimming pool) at local, regional or national level competitions. The time gap between assessment of all variables and swimming performance was less than the two weeks reported in other studies on the relationships between swimming performance and kinematic and/or energetic variables in young swimmers (Barbosa et al., 2010a, Marinho et al., 2010a).
Anthropometric data collection
The anthropometric variables selected for the path-flow model were the AS and the HSA. For the AS assessment, subjects were placed in an orthostatic position, with both arms in lateral abduction at a 90° angle with the trunk. Both arms and fingers were fully extended. The distance between the tip of each third finger was measured with a flexible anthropometric tape (RossCraft, Canada). The test/retest evaluation (i.e. Intraclass Correlation Coefficient) was very high for the AS (ICC = 0.99). For the HSA measurement, swimmers placed their dominant hand on the scan surface of a copy machine with fingers in the position they usually adopt while swimming. The scan surface was also fitted with a 2D calibration frame. Thereafter, the perimeter of the HSA was digitized in the Xerox machine (Xerox 4110, Norwalk, Connecticut, USA) and files were converted into pdf format. The HSA was afterward computed with dedicated software (Universal Desktop Ruler, v3.3.3268, AVPSoft, USA). The measurement procedures were: (i) scale calibration; (ii) digitization of hand surface perimeter and; (iii) computation and record of the HSA value (Morais et al., 2011). The test/retest evaluation was very high for the HSA (ICC = 0.99).
Biomechanical data collection
Intra-cyclic velocity fluctuation, SL and SI were selected as kinematic variables. Each swimmer performed three bouts of 25-m freestyle from an underwater start. For further analysis the mean value of the three repetitions was computed. Subjects performed the bouts alone without other swimmers in the same swim lane or in nearby lanes to reduce drafting, pacing effects and bias in the drag force (Marinho et al., 2010a). The subjects were advised to reduce gliding after the start (Barbosa et al., 2010b). To assess dv a speedo-meter cable (Swim speedo-meter, Swimsportec,
JORGE MORAIS 12
Hildesheim, Germany) was attached to the swimmers’ hip and the biosignal reading was acquired on-line at a sampling rate of 50 Hz. LabVIEW (v. 2009) software interface was used to acquire, display and process pairwise velocity-time data on-line during the swim bout. To transfer data from the speedo-meter to the software application a 12-bit resolution acquisition card (USB-6008, National Instruments, Austin, Texas, USA) was used (Barbosa et al., 2011). Data were exported to signal processing software (AcqKnowledge v. 3.5, Biopac Systems, Santa Barbara, USA) and filtered with a 5 Hz cut-off low-pass 4th order Butterworth filter. Intra-cyclic velocity fluctuation was computed as (Barbosa et al., 2010c):
dv =
√∑ (vi i−v̅)2Fi/n∑ vi iFi/n
(1)
Where dv represents intra-cyclic velocity fluctuation (dimensionless), v represents the mean swimming velocity (in m·s-1), vi represents the instant swimming velocity (in m·s-1), Fi represents the absolute frequency and n represents the number of observations. Stroke length was computed as (Craig and Pendergast, 1979):
SL =
𝑣𝑆𝐹
(2)
Where SL represents stroke length (in m), v represents the mean swimming velocity (in m·s-1) and SF represents the stroke frequency (in Hz). The v was calculated dividing the 13-m distance swam in the middle of the swimming pool by the time spent with a manual chronometer (Golfinho Sports MC 815, Aveiro, Portugal) by two expert evaluators (ICC = 0.97). The SF was measured with a chrono-frequency counter during three consecutive strokes by two expert evaluators (ICC = 0.96). Stroke index was also computed as a swim efficiency estimator (Costill et al., 1985):
SI = SL ∙ 𝑣
(3) Where SI represents stroke index (in m2·s-1), SL represents stroke length (in m) and v is the mean swimming velocity (in m·s-1).Hydrodynamic data collection
In the hydrodynamic domain, the Da was computed using the velocity perturbation method (Kolmogorov and Duplisheva, 1992). Each swimmer performed two maximal 25-m bouts of freestyle with an underwater start. The first bout was performed
JORGE MORAIS 13
without the perturbation device and the second one with the perturbation device. Subjects performed the bouts alone without other swimmers in the same or nearby swim lanes to reduce drafting, pacing effects and bias in the drag force (Marinho et al., 2010a). Active drag was calculated from the difference between the swimming velocities both towing and without towing a perturbation buoy (additional hydrodynamic body; Kolmogorov and Duplisheva, 1992; Kolmogorov et al., 1997). The drag of the perturbation buoy was computed from the manufacturer’s calibration of the buoy-drag characteristics and its velocity (Kolmogorov and Duplisheva, 1992). Swimming velocity was assessed over 13-m (between 11th-m and 24th-m) from the starting wall). The time spent to cover this distance was measured with a manual chronometer (Golfinho Sports MC 815, Aveiro, Portugal) by two expert evaluators as is customary with this method (Marinho et al., 2010a). The ICC for both evaluators was very high (ICC = 0.97). Active drag was calculated as (Kolmogorov and Duplisheva, 1992):
D
a=
Dbvbv2v3−vb3 (4)
Where Da represents the swimmers’ active drag at maximal velocity (in N), Db is the resistance of the perturbation buoy (in N) and, vb and v are the swimming velocities with and without the perturbation device (in m·s-1), respectively.
Statistical analysis
The Kolmogorov-Smirnov and the Levene tests were used to analyze normality and homocedasticity assumptions, respectively. Descriptive statistics (mean, one standard deviation, minimum and maximum) were computed. To assess the association between performance and remaining variables, Pearson correlation coefficients were computed between swimming performance and all selected variables (P ≤ 0.05). As rule of thumb, for qualitative and effect size assessments, the relationship was defined as: (i) very weak if r2 < 0.04; weak if 0.04 ≤ r2 < 0.16; moderate if 0.16 ≤ r2 < 0.49; high if 0.49 ≤ r2 < 0.81 and; very high if 0.81 ≤ r2 < 1.0. The level of statistical significance was set at P ≤ 0.05. For the structural equation modeling the path-flow analysis procedure was used. The interpretation of this kind of approach is based on: (i) the variables included (variables are inserted inside squares); (ii) the paths (i.e. arrows; an arrow between two variables means that one
JORGE MORAIS 14
variable determines the other); (iii) beta values (i.e. these suggest the contribution of one variable to the other: when the origin variable increases by one unit the destination variable increases by the amount of the beta value) and; (iv) residual errors and/or determination coefficient (represents the variable predictive error or the variable predictive value, respectively). Thereafter the model was computed and a confirmatory model obtained (i.e. a model that verified and confirmed the theoretical one). The estimation of linear regression standardized coefficients between exogenous and endogenous variables was computed. Standardized regression coefficients (b) were considered, and the significance of each one was assessed with the Student’s t test (P ≤ 0.05). When a given path was significant (P ≤ 0.05) and with a moderate/strong association it was reported as being “meaningful” (Winter, 2008). The quality of the model goodness-of-fit was measured by computing: (i) the ratio Chi-square/degrees of freedom (x2/df) and; (ii) the comparative fit index (CFI). The ratio Chi-square/degrees of freedom was considered qualitatively if (Wheaton, 1987): x2/df > 5 bad adjustment; 5 ≥ x2/df > 2 low adjustment; 2 ≥ x2/df > 1 good adjustment; x2/df ~1 very good adjustment. The comparative fit index was considered qualitatively if (Bentler, 1990): CFI < 0.90 bad adjustment; 0.90 ≤ CFI < 0.95 good adjustment; CFI ≥ 0.95 very good adjustment.
Results
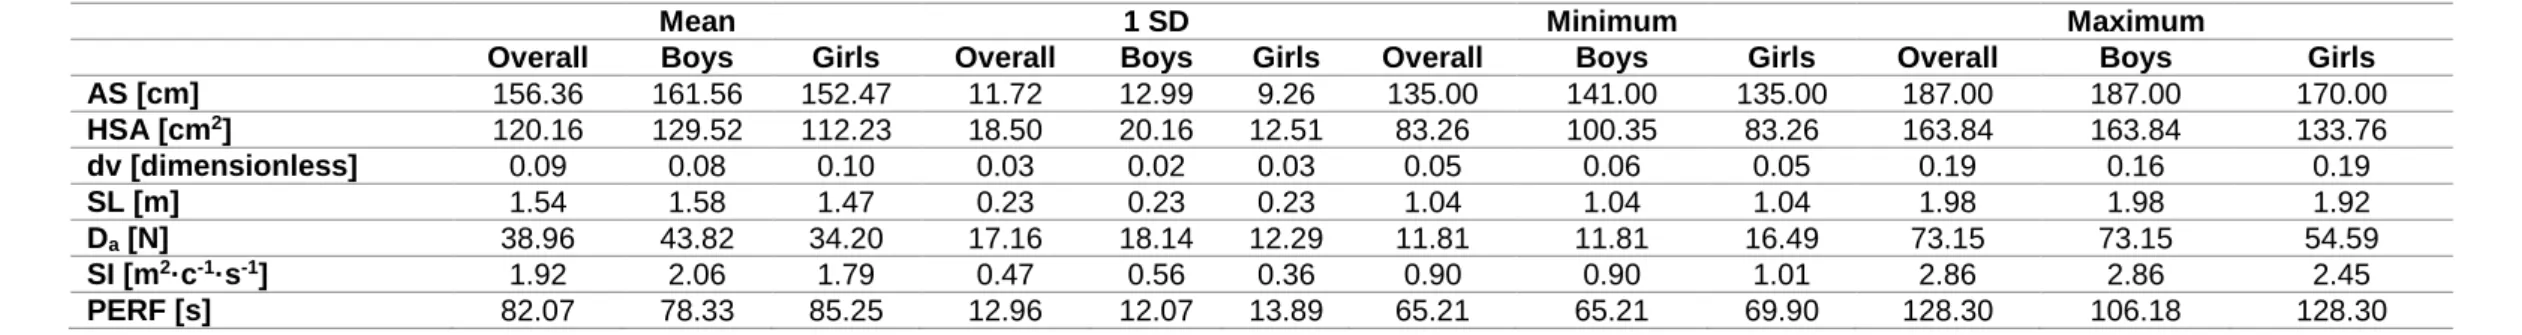
Table 1 presents descriptive statistics for overall sample (boys plus girls), boys only and girls only for all selected variables. Data variability, assessed by one standard deviation value, were moderate-high. This is especially obvious, concerning the overall statistics, for the HSA, ranging between 83.26 cm2 and 163.84 cm2, for the Da, ranging between 11.81 N and 73.15 N, as well as for the swimming performance, ranging between 65.21 s and 128.30 s. For boys, the HSA ranged between 100.35 cm2 and 163.84 cm2, the D
a between 11.81 N and 73.15 N and swimming performance between 65.21 s and 106.18 s. For girls, the HSA, Da and swimming performance ranged between 83.26 cm2 and 133.76 cm2, 16.49 N and 54.59 N, and 69.90 s and 128.30 s, respectively.
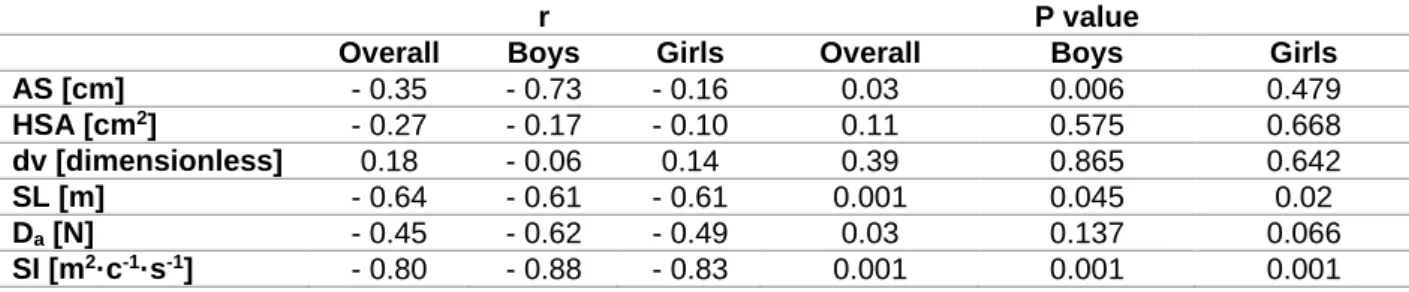
Table 2 presents the Pearson´s correlation coefficients between swimming performance and remaining selected variables for overall total (boys plus girls), boys only and girls only. Data revealed that swimming performance was meaningfully
JORGE MORAIS 15
associated with SI (overall: r = 0.80, P < 0.01; boys: r = 0.87, P < 0.01; girls: r = -0.82, P < 0.01) and SL (overall: r = -0.64, P < 0.01; boys: r = -0.61, P = 0.04; girls: r = -0.61, P = 0.02). On the other hand, swimming performance was not significantly associated with the dv (overall: r = 0.18, P = 0.39; boys: r = -0.05, P = 0.86; girls: r = 0.13, P = 0.64) nor with the HSA (overall: r = -0.27, P = 0.11; boys: r = -0.17, P = 0.57; girls: r = -0.09, P = 0.66).
JORGE MORAIS 16
Table 1. Overall, boys and girls descriptive statistics of anthropometric, kinematic, hydrodynamic and swimming performance variables.
Mean 1 SD Minimum Maximum
Overall Boys Girls Overall Boys Girls Overall Boys Girls Overall Boys Girls
AS [cm] 156.36 161.56 152.47 11.72 12.99 9.26 135.00 141.00 135.00 187.00 187.00 170.00 HSA [cm2] 120.16 129.52 112.23 18.50 20.16 12.51 83.26 100.35 83.26 163.84 163.84 133.76 dv [dimensionless] 0.09 0.08 0.10 0.03 0.02 0.03 0.05 0.06 0.05 0.19 0.16 0.19 SL [m] 1.54 1.58 1.47 0.23 0.23 0.23 1.04 1.04 1.04 1.98 1.98 1.92 Da [N] 38.96 43.82 34.20 17.16 18.14 12.29 11.81 11.81 16.49 73.15 73.15 54.59 SI [m2·c-1·s-1] 1.92 2.06 1.79 0.47 0.56 0.36 0.90 0.90 1.01 2.86 2.86 2.45 PERF [s] 82.07 78.33 85.25 12.96 12.07 13.89 65.21 65.21 69.90 128.30 106.18 128.30
AS – arm span; HAS – hand surface area; dv – intra-cyclic velocity fluctuation; SL – stroke length; Da – active drag; SI – stroke index; PERF – performance.
JORGE MORAIS 17
Table 2. Overall, boys and girls Person´s correlation coefficients between swimming performance and remain variables selected.
r P value
Overall Boys Girls Overall Boys Girls
AS [cm] - 0.35 - 0.73 - 0.16 0.03 0.006 0.479 HSA [cm2] - 0.27 - 0.17 - 0.10 0.11 0.575 0.668 dv [dimensionless] 0.18 - 0.06 0.14 0.39 0.865 0.642 SL [m] - 0.64 - 0.61 - 0.61 0.001 0.045 0.02 Da [N] - 0.45 - 0.62 - 0.49 0.03 0.137 0.066 SI [m2·c-1·s-1] - 0.80 - 0.88 - 0.83 0.001 0.001 0.001
AS – arm span; HSA – hand surface area; dv – intra-cyclic velocity fluctuation; SL – stroke length; Da – active drag; SI – stroke index.
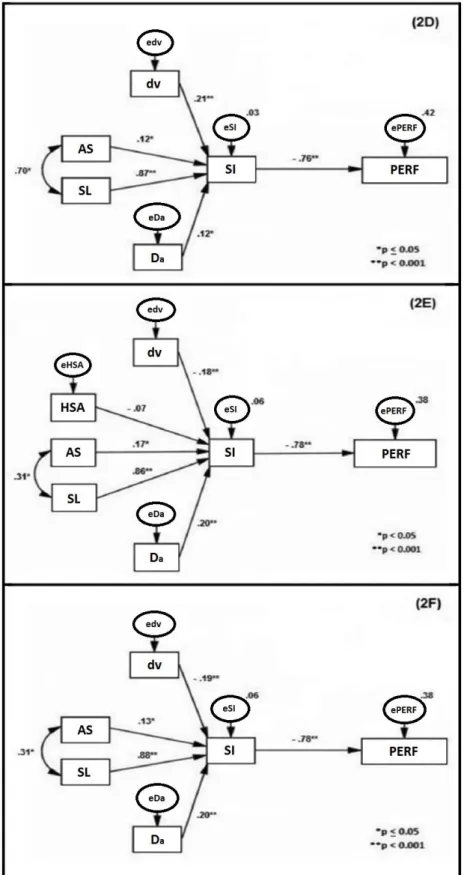
Figure 2 presents the confirmatory path-flow models for young swimmers’ performance (overall: 2A and 2B; boys: 2C and 2D; girls: 2E and 2F) based on selected anthropometric, hydrodynamic and kinematic variables. In each path the b value is reported (i.e., the standardized regression weight) for the regression model between each exogenous and endogenous variable. When the exogenous variable changes (i.e., origin of the path) by one unit, the endogenous variable (i.e. destination of the path) changes by the same quantity as the beta value. All paths linked in the theoretical model were significant in the confirmatory model. The overall model goodness-of-fit when including all variables (Figure 2A) was: (i) x2/df = 7.058 (i.e. bad adjustment) and; (ii) CFI = 0.601 (i.e. bad adjustment). For boys (Figure 2C) was: (i) x2/df = 4.607 (i.e. low adjustment) and; (ii) CFI = 0.592 (i.e. bad adjustment). For girls (Figure 2E) was: (i) x2/df = 3.516 (i.e. low adjustment) and; (ii) CFI = 0.640 (i.e. bad adjustment).
Deleting the HSA-SI path in the overall model (Figure 2B), for boys (Figure 2D) and for girls (Figure 2F) with subsequent recomputation of the remaining data, the new confirmatory model increased the predictive value of the models. The prediction of swimming performance based solely on biomechanics and its determining domains was 50%, 58% and 62% for overall data, boys and girls respectively. The SI was predicted based on remaining kinematic, anthropometric and hydrodynamic variables at 92%, 97% and 94% for overall data, boys and girls respectively. Moreover, the model goodness-of-fit improved meaningfully: (i) x2/df = 1.908 (i.e. good adjustment); CFI = 0.940 (i.e. good adjustment) for overall data; (ii) x2/df = 1.612 (i.e. good adjustment) and; CFI = 0.931 (i.e. good adjustment) for boys; (iii) x2/df = 3.010 (i.e.
JORGE MORAIS 18
low adjustment); CFI = 0.779 (i.e. bad adjustment) for girls. In this sense, the overall and boys confirmatory models had a good adjustment, although it was low for girls.
JORGE MORAIS 19
Figure 2. Overall confirmatory path-flow model including all variables computed (2A) and deleting variable that allowed to reduce the residual error and improve the goodness-of-fit (2B) with the subsequent recomputation of remain data. Boy’s confirmatory path-flow model including all variables computed (2C) and deleting
JORGE MORAIS 20
variable that allowed to improve significantly the goodness-of-fit (2D). Girl’s confirmatory path-flow model including all variables computed (2E) and deleting variable that allowed to improve the goodness-of-fit. HSA – hand surface area; AS – arm span; SL – stroke length; dv – intra-cyclic velocity fluctuation; Da – active drag; SI – stroke index; xi→yi – variable yi depends from variable(s) xi; xi↔yi – variable yi is associated to variable xi.
Discussion
The aim of this study was to develop a structural equation model for young swimmers’ performance based on selected kinematic, anthropometric and hydrodynamic variables and to quantify the partial contribution of biomechanics to young swimmers’ performance. Main data showed that swimming performance is dependent on SI (an efficiency estimator) and this in turn on the dv, SL, AS and Da. The prediction of swimming performance based solely on biomechanics was very high (0.50 ≤ r2 ≤ 0.62).
Mean data reported are similar to other studies involving prepubescent swimmers (Barbosa et al., 2010a; Barbosa et al., 2010b; Latt et al., 2009a; Jurimae et al., 2007). To the best of our knowledge, the HSA has never been assessed in young swimmers, except for hand length and width (Vitor and Bohme, 2010), and hand size (Helmuth, 1980). The data revealed a moderate-high dispersion, namely for performance and the HSA, which allowed the analysis of hypothetical relationships between these selected variables and swimming performance over a broader scope. Pearson´s correlation coefficients showed that swimming performance was significantly correlated with all variables, except for the dv and the HSA. The highest correlation values were for the SI and the SL. At least in adult/elite swimmers, higher-skilled swimmers present a higher SL than lower-higher-skilled counterparts (Barbosa et al., 2010c). The SI is also higher in international level than in national level swimmers (Sanchéz and Arellano, 2002). Scientific evidence for young swimmers is not so obvious, mainly because research with this cohort is scarce. However, it seems that the data for young swimmers is similar to that for their older counterparts. A higher AS is also associated with a higher performance level in young swimmers (Jurimae et al., 2007). Arm span imposes an increase in the SL (Pelayo et al., 1997). The Da was also correlated with performance. To enhance performance, swimmers have to
JORGE MORAIS 21
increase swimming velocity, which is one of the main determinants of Da. It was hypothesized that a higher HSA might increase propulsion. However, the correlation was not significant. Although an increased HSA might be an advantage, it should be stressed that the appropriate hand orientation (i.e. attack and pitch angles) on stroking has a role in enhancing performance (Rouboa et al., 2006; Bixler and Riewald, 2002). Probably some of the subjects assessed did not perform an appropriate hand orientation as well as varying in HSA.
The first overall confirmatory model (Figure 2A overall; boys 2C and girls 2E), including the HSA linked to SI, had a bad adjustment. Some studies suggested a relationship between hand shape (i.e. hand length) and swimming efficiency, or at any rate its thrust (Marinho et al., 2010b; Alves et al., 1998). However, most of those studies assessed adult swimmers (Gourgoulis et al., 2010) or made numerical simulations from adult models (Rouboa et al., 2006; Bixler and Riewald, 2002). There are few studies regarding its relationship in young swimmers, including pubescent ones (e.g. Alves et al., 1998; Helmuth, 1980). However, one study (Helmuth, 1980) reported a positive correlation between hand size and swimming performance in young swimmers. Despite this, it can be stated that there is no solid scientific evidence that at such early ages the HSA is as determinant of swimming performance or of swimming efficiency as it is in adult/elite swimmers.
The second confirmatory model (Figure 2B overall; boys 2D and girls 2F) removed the HSA-SI path presenting two hierarchical levels, and increased the model goodness-of-fit (i.e. good adjustment). The second level is the relationship between the SI and remaining kinematic, anthropometric and hydrodynamic variables selected. The SI is considered a viable variable by which to estimate overall swimming efficiency (Costill et al., 1985). The capacity to cover a given distance (i.e. SL) at greater velocity represents an increased swimming efficiency. The variables maintained in the final overall confirmatory model (i.e. AS, SL, dv and Da) had high ability to predict SI (overall: r2 = 0.92; boys: r2 = 0.97; girls: r2 = 0.94). From those variables, the SL had the higher standardized direct effect to SI (overall: β = 0.80, P < 0.001; boys: β = 0.87, P < 0.001; girls: β = 0.88, P < 0.001). This signifies that when SL increased by one meter, SI increased by 0.80 m2·s-1, 0.87 m2·s-1 and 0.88 m2·s-1 overall, boys and girls respectively. This is obvious since the SI is computed on the
JORGE MORAIS 22
basis of SL and the swimming velocity. Arm span is usually reported as being related to swimming performance (Latt et al., 2009a) because it is associated with improved swim efficiency (Saavedra et al., 2010). Another viable method of analyzing the overall swim mechanics is by means of the swimmers’ dv. Swimmers do not maintain a constant swim velocity due to variations of the limbs and trunk within the stroke cycle (Barbosa et al., 2008). Such a fact might decrease energy cost and thus improve swim efficiency. In this particular case, when dv increased by one arbitrary unit (a.u.), SI decreased by 0.09 m2·s-1 and 0.19 m2·s-1 for overall and girls models, respectively, though for boys it had essentially no effect. Active drag was also included in the model, since to maintain displacement, swimmers must overcome drag forces (Kjendlie and Stallman, 2008). To do this, they have to adopt the best possible hydrodynamic positions and segmental kinematics throughout the stroke. The final confirmatory first level included the SI-performance relationship. The SI had a moderate-high standardized direct effect on performance (overall: β = -0.71, P < 0.001; boys: β = -0.76, P < 0.001; girls: β = -0.78, P < 0.001). Without considering other scientific domains, the biomechanical domain and its determinants were good predictors of the performance (overall: r2 = 0.50; boys: r2 = 0.58; girls: r2 = 0.62). A previous study (Barbosa et al., 2010a) predicted performance in roughly 80% of cases, based only on biomechanical and energetic domains. It was not the aim of this paper to replicate this study (Barbosa et al., 2010a), using the same variables. Instead, the goal was to expand the biomechanical “branch” of the model reported by (Barbosa et al., 2010a) and to identify the anthropometric and hydrodynamic determinants and to understand the interplay between them. Thus, it can be speculated that remaining 30% (to increase the performance prediction up to 80% as previously reported) might be attributable to energetics, a domain not considered here. It could therefore be interesting in future to develop the energetics “branch” of the original model. Indeed, most of the technical and scientific evidence for young swimmers suggests that the best way to enhance performance is through improving technique. Swimming efficiency should be the focus at these ages, more so than the energy profile or other fitness components such as muscle strength or anaerobic fitness (Garrido et al., 2010; Van Praagh, 2000). Our data also suggests that, for young swimmers, biomechanics may well have a higher performance prediction power than energetics. Therefore, technique should represent the core of the training
JORGE MORAIS 23
program at these ages. Coaches should therefore design training programs focusing on improvement swimming technique (i.e. increasing the swimming efficiency). In prior exploratory researches the SI was one of the best performance predictors (Vitor and Bohme, 2010; Latt et al., 2009a; Klika and Thorland, 1994). For these studies, the SI-performance ranged from moderate to very high associations.
Young swimmers’ coaches and practitioners should thus design training programs with a focus on specific training sets for technique correction using a large variety of drills. By increasing swimming efficiency it is possible to meaningfully enhance the performance for this age-group. However, to increase swimming efficiency some further variables should be manipulated. Coaches must pay extra attention to technical issues such as an increased SL (related to a higher AS) and a better hydrodynamic position so as to decrease Da. Emphasis should also be given to improving stroke mechanics (e.g. inter-limb coordination in opposition and/or superposition) to avoid swim discontinuities as observed in adult/elite swimmers (Seifert et al., 2010). This same logic ought also be applied in talent identification and selection programs. The main limitations of this research were as follows: (i) a direct measure of the propulsive efficiency was not adopted, merely a swim efficiency estimator; (ii) short distance events such as the 100-m freestyle are strongly associated with energetics variables, at least in adult/elite swimmers, but not so obviously in younger counterparts; (iii) not included in the model were variables related to functional fitness (e.g. muscular strength or flexibility) that might influence stroke mechanics.
Conclusions
To conclude, it was possible to develop a confirmatory model to explain swimming performance in young swimmers. The data suggested that the biomechanical domain contributed 50% to overall sample performance (boys plus girls), 58% to boys only performance and 62% only to girls-only performance. Increasing swimming efficiency (i.e. improving swim technique) leads to a performance enhancement. On the other hand, swimming efficiency improvement is related to a decrease in the dv and an increase of the SL and AS. However, the increase in the Da is a result of the increase in swimming velocity. It would appear that the best way to improve performance is to improve technique, thus increasing efficiency and optimizing hydrodynamic position.
JORGE MORAIS 24
Therefore, the focus of training sessions for young swimmers should be on the enhancement of technique.
References
Alves F, Costa M, Gomes-Pereira J. (1998). The influence of swimming velocity on the kinematic characteristics of backstroke swimming. In: H Riehle, M Vieten (Eds), Proceedings of XVI International Symposium on Biomechanics in Sports (pp. 104-107). Konstanz: UVK Universitatsverlag Konstanz.
Barbosa TM, Fernandes RJ, Morouço P, Vilas-Boas JP. (2008). Predicting the intracyclic variation of the velocity of the centre of mass from segmental velocities in Butterfly stroke: A pilot study. J Sports Sci Med. 7: 201–209.
Barbosa TM, Costa M, Marinho DA, Coelho J, Moreira M, Silva AJ. (2010a). Modeling the links between young swimmer’s performance: energetic and biomechanical profiles. Pediatr Exerc Sci. 22: 379–391.
Barbosa TM, Costa MJ, Marques MC, Silva AJ, Marinho DA. (2010b). A model for active drag force exogenous variables in young swimmers. J Hum Sport Exerc. 5(3): 379–388.
Barbosa TM, Bragada JA, Reis VM, Marinho DA, Carvalho C, Silva AJ. (2010c). Energetics and biomechanics as determining factors of swimming performance: Updating the state of the art. J Sci Med Sport. 13(2): 262–269.
Barbosa TM, Costa MJ, Morais JE, Jesus S, Silva AJ, Batista J, Gonçalves J. (2011). Validation with videometry of an integrated system to assess horizontal intra-cyclic velocity with a mechanical speedo-meter. In: JP Vilas-Boas, L Machado, W Wangdo, AP Veloso (Eds), Biomechanics in Sports 29 (pp. 833–835). Porto: Portuguese Journal of Sport Sciences.
Benjanuvatra N, Blanksby BA, Elliott BC. (2001). Morphology and hydrodynamics resistance in young swimmers. Pediatr Exerc Sci. 13: 246–255.
Bentler PM. (1990). Comparative fit indexes in structural models. Psychol Bull. 107: 238–246.
JORGE MORAIS 25
Bixler BS, Riewald S. (2002). Analysis of swimmer’s hand and arm in steady flow conditions using computational fluid dynamics. J Biomech. 35: 713–717.
Craig A, and Pendergast D. (1979). Relationships of stroke rate, distance per stroke and velocity in competitive swimming. Med Sci Sports Exerc. 11: 278–283.
Costill D, Kovaleski J, Porter D, Fielding R, King D. (1985). Energy expenditure during front crawl swimming: predicting success in middle-distance events. Int J Sports Med. 6: 266–270.
Denadai B, Greco C, Teixeira M. (2000). Blood lactate response and critical speed in swimmers aged 10-12 years of different standards. J Sports Sci. 10: 779–784.
Duché P, Falgairette G, Bedu M, Lac G, Robert A, Coudert J. (1993). Analysis of performance of prepubertal swimmers assessed from anthropometric and bio-energetic characteristics. Eur J Appl Physiol Occup Physiol. 66(5): 467–471.
Garrido N, Marinho DA, Barbosa TM, Costa AM, Silva AJ, Pérez-Turpin JÁ, Marques MC. (2010). Relationships between dry land strength, power variables and short sprint performance in young competitive swimmers. J Hum Sport Exerc. 5(2): 240– 249.
Geladas ND, Nassis GP, Pavlicevic S. (2005). Somatic and physical traits affecting sprint swimming performance in young swimmers. Int J Sports Med. 26: 139–144. Gourgoulis V,Antoniou P, Aggeloussis N, Mavridis G, Kasimatis P, Vezos N, Boli A, Mavromatis G. (2010). Kinematic characteristics of the stroke and orientation of the hand during front crawl resisted swimming. J Sports Sci. 11: 1165–1173.
Greco C, Pelarigo JG, Figueira TR, Denadai BS. (2007). Effects of gender on stroke rates, critical speed and velocity of a 30-min swim in young swimmers. J Sports Sci Med. 6: 441–447.
Helmuth HS. (1980). Anthropometric survey of young swimmers. Anthropol Anz. 38(1): 17–34.
Hohmann A, and Seidel I. (2010). Talent prognosis in young swimmers. In: P Kjendlie, RK Stallman, J Cabri (Eds), Biomechanics & Medicine in Swimming XI (pp. 262-264). Oslo: Norwegian School of Sport Science.
JORGE MORAIS 26
Jurimae J, Haljaste K, Cicchella A, Latt E, Purge P, Leppik A, Jurimae T. (2007). Analysis of swimming performance from physical, physiological and biomechanical parameters in young swimmers. Pediatr Exerc Sci. 19: 70–81.
Kjendlie PL, and Stallman RK. (2008). Drag characteristics of competitive swimming children and adults. J Appl Biomech. 24(1): 35–42.
Klika RJ, and Thorland WG. (1994). Physiological determinants of sprint swimming performance in children and young adults. Pediatr Exerc Sci. 6: 59–68.
Kolmogorov S, and Duplishcheva O. (1992). Active drag, useful mechanical power output and hydrodynamic force in different swimming strokes at maximal velocity. J Biomech. 25:311–318.
Kolmogorov S, Rumyantseva O, Gordon B, Cappaert JM. (1997). Hydrodynamic characteristics of competitive swimmers of different genders and performance levels. J Appl Biomech. 13:88–97.
Latt E, Jürimäe J, Haljaste K, Cicchella A, Purge P, Jurimae T. (2009a). Longitudinal development of physical and performance parameters during biological maturation of young male swimmers. Percept Mot Skills. 108:297–307.
Latt E, Jurimae J, Haljaste K, Cicchella A, Purge P, Jurimae T. (2009b). Physical development and swimming performance during biological maturation in young female swimmers. Coll Antropol. 33: 117–122.
Latt E, Jurimae J, Maestu J, Purge P, Ramson R, Haljaste K, Keskinen K, Rodriguez FA, Jurimae T. (2010). Physiological, biomechanical and anthropometrical predictors of sprint swimming performance in adolescent swimmers. J Sports Sci Med. 9: 398– 404.
Marinho DA, Barbosa TM, Costa MJ, Figueiredo C, Reis VM, Silva AJ, Marques MC. (2010a). Can 8 weeks of training affect active drag in young swimmers? J Sports Sci Med. 9: 71–78.
Marinho DA, Barbosa TM, Reis VM, Kjendlie PL, Alves FB, Vilas-Boas JP, Machado L, Ailva AJ, Rouboa A. (2010b). Swimming propulsion forces are enhanced by a small finger spread. J Appl Biomech. 26: 87–92.
JORGE MORAIS 27
Morais JE, Costa MJ, Mejias EJ, Marinho DA, Silva AJ, Barbosa TM. (2011). Morphometric study for estimation and validation of trunk transverse surface area to assess human drag force on water. J Hum Kinet. 28: 5–13.
Pelayo P, Wille F, Sidney M, Berthoin S, Lavoie JM. (1997). Swimming performances and stroking parameters in non skilled grammar school pupils: relation with age, gender and some anthropometric characteristics. J Sports Med Phys Fitness. 37(3): 187–193.
Poujade B, Hautier CA, Rouard A. (2002). Determinants of the energy cost of frontcrawl swimming in children. Eur J Appl Physiol. 87:1–6.
Rouboa A, Silva A, Leal L, Rocha J, Alves F. (2006). The effect of swimmer’s hand/forearm acceleration on propulsive forces generation using computational fluid dynamics. J Biomech. 39(7): 1239–1248.
Saavedra JM, Escalante Y, Ferran AR. (2010). A multivariate analysis of performance in young swimmers. Pediatr Exerc Sci. 22: 135–151.
Sánchez J, and Arellano R. (2002). Stroke index values according to level, gender, swimming style and event race distance. In: K Gianikellis (Ed), Proceedings of the XXth International Symposium on Biomechanics in Sports (pp. 56-59). Cáceres: Universidad de Extremadura.
Seifert L, Toussaint HM, Alberty M, Schnitzler C, Chollet D. (2010). Arm coordination, power, and swim efficiency in national and regional front crawl swimmers. Hum Mov Sci. 29: 426–439.
Sidney M, Alberty M, Leblanc H, Chollet D. (2010). Stroking parameters during competition. In: L Seifert, D Chollet, I Mujika (Eds), The world book of swimming: from science to performance (pp. 443-458). New York: Nova Science Publishers. Silva AJ, Costa AM, Oliveira PM, Reis VM, Saavedra J, Perl J, Rouboa A, Marinho DA. (2007). The use of neural network technology to model swimming performance. J Sports Sci Med. 6: 117–125.
Van Praagh E. (2000). Development of anaerobic function during childhood and adolescence. Pediatr Exerc Sci. 12: 150–173.
JORGE MORAIS 28
Vilas-Boas JP, Costa L, Fernandes RJ, Ribeiro J, Figueiredo P, Marinho DA, Silva AJ, Rouboa A, Machado L. (2010). Determination of the drag coefficient during the first and second gliding positions of the breaststroke underwater stroke. J Appl Biomech. 26: 324–331.
Vitor FM, and Böhme MT. (2010). Performance of young male swimmers in the 100 meters front crawl. Pediatr Exerc Sci. 22: 278–287.
Wheaton B. (1987). Assessement of fit in overidentified models with latent variables. Sociol Methods Res. 16: 118–154.
Winter E. (2008). Use and misuse of the term “significant”. J Sports Sci. 26(5): 429– 430.
JORGE MORAIS 29
___________________________________________________________________
Chapter 2
Longitudinal modeling in sports: young swimmers’ performance and biomechanics profile
JORGE MORAIS 31 Abstract
New theories about dynamical systems highlight the multifactorial interplay between determinant factors to achieve higher sports performances, including in swimming. Longitudinal research does provide useful information on the sportsmen’s changes and how training help him to excel. These questions may be addressed in one single procedure such as latent growth modeling. The aim of the study was to model a latent growth curve of young swimmers’ performance and biomechanics over a season. Fourteen boys (12.33 ± 0.65 years-old) and 16 girls (11.15 ± 0.55 years-old) were evaluated. Performance, stroke frequency, intra-cyclic velocity fluctuation, arm’s propelling efficiency, active drag, active drag coefficient and power to overcome drag were collected in four different moments of the season. Latent growth curve modeling was computed to understand the longitudinal variation of performance (endogenous variables) over the season according to the biomechanics (exogenous variables). Latent growth curve modeling showed a high inter- and intra-subject variability in the performance growth. Gender had a significant effect at the baseline and during the performance growth. In each evaluation moment, different variables had a meaningful effect on performance (M1: Da,β = -0.62; M2: Da, β = -0.53; M3: ηp,β = 0.59; M4: SF, β = -0.57; all P < 0.001). The models’ goodness-of-fit was 1.40 ≤ x2/df ≤ 3.74 (good-reasonable). Latent modeling is a comprehensive way to gather insight about young swimmers’ performance over time. Different variables were the main responsible for the performance improvement. A gender gap, intra- and inter-subject variability was verified.
Key-words: modeling, kinematics, hydrodynamics, season adaptations, contribution
JORGE MORAIS 33 Introduction
Talent identification, development, and follow-up are some of the major challenges that sports researchers and practitioners still face nowadays. Swimming performance is characterized by the multi-dimensional interplay of different scientific fields, where a highly complex interaction between several variables exists (Barbosa et al., 2010). Cross-sectional studies reported relationships between young swimmers’ performance, Energetics (Toubekis et al., 2011), Biomechanics (Morais et al., 2012) and Motor Control (Silva et al., 2013). Nevertheless, from among all these scientific fields, Biomechanics plays a major role by explaining 50–60% of the performance of young swimmers (Morais et al., 2012). Probably the partial contribution of each key factor to performance may change across time, for example, over a season. However, until now no longitudinal research has been conducted about it in sports performance.
Moreover, longitudinal research should help in gathering insight into: (i) how biomechanical variables interplay and affect performance; (ii) the dynamical changes that happen at these early ages; (iii) the partial contribution of each determinant factor over time. For a long time sports research was based on the assumption that intra- and inter-subject variability should be minimized. Nowadays, dynamic systems theory and non-linear approaches suggest that variability should not be considered as a random error (Seifert et al., 2013). Evidence has been gathered lately about this topic in adult/elite swimmers (Costa et al., 2013; Komar et al., 2014) even though definitive answers are needed. Besides this, little or almost nothing is known about it in young swimmers. Interestingly young sportsmen, including swimmers, are supposed to be among the ones with a higher variability due to their allegedly low expertise level. It seems that athletes with lower (such as young swimmers) and very high expertise (including elite swimmers) levels are the ones with the highest variability (Seifert et al., 2011).
Until now, classical research designs and data analysis procedures (e.g. analysis of variance and regression models) selected on regular basis in sports performance were not helpful in gathering insight about such highly dynamic and complex relationships. Latent growth curve modeling is a structural equation modeling technique for longitudinal dataset. It is characterized by estimating intra- and