A Work Project, presented as part of the requirements for the Award of a Master Degree in Finance from the NOVA – School of Business and Economics.
W
HAT ARE THE MOST EFFECTIVE FACTORS OF VALUE CREATION INLBO
TRANSACTIONS
:
CORPORATE GOVERNANCE VS LEVERAGE EFFECT?
C
ASE STUDY:
EQT
CONFIDENTIAL
JEAN-RICHARD AUDIN (MASTER STUDENT NUMBER:27613)
A Project carried out on the Master in Finance Program, under the supervision of: Professor Duarte Pitta Ferraz (NOVA - School of Business and Economics)
Professor Philippe Grégoire (Louvain School of Management)
Abstract
“W
HAT ARE THE MOST EFFECTIVE FACTORS OF VALUE CREATION INLBO
TRANSACTIONS
:
CORPORATE GOVERNANCE VS LEVERAGE EFFECT?
C
ASE STUDY:
EQT”
The purpose of this project work is to identify the most effective factor of value creation, between implementing a good corporate governance structure and setting up leveraged transaction structures. With the help of internal documents obtained from EQT, we have challenged some theoretical aspects to the E.On Energy from Waste case, one of the most successful deal in Europe. The data available supports the view that the maximize return will be achieved using both factors of value creation considered in this work project, acknowledging nevertheless that most of value creation is coming from long term and sustainable growth.
Keywords:
Introduction
Nowadays, the private equity market is in full expansion and mutation. Consequently, it is much more difficult to distinguish from the competition than in the past and to provide competitive returns to investors.
The object of the project work is to perform a qualitative analysis of the value creation process used by EQT, a Swedish private equity house, illustrated by one of their investments: E.On Energy from Waste (“EEW”). After introducing some theoretical aspects and literature reviews, with the aim to understand the different drivers of value creation and leverage effects, we will discuss how these apply to EQT and more specifically on the EEW case. We will then discuss the outcome this review and try to understand what are the characteristics that EQT is promoting as elements of value creation and discuss how these might result in being a competitive advantage.
This paper begins with a theoretical part which introduces the leveraged buyout mechanism follows by the private equity profession and further discuss value creation realized by private equity houses. Then comes the practical part with, first of all, a presentation of EQT and its investment strategy followed by the analysis of EEW deal and ending by an analysis of the results. The conclusion summarizes the most important results for EQT of the research and suggests the future research opportunities.
Leveraged Buyout1
Definitions
“In a leveraged buyout, a company is acquired by a specialized investment firm using a relatively small portion of equity and a relatively large portion of outside debt financing. The leveraged buyout investment firms today refer to themselves (and are generally referred to) as private equity firms. In a typical leveraged buyout transaction, the private equity firm buys majority control of an existing or mature firm.” (Kaplan, S.N. and Strömberg, P.J., 2009, p.121). The phenomenon of leveraged buyouts (“LBO”) and Private Equity has become important in the eighties and has played an important role in the financial markets today (Kaplan, S.N. and Strömberg, P.J.,2009; Sannajust A., Arouri M., Chevalier A., 2015). At the beginning of the twenty-first century, about one-fourth of the mergers & acquisitions activity was due to the buyout funds (Metrick A., Yasuda A., 2010).
Frequently, leveraged buyout is achieved by implementing an acquisition structure. At the top of the structure, there is a holding company which activity is to only hold financial assets. The holding company, usually named NewCo or HoldCo in the jargon, enters into debt for the purpose of acquiring the target company (i.e. the company being bought out) and thereafter uses the cash flows generated by the activity of that company to repay the debt.
The term leveraged buyout is a generic term which has several variants:
- Leveraged Management Buyout (“LMBO”) refers to the situation where this is the current management of the company taking over using a leveraged buyout structure. - Management Buy-in refers to a situation where a management team is raising funds,
most of the time with the help of external investors, to acquire the company with the view of replacing the current management team in place.
- Build-up refers to using leveraged buyout to take over other companies from the same sector to benefit from synergies.
- Owner Buyout (“OBO”) refers to the situation where the majority shareholder repurchases the stocks from the minority shareholders by using a mechanism of leveraged buyout.
The stakeholders in a leveraged buyout transaction
There are four important stakeholders in a leveraged buyout transaction: the target company, the seller, the fund or the acquirer, the debt investor.
First of all, before entering into a leveraged buyout transaction, it is necessary to identify the potential targets. Due to the particularity of using large amounts of debt, the targets should ideally present the two following characteristics:
- It must generate stable and sufficient cash flows over time to be able to repay the debt. - It must not need important investments as the cash flows generated by the company
will essentially be used to repay the debt financing.
Consequently, the targets are often companies that are mature and which business is stable. As the financial risk is important due to the large indebtedness of the company, the target companies must have a low industrial risk. They are often operating in a niche sector with a comfortable position on the market and where entry barriers are high and substitution risks low, ideally being cash cows. However, it can be observed that with a decreasing risk aversion, some investment funds can identify others targets with a strong growth or with consolidation opportunities. They can also decide to invest in more challenging sectors where the revenue is more volatile and cyclical or where the investments could be important and the market can change rapidly.
Secondly, the sellers who are interested to sell their company to a leveraged buyout fund can be divided in four main categories:
- The small and medium-sized enterprises willing to sell their business but not keen though to sell to competition nor to make an Initial Public Offering (“IPO”);
- The companies that are willing to sell one or several subsidiaries or divisions; - Investment funds willing to exit and open to sell to other investment funds;
- The “public-to-private” operations consist to use a leveraged buyout transaction to take the company off the market. It may be interesting for the company whose stocks are undervalued and shows low liquidity.
Thirdly, we have the acquirer. In many instances, the acquirer is a leveraged buyout fund that have a specific expertise such as private equity houses, which will be further described in the chapter about Private Equity. These investment funds are usually marketing a high return (around 20 to 25%) since leveraged buyout transactions are much riskier than other traditional investments. This is also common practice that the investment funds are not investing alone. They can form a joint-venture when they invest together with another fund to a have better repartition of their risks or to be able to buy bigger companies. At other times, they invest alongside an industrial investor who has a minority position to benefit of his expertise in the industry.
Finally, third parties’ debt financing, most of the time being a bank or credit/direct lending funds, agree to lend money to the investment funds to perform their leveraged buyout transactions. In general, for borrowings below 10 million euros, the debt is financed by one single bank, most of the time, the same bank of the target. When the amounts involved are higher, the financing is negotiated by the funds with a pool of banks or funds. Sometimes, this is taking the form of a stapled financing that is a pre-arranged financing negotiated by the seller with the banks and is offered to the applicants for buying the company.
To obtain a high leverage, it is necessary to structure the financing with different levels of risks. In general, the structure of the financing is divided into three levels:
- Senior debt: the amount of the senior debt is in general from three to five times the gross operating surplus and is split in different levels according to their risks (level A, B, C) which interest rate is determined depending on the risk borne;
- Junior debt: bonds and mezzanine loans constitute the subordinated debt. Due to the higher level of risk, the interest rate can be very high and the lender may request to implement of supervisory board to monitor the management of the company;
- Equity : the amount of money being invested straight from the acquirer.
This structure in 3 levels can be facilitated by a credit granted by the seller and/or a securitization of some target’s assets. In additional to the financing means of the holding structure, the operating company has also its own financing means, such as Revolving Credit Facility, acquisition facility and capex facility. This structure of the financing gives more possibilities:
- To benefit from the leverage effect;
- To obtain debt financing with a longer term;
- To have more flexibilities in the repayment of the debt and, as a result, a more flexible management of cash flows.
- To put in place operations that would be otherwise impossible if they were financed only by senior debt and equity.
The exit of the leveraged buyout
In many cases, leveraged buyout transactions have a limited time life. Indeed, investors being involved in financing the acquisition of the target expect to receive their return back in the medium term, i.e. between three to eight years. There are several exit strategies, but the most common ones are the Initial Public Offering (“IPO”) or the acquisition by another strategic buyer. Depending of the good performance of the target company, the exit strategy thought can be different. When the target company is performing well, the most common strategies are:
- IPOs : this option is not always the best because of the cost of the IPO but also because of the possible under-valuation by the market;
- Acquisition by a strategic buyer: it may result in the best exist strategy, especially when potential acquirers show a strong interest for the company, leading potentially to a competitive auction process.
- Secondary leveraged buyout: this happens when the company is bought by another investor who will in its turn implement another leveraged buyout structure, mainly other alternative investment funds.
- The leverage recap: this consists in entering into a debt re-financing process to either increase the amount of debt financing or to benefit from an evolution of the market in order to obtain better financing terms. This is not, per say, an exit strategy because the fund remains the owner of the company but that gives the opportunity to partially return a portion of the initial investment.
Unfortunately, some of the acquisitions will happen to not to be as performing as expected and lead to a distress situation when it comes to repay its borrowings. Two solutions are thus conceivable:
- Take-over by the creditors: this situation happens when the company debt financing is too large to face the draft but the lender is of the opinion that the operating situation of the company is still sustainable;
- Bankruptcy: this remains the worst scenario possible but would happen if the company does not generate enough cash flow to face the debt drafts and where no negotiation to find a refinancing plan is possible, through either capital injection or debt refinancing, with the different stakeholders.
Value Creation
As we discuss below in the private equity section, there is often a value creation when a company is turned private by a PE fund. Several reasons can explain this value creation such as the governance model and investment structures that are put in place, the use of leveraged buyout, the concentration of the ownership … (Kaplan, S.N. and Strömberg, P.J., 2009). The academic studies about value creation through private equity transactions is relatively new (Achleitner A.-K., Braun R., Engel N., Figge C., Tappeiner F., 2010). However, this question about the creation of value is very important. Indeed, if the source of value creation comes from the incentive mechanisms implemented for the management and from the indebtedness that requires discipline to manage the company, it is no longer sufficient to differentiate from the competition (Jensen M. C., 1989 and Braun M. R., Latham S. F., 2007). In a more competitive environment, it is necessary to identify other sources of value creation to be able to give an attractive return to the investors. This new source of value creation could come from the board of directors implemented by the private equity firms when it buys a company (Braun M. R., Latham S. F., 2007).
Leverage and value creation
It emerges from empirical results in Europe that “Our key finding is that two-thirds of
value creation can be attributed to operational and market effects, while the remaining third is due to the leverage effect.” (Achleitner A.-K., Braun R., Engel N., Figge C., Tappeiner F., 2010,
p.17). The leverage effect depends on the size of the deal. For deals higher than 100 million euros, the leverage effect is much more important than for the smaller deals. On the opposite, growth in revenue is much more important for smaller deals than for larger. For their sample (206 European buyouts transactions between 1991 and 2005), Achleitner A.-K., Braun R., Engel N. , Figge C., Tappeiner F. (2010) obtained the results that are displayed in the table 1.
The table 12 shows a total creation value of 2.47 times money which breaks down the value creation as follows:
- One-third of the value creation is due to the leverage effect and two-thirds of the value creation is due to operating improvements and market effects.
- The EBITDA growth and the free cash flow (“FCF”) effect together represent 46% of the total value creation (1.13 times the money) while the leverage effect represent 32% (0.78 times the money).
The leverage effect is due to the financial engineering. However, the higher return could be associated to a leverage or a risk premium. The improvement of the EBITDA and the FCF could be associated to the capacity of the PE fund to identify good market timings, to negotiate well during the deals but also the higher multiples could just be an indication about the future perspectives for the company (Achleitner A.-K., Braun R., Engel N. , Figge C., Tappeiner F., 2010).
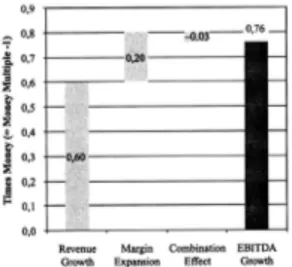
Achleitner A.-K., Braun R., Engel N. , Figge C., Tappeiner F. (2010) give also an analysis of the components of the EBITDA growth that is summarised in the table 22. The principal component of the EBITDA growth is the growth in revenue which represents 79%
2 From Achleitner A.-K., Braun R., Engel N. , Figge C., Tappeiner F. (2010). Value Creation Drivers in
(0.60 times money) of the total growth. Comes after the margin expansion for 26% (0.20 times money).
However, it is emphasised that: “[…] the negative combination effect (-0.03 times money) indicates that sales growth was achieved at the expense of margin deterioration on average, or vice-versa. However, this effect is of relatively small importance.” (Achleitner A.-K., Braun R., Engel N. , Figge C., Tappeiner F., 2010, p.21).
A slight difference can be observed between the larger deals, i.e. superior to 100 million euros, and smaller deals, i.e. inferior to 100 million euros. Indeed, the leverage effect seems to play a more important role in the large deal but the unlevered times money is relatively the same for the large and small deals. When it come to the growth in the EBITDA, the improvement of the margin is more decisive for the larger deals than for the smaller ones (Achleitner A.-K., Braun R., Engel N. , Figge C., Tappeiner F., 2010).
It has been noted that the periods of recession give the opportunity for the private equity firm to make good deals. Indeed, the median times money is different and higher (+5%) if the deals is taking place during a recession period instead (Achleitner A.-K., Braun R., Engel N., Figge C., Tappeiner F., 2010).
Corporate governance and value creation
As discussed, the discipline imposed by a larger indebtedness and the incentives for the management enable to boost the performance of the companies (Jensen M. C., 1989; Peck S. W., 2004 and Braun M. R., Latham S. F., 2007 and 2009). However, if private equity firms want to distinguish on this competitive market, they need to identify others source of value creation such as the corporate governance structure (Braun M. R., Latham S. F., 2007). Braun M. R., Latham S. F. (2007) thinks that: “Accordingly, for buyout firms and their investors, the success of buyouts may increasingly depend on having the right governance structure to achieve superior returns.” (Braun M. R., Latham S. F., 2007, p. 878). Cumming D., Walz U. (2010) supports the same idea, the returns depend also on the corporate governance mechanisms (Cumming D., Walz U., 2010 and Cumming D., Siegel D.S., Wright M., 2007).
On top of the role of control that the board of directors plays to mitigate the conflict of interests between the shareholders and the management, they could play a role in the value creation (Zahra S. A., Pearce J. A. II,1989 and Braun M. R., Latham S. F., 2007 and 2009). Indeed, the board of directors can bring expertise, experience that are essential to the improve the performance of the company and, as a result, the value creation. Moreover, the presence of representatives from outside the company is vital, even more when the environment of the company is uncertain (Zahra S. A., Pearce J. A. II,1989; Daily C. M., Dalton D. R., 1994 and Braun M. R., Latham S. F., 2007 ).
There is a correlation between the background of the deal partners and the performance of the deal. “General partners who are ex-consultants or ex–industry managers are associated with outperforming deals focused on internal value-creation programs, and bankers or ex-accountants with outperforming deals involving significant mergers and acquisitions.” (Acharya V. V., Gottschalg O. F., Hahn M., Kehoe C., 2013, p. 368). That means that the deal partners who have a specific background in the industry are able to take key decision to improve
the firm internally (“organic strategy” (Acharya V. V., Gottschalg O. F., Hahn M., Kehoe C., 2013, p. 371)) and impliedly its performance. Conversely, the deal partners who have a financial background have more success in the deal that requires an “inorganic strategy” (Acharya V. V., Gottschalg O. F., Hahn M., Kehoe C., 2013, p. 371) like mergers and acquisitions (Acharya V. V., Gottschalg O. F., Hahn M., Kehoe C., 2013).
When a public company is bought by a private equity firm, the size of the board can be reduced and restructured in case it is too large. Indeed, too large board can imply a lower performance of the firm because of the agency costs (Cornelli F., Karakas O. 2008 and Braun M. R., Latham S. F., 2009). Conversly, these boards can also be restructured to increase the number of non-executive directors with a specific expertise in relation to the business of the target company (Braun M. R., Latham S. F., 2009). However, Cornelli F., Karakas O. (2008) further commented that the non-executive directors are replaced by the employees of the private equity house, preferring to use their own resources instead. They will use however their resources with parsimony as they are costly and their time is limited. In a nutshell, the involvement of the private equity firm and the size of the board will be more important if the target company requires a lot of expertise and supervision, not to mention the very high rotation of CEOs and other members of the board (Cornelli F., Karakas O., 2008)3.
In the light of the above, the performance of the target company can be also improved by the discipline imposed and implemented by the PE house at the level of the corporate governance of the company (Cumming D., Siegel D.S., Wright M.,2007).
3 More details about the evolution of the board when a company is bought by a private equity firm can
be found in: Cornelli F., Karakas O. (2008). Private Equity and Corporate Governance: Do LBOs Have
More Effective Boards?. Online on the SSRN website:
Private Equity
Definition
“Private Equity is a collective investment scheme (fund) that invests in companies with the intention of obtaining a controlling interest, usually by becoming a majority shareholder, sometimes by becoming the largest plurality shareholder.” (Cumming D., Walz U., 2010, p. 728).
In the 1980s, there was an important transformation in the financial markets with the development of the leveraged buyouts transactions and the introduction of private equity (“PE”) houses (Jensen M.C., 1989). As financial intermediaries and, also, their day-to-day roles as board members and advisers, private equity firms increase their importance in the financial markets (Metrick A., Yasuda A., 2010 and Kaplan, S.N. and Strömberg, P.J., 2009; Sannajust A., Arouri M., Chevalier A., 2015). One of the reasons of their success is that the structures implemented by the PE firms are more efficient than the typical public corporation structuring according to Jensen M. C. (1989). Indeed, in PE houses structure, the ownership is concentrated, the managerial compensations are based on performance, high use of leveraged capital structures and active governance. That is actually the opposite of the public companies where the ownership is diluted throughout a huge amount of shareholders, the leverage is not optimised and corporate governance is weaker (Jensen M.C., 1989).
Typical characteristics of a PE fund
Legal aspects
PE is somewhat linked to leveraged buyout. These firms are specialized investment firms that use this operation to acquire companies by using a small percentage of equity and a large percentage of debt while usually keeping full control. The funds, acquiring the target companies, are raised through a Private Equity funds (Kaplan, S.N. and Strömberg, P.J., 2009).
fund before the end of the fund. Their committed funds cannot be withdrawn during the lifetime of the private equity funds, on the opposite of an open-end funds where investors can withdraw at any time (Stein J. C., 2005). The funds raised by these private equity funds are take usually the form of commitments given by the investors at the time of their subscription to the fund. These are mainly used to finance the acquisition of the target companies and to pay a management fee to the PE house (Kaplan, S.N. and Strömberg, P.J., 2009).From a legal point of view, PE funds are organized as limited partnerships where the investors, contributing most of the funds, are the limited partners (the “LPs”) and the PE house, managing the fund, is the general partner (the “GP”) (Metrick A., Yasuda A., 2010; Kaplan, S.N. and Strömberg, P.J., 2009 and Vernimmen P., Quiry P., Le Fur Y., 2016). Apart from providing the capital, the LPs have a very low influence over the decisions taken by the GP during the lifetime of the fund as long as the basic covenants of the limited partnership agreement are followed (Kaplan, S.N. and Strömberg, P.J., 2009 and Vernimmen P., Quiry P., Le Fur Y., 2016). Amongst the common covenants, there are concentration limitations, limits on the type of companies being acquired and guaranties in terms of indebtedness of the fund (Kaplan, S.N. and Strömberg, P.J., 2009).
Investors
Typically, LPs are pension funds, high net worth individuals, insurance companies, institutional investors and endowments (Metrick A., Yasuda A., 2010 and Kaplan, S.N. and Strömberg, P.J., 2009). As general partner of the fund, the private equity firm usually commit at least 1% of the total commitment. The lifetime of a fund is typically 10 years and the fund has usually up to 5 years to invest the money committed by investors into companies (Kaplan, S.N. and Strömberg, P.J., 2009).
Remuneration of PE houses
As compensation for managing the funds, PE houses are remunerated in three different ways by the limited partners (Kaplan, S.N. and Strömberg, P.J., 2009). This remuneration has fixed and variable components (Metrick A., Yasuda A., 2010):
- An annual management fee: which represents usually a percentage of capital employed, (Kaplan, S.N. and Strömberg, P.J., 2009).
- Carried interest: which give to PE firms the right to obtain a share of the profits, almost always 20%, of the fund above a defined rate of return, called the hurdle rate and usually set to 8% (Kaplan, S.N. and Strömberg, P.J., 2009).
- Deal and monitoring fees: these types of fees are sometimes requested to the companies under the control of that private equity house (Kaplan, S.N. and Strömberg, P.J., 2009).
To remain in business, most of the successful private equity houses raise a new fund every three to five years. In the case where the fund provides good returns, the limited partners gain confidence in the skills of the PE house and, as a result, the demand to invest in future new fund increases. To meet the demand, the PE has the possibility to increase their fees and keep the same size for the future funds or increase the size of the future fund. They may also combine these two possibilities (Metrick A., Yasuda A., 2010).
Economical characteristics of PE deals
It seems that the price paid by private equity firms to the sellers of the target companies is much lower than if the target company would be acquired by a public firm. The difference is on average 55% more. One explanation for this observation is a diluted ownership. Indeed, with a concentrate ownership, the management incentive to pay a lower price is much important than
in the case of diluted ownership (Bargeron L., Schlingemann F., Stulz R., and Zutter C., 2007)4. Typically, the private equity firms pay a premium of between 15% and 55% over the current stock price to acquire public companies and from 60% to 90% is financed by debt (Kaplan, S.N. and Strömberg, P.J., 2009). This debt financing it structured with both junior and senior debt. Institutional investors buy different senior debts, securitize them and sell them to other institutional investors. The junior debt is usually financed by high yield bond or mezzanine debt instruments (Kaplan, S.N. and Strömberg, P.J., 2009 and Vernimmen P., Quiry P., Le Fur Y., 2016). Thus, the remaining 40% to 10% is financed via equity injections using the money that was committed by the investors in the fund and via a participation of the management team of the target company (Kaplan, S.N. and Strömberg, P.J., 2009).
Private Equity activity seems to be cyclical and driven by the market conditions on both debt and stock market. Another important factor is also the recent returns offered by the the PE house on their other funds (Kaplan, S.N. and Strömberg, P.J., 2009 and Vernimmen P., Quiry P., Le Fur Y., 2016). In particular, the level of debt seems to be more dependent on the conditions offered by the credit market rather than the optimal level of leverage for the firm. The conditions on the debt market play a role in the cyclical activity of the private equity firms. When the interest rates are low, the trend is to increase their number of investments. Conversely, when the interest rates are relatively high, the trend is to reduce them (Kaplan, S.N. and Strömberg, P.J., 2009). Kaplan and Strömberg (2009) do also another observation. If the private equity firm performs well, the investors will be tempted to invest more capital in the next funds. However, the private equity funds seem to obtain a lower return when more capital is committed. As the future commitments are positively correlated with the return of the current
4 More detail about the difference of price when a company is bought by a private or a public company:
Bargeron L., Schlingemann F., Stulz R., and Zutter C. (2007). Why Do Private Acquirers Pay So Little Compared to Public Acquirers? NBER Working Paper No. 13061.
private equity funds, this is high likely that investors will invest less capital in the future funds because lower return would be achieved on funds with higher commitments. This pattern supports the boom and bust cycle that could be observed in private equity (Kaplan, S.N. and Strömberg, P.J., 2009).
Exit strategies
A private equity fund has a limited lifetime. This characteristic is an important point to consider for the exit strategy of the investments owned and is fully part of the private equity process. When a PE fund acquires a target company, it needs to think ahead about the exit strategy. As explained in the leveraged buyout part, the most common exit options are the strategic buyer, a secondary leveraged buyout and the IPO (Kaplan, S.N. and Strömberg, P.J., 2009 and Vernimmen P., Quiry P., Le Fur Y., 2016). Following Kaplan and Strömberg (2009), the most common exit option is to sell the company to a strategic buyer and represents on average 38% of the exits. On second position, with 24% of the cases on average but becoming more important over time, the fund is exiting the position to the benefit of another private equity fund. In third position comes the IPOs representing 14% of the exits but being even less used over time (Kaplan, S.N. and Strömberg, P.J., 2009). Further to a report of Bain & Company5, this ranking (with different percentage) remains the same in 2016 but confirming however the increasing part of strategic buyers against the decreasing numbers of IPOs, leaving the sponsor-to-sponsor in-between. On the sample used by Kaplan and Strömberg (2009), only 6% of the companies went to bankruptcy, mainly driven by high level of indebtedness. The authors however warn that is perhaps not representative of the real situation. Indeed, they have a remaining portion of 11% for “unknown” exits. In this portion, some of these cases may be
hidden. Moreover, that could support the 23% of default obtained by Andrade and Kaplan (1998) (Kaplan, S.N. and Strömberg, P.J., 2009 and Andrade G. and Kaplan S. N., 1998).
On average, the holding period is 6 years for the private equity firms but this holding period can vary and recently, it is observed that some private equity funds have a more short-term vision. However, a holding period of less than two years represents only 12% of the existing cases observed (Kaplan, S.N. and Strömberg, P.J., 2009). Following a Bain Company report5, the median holding period in 2016 was 5.6 years.
Factors of value creation brought by PE houses
Some authors argue that the characteristics and the structure put in place by the PE firms create operational and economic value (Jensen M.C., 1989). However, other authors don’t believe in this operational value creation. They argue that the private equity firms take advantage of tax breaks, reduction of asymmetric information, market timing and mispricing but don’t create operational value (Kaplan, S.N. and Strömberg, P.J., 2009).
Kaplan and Strömberg (2009) identify three major areas of change that private equity firms operate when they acquire a company: financial, governance and operational engineering (Kaplan, S.N. and Strömberg, P.J., 2009). To align the interests of the management and the LBO funds (one of the most common principal-agent problem), the funds often ask to the managers to invest their own money or to borrow money to invest into the company alongside the funds. These management incentives are an important characteristic of the changes that private equity firms implemented in the companies they acquired. Thanks to options, convertibles bonds and stocks, the fund give incentives to the manager which can lead to a leverage effect on their investment. That enables to share a part of the capital gain with the managers (Jensen M.C., Murphy K., 1990; Kaplan, S.N. and Strömberg, P.J., 2009 and Vernimmen P., Quiry P., Le Fur Y., 2016). This practice is unusually observed amongst the public companies. This happened to be however a powerful incentive tool to reward the
performance of the management team and, by consequence, to reduce the conflict of interests that could exist between the management and the fund (Jensen M.C., Murphy K., 1990). Moreover, since the company is private, the management is also exposed to the illiquidity of their stakes. These two exposures reduce the risk of manipulation on the short-term performance and stimulate the management team to adapt a longer-term view to generate sufficient cash-flows and sustainable performance (Kaplan, S.N. and Strömberg, P.J., 2009).
Another conflict of interests between the management and the fund is the waste of money. Thanks to the leveraged operation, the debt reduces the discretionary use of cash available by the management thus decreasing the risk of using the cash flows in an inefficient way for the shareholders (Jensen M., 1986 and Kaplan, S.N. and Strömberg, P.J., 2009). Since the level of indebtedness is high, the managers have a lot of pressure to generate liquidities in order to face the repayment of the debt. This is an additional incentive to have a more efficient organisation (Jensen M., 1986 and Vernimmen P., Quiry P., Le Fur Y., 2016). Although some authors sustain the idea that leverage allows for value creation thanks to the tax shield (tax deductibility of interests) (Kaplan S., 1989), the high level of indebtedness increases the cost of bankruptcy. Therefore, the benefit of the debt from a tax point of view can be greatly reduced by the financial distress costs (Kaplan, S.N. and Strömberg, P.J., 2009 and Vernimmen P., Quiry P., Le Fur Y., 2016).
Regarding the corporate governance, private equity funds take much more part into the governance of their portfolio companies compared to what could be observed in a public company. It could be also observed that the size of the boards is usually reduced and the frequency of the meetings are more important (Cornelli F., Karakas O., 2008; Kaplan, S.N. and Strömberg, P.J., 2009 and Acharya V. V., Gottschalg O. F., Hahn M., Kehoe C., 2013). However, the reduction in size of the board when the public company becomes private will depend on the complexity, the size, the challenges and the difficulties of the target company.
When the management performance is below the expectations of the PE house, the latter doesn’t hesitate to replace the under-efficient managers (Cornelli F., Karakas O., 2008)6.
When it comes to the operating performance, there are several empirical evidences showing that companies increase their operating performance while being owned by PE funds. For example, in the eighties, the American public-to-private deals showed an increase by 10% to 20% of their ratio “operating income over sales”, an increase of the ratio “cash flow over sales” by 40% and a diminution of the ratio “capex over sales” (Kaplan, 19897 cited by Kaplan, S.N. and Strömberg, P.J., 2009). This point would be more detailed later on in this document, highlighting the relation between the governance and the operating performance of the companies owned by private equity funds.
The leveraged buyout gives the possibility to benefit from an important tax shield. Following Kaplan (1989), 4% to 40% of the value creation could be explained by the tax deductibility of the interest. The tax savings will depend on the tax allowances available and the tax rate where the target company is located. A good average could be between 10% and 20%. However, it is difficult to estimate exactly the impact of the tax deductions because they are depending on the parameters that can change over time (Kaplan, 1989 and Kaplan, S.N. and Strömberg, P.J., 2009).
Another fact that could explain the operating improvements and value creation is the question of asymmetric information. Because of the alignment of interests between the PE house and the management, the management could be tempted to share specific information with the buying candidate in order to enhance the return for the PE house with the view of
6For a more statistical analysis of the evolution of boards when a public company is taken by a private
equity firm, interesting article: Cornelli F., Karakas O. (2008). Private Equity and Corporate
Governance: Do LBOs Have More Effective Boards?. Online on the SSRN website: https://papers.ssrn.com/sol3/papers.cfm?abstract_id=1102467&download=yes
7 Kaplan S. N. (1989). The Effects of Management Buyouts on Operating Performance and Value.
getting good compensations for performance and/or keeping their own jobs. This will bring the PE house is a favourable negotiating position as opposed to the shareholders while discussing the price of the transaction. (Kaplan, S.N. and Strömberg, P.J., 2009). However, this could not be the only explanation of the operating improvements and value creation. The performance of the companies is often below the forecasts (Kaplan, 19897 cited by Kaplan, S.N. and Strömberg, P.J., 2009) and therefore the PE will, in many instance, replace the chief executive officer when taking over the target company and to renew the management team to boost the performance (Cornelli F., Karakas O., 2008). This means that the above discussed incentive for the management to keep their job is uncertain and that the new management team is probably part of the improvement of the performance, thus giving another reliable explanation for value creation. The boom and bust cycles of the private equity industry is most likely a key factor to justify the low performance of some PE funds which can be however mitigated by accessing privileged information (Kaplan, S.N. and Strömberg, P.J., 2009). Nonetheless, the access to an inside information is not the only reason of good performance but may well be due to their strong negotiation skills and to some good opportunities to benefit from market timing and mispricing (Kaplan, S.N. and Strömberg, P.J., 2009).
Methodology and limitations
Private Equity houses are not much inclined to communicate information about their portfolio companies, performance, funds, investment strategies, etc. with the public. However, after discussions with EQT, they allowed me to gain access to a limited source of information under some confidentiality conditions. The research aims for analysing the investment strategy and its value creation process as a competitive advantage or not. Moreover, they should enable to understand how a private equity house can create value. To pursue this objective, EQT asked me to analyse its general investment strategy, corporate governance model and illustrate by their EEW investment realized in their EQT Infrastructure II fund.
The results of this qualitative research are consequently limited and restricted to my EQT data limited access and to informal discussions. Also, the requirements given to write this work project is another limitation on the number of portfolio companies being analysed. However, it is still a good starting point to understand the strategy and the corporate governance model of EQT and to also understand their process of value creation. Subsequently, the conclusion may drive the need to perform a deeper analysis about EQT and how EQT is creating value on the basis of a lager sample of investments to support the conclusions drawn at the end of the document.
EQT
“Having a long-term, responsible and sustainable approach to ownership is EQT's way of creating value, for investors, in portfolio companies and society at large” (EQT 2017). About EQT. Online on the EQT website: http://www.eqt.se/About-EQT/).
EQT is a Swedish private equity firm, founded in 1994 by together Conni Jonsson, Investor AB, AEA Investors (private equity group based in United States) and SEB8. Its mission is to invest “[…] in good companies across the world with a mission to help them develop into great and sustainable companies. EQT has three overall investment strategies - Private Capital (including Ventures, Mid Market, Equity) Real Assets (including Infrastructure and Real Estate) and Credit – guided by a responsible ownership approach and an industrial growth strategy” (EQT AB (2017). Fast facts. Online on the EQT website: http://www.eqt.se/About-EQT/Fast-facts/). The firm is part of the Wallenberg network9. With around 290 investments advisors on a total of around 480 employees, EQT is present in 14 countries in Europe, North America and Asia. Beside their employees, they have a network of around 250 industrial advisors. Through 22 funds raised since 1995 for a total of EUR 35 billion, EQT has invested in around 170 companies and existed from around 84 of them. Besides to be invested in Private Capital, the funds raised are also invested in Real Assets and Credit. Among their investors, 400 are institutional investors9.
The EQT portfolio companies generates around EUR 19 billion in total sales thanks to 110 000 employees. On average, the results obtain by a company during the ownership by an EQT fund are: an annual sales growth of 10%, annual earnings growth (EBITDA) by 11% and9 the number of employees increases by 9%. EQT invest only in companies, areas and regions where they know that they have the necessary expertise to be able to implement a sustainable
growth and development strategy. This is possible because the knowledge of EQT in strategic business development, structural change and financial analysis but also thanks to its industrial network. EQT claims to be a catalyst for the companies they acquired by helping them to make changes, transformation and permanent improvements in a purpose to make9 “great and sustainable companies” (EQT AB (2017). Fast facts. Online on the EQT website:
http://www.eqt.se/About-EQT/Fast-facts/ ).
Business model
As explained above, the goal of EQT is to acquire companies, to help them to develop, to be great and sustainable companies, not only during the EQT ownership but also after, for the future owners. The implementation of the strategies is done with the collaboration of the CEO and board members who are often issue from the Industrial Advisors network of EQT. They are monitored by the investment advisors10.
The main drivers for value creation by EQT are development and growth. To achieve its objectives, EQT put in place several strategies10 such as “[…] geographic expansion, new
products, acquisitions and strategic re-orientation.” (EQT AB (2017). Business model. Online
on the EQT website: http://www.eqt.se/About-EQT/Business-Model/). The essential of the returns are due to theses operational improvements10.
To develop the business and to achieve the objectives, a consensus about the strategy as well as a total collaboration between the management and the board of directors is fundamental. It’s the key of the success. When a company is acquired by EQT, the first thing that they do is to appoint a board of directors which is going to implement the model of corporate governance of EQT. According to the situation, the management could be also reinforced11.
10 EQT AB (2017). Business model. Online on the EQT website:
http://www.eqt.se/About-EQT/Business-Model/
11 EQT AB (2017). Growth and development strategy. Online on the EQT website:
The value creation process is guided by the strategy put in place and there is a closely monitoring of the improvements. Typically, the strategic plan includes11:
- Sales Growth: To achieve their objectives in market growth, EQT uses usually the market and product expansion, as well as the internationalization and bolt-on acquisitions that consists to acquire step-by-step competitors or other firms that could enable economies of scale but also improve the efficient the company11.
- Operational Excellence: thanks to the access to the industrial expertise of EQT, the management receives a precious help to improve the results11. Moreover, when EQT acquires a company, they want that this company becomes “[…] best-in-class in such areas as production, customer relations and service” (EQT AB (2017). Growth and development strategy. Online on the EQT website: http://www.eqt.se/About-EQT/Business-Model/Growth-and-Development-Strategy/).
- Strategic Repositioning: The strategic repositioning consists in put in place a base which enables a rapid development. That goes through some divesting to focus on the core business but also investments in new technologies and using the changes in the industry11.
- Optimizing Capital Structure: The optimization of the capital structure is possible thanks to the financial expertise of EQT. This optimization is realized with a long-term vision, in order that the company be ready for the future new owner after EQT11. EQT has a long-term vision for their investments. They sell the company once they have achieved their objectives for the development of the company. In general, the holding time is between 4 and 8 years with an average of 4.8 years. To exit their positions, EQT uses essentially the 3 usually ways being used by private equity funds. Up to 31 December 2015 they used12:
- Trade sale (= purchase by a strategic or industrial buyer) represents 46%12 - Secondary Buyout represents 33%12
- Initial Public Offering (IPO) represents 17%12 - Others represents 4%12
These figures show that EQT exists from its position essentially by the trade sale followed by the secondary buyout and finally by the initial public offering12.
EQT invests in sectors that they find attractive to put in place a strategy for generating long-term value. These sectors are essentially the sectors of 13“[…] Healthcare, TMT, Services, Consumer Goods, Industrials and Energy & Environmental” (EQT AB (2017). Investment
characteristics. Online on the EQT website: http://www.eqt.se/About-EQT/Business-Model/Investment-Characteristics/). The sources of EQT investments are corporate for 35%, private/family firms for 30% and secondary buyout for 19%. Together, these 3 sources represent 84% of the EQT investments. The 16% remaining are composed of public for 10%13, privatization/government for 2%, management buyout for 1% and other for 3%. These statistics are for transactions closed by December 31, 2015. EQT mainly invests in Nordic region for 58%, Deutschland, Austria and Switzerland (DACH) for 25%. Together they both represent 83%. The 17% remaining are the Greater China for 7%, North America for 4%, rest of Europe for 3%, Central and Eastern Europe for 1%, Southeast Asia for 1% and rest of the world for 1%. These statistics are for transactions closed by December 31, 2015. The size of the investments realized by EQT are split as follows: 23% of the investments are between 100€ and 200€ million, 19% between 50€ and 100€ million, 18% between 30€ and 50€ million, 15% between 200€ and 500€ million, 14% between 15€ and 30€ million, 8% lower than 15€ million and only 3% higher than 500€ million. Finally, if we look at the investments by industry, EQT
13 EQT AB (2017). Investment characteristics. Online on the EQT website:
invest essentially in industrial and consumer goods. Both represent 48% of the investments with 25% for industrial and 23% for consumer goods. After comes the TMT industry with 16% of the investments and healthcare industry with 15%. Services industry represents 9% and the energy & environmental industry 7%. At the end come the transport & offshore for 4% and financial industry for 1%. These statistics are for transactions closed by December 31, 201513.
The industrial advisors network of EQT is one of their key competitive advantages. Around 250 independent industrial advisors form the industrial network of EQT. They come from different industry and region around the world and they bring an expertise that is an important plus value for the companies. The industrial advisors play a paramount role in the board of directors appointed by EQT and as consultant in investment decisions. They are going to accompany for the implementation of the strategy designed by EQT and to help the companies during the transformation and improvement process. Moreover, these industrial advisors are members of the EQT industrial network14 for many years. Some of them played a CEO role in old portfolio companies held by EQT. So, in addition to their expertise, they have also acquired experience to help companies to growth with the EQT corporate governance model in place. Several meetings are organized by EQT to ensure the knowledge is shared and professional development for the industrial advisors but also to ensure that everybody works together following the objectives of EQT. There is an on-going evaluation of the industrial advisors and new advisors are added when necessary to make sure that the industrial network has all the necessary expertise to complete successfully the strategies14.
When EQT acquired a company, they appoint a board of directors composed of several independent industrial advisors, whose one of them is usually the chairman, and of an investment advisory partner. Together, they decide of the strategic plans to put in place and
14
http://www.eqt.se/About-they control their applications. They make sure that the management team has all the necessary resources and help to manage the company in a good way to apply the strategic plans. The CEO is appointed by the board. This board is relatively small and its structure as well as its composition is adapted in function of the particular needs of the company. A small board would ensure a strong commitment of the board and the decisions can be taken more rapidly. In order to align interests of the board and the target company, EQT requests to the board and the senior management to invest into the company. Altogether, the board, EQT and the management team develop a business plan and a shared agenda to have a common state of mind and the clearest transparency as possible. Another characteristic that is specific to EQT is the Troika15. The Troika is an integral part of the corporate governance model that EQT implements in the companies that they acquire. The Troika is formed by the CEO of the company, the Chairman being and industrial advisor and the EQT partner in charge of the deal. The Troika is a non-decision organ, its function is to challenge the CEO thanks to the expertise of the different members and to work together to achieve the same objective which is to have a company stronger, sustainable which will be able to continue to succeed even after that EQT sells the company. Finally, a continuous performance evaluation of the CEO, Chairman, Board of Directors and Investment Advisory Professional is realized once a year. This evaluation is fundamental to assess the performance but also to identify the needs of resources or expertise to achieve the goals of the strategy and to verify the adequacy with values of EQT. The results of the annual evaluation can have as consequences an evolution and modification of the board composition to assure the good evolution of the company in line with the objectives and philosophy of EQT15.
15
EQT AB (2017). Corporate governance model. Online on the EQT website:
More than 400 investors invest into EQT funds. 28% are financial investors, 26% are Pensions or Sovereign Wealth Funds, 24% are Fund-of-Funds and Gatekeepers and the 22% remaining are Endowments, Foundations and Family Offices. The family offices are important for EQT, not only as investors but also for their participations to the Industrial Advisors Network. It is also interesting to mention that Investor AB is an industrial holding company and sponsor of EQT since inception. It invests in all the funds for a participation of around about 10% in each. The investors come from around the world with 38% from the rest of Europe, 26% from Nordic, 25% from North America, 7% from Asia Pacific and 4% from the rest of the world16. The relationship with the investors is important for EQT which wants to maintain a close relationship with them. For this purpose, they communicate in a transparent way and provide them with precise information. Moreover, once a year, EQT organise the EQT Annual Investor’s Meeting where CEOs, investors, Industrial Advisors, Investment Advisory Professionals are gathered to discuss in details of the different EQT funds but also to give to investors a full information about the market situation and outlook for each portfolio company16.
E.ON Energy from Waste - EEW
In March 2013, EQT acquired 51% of EEW – E.On Energy from Waste shares via its fund EQT Infrastructure II further to a strategic decision of E.ON to sell their stakes in E.ON EEW branch. In April 2015, E.On further decided to sell their remaining shares to EQT resulting in handing over the whole ownership to EQT. EQT Infrastructure II fund was launched in 2013, currently active and whose capital committed is EUR 1.938 billion.
EEW is the market leader in energy from waste in Germany, its main geographic focus, and operates also in the Netherlands and in Luxembourg. The headquarters are located in Helmstedt, in Germany. At that time, the company employs around 1284 people and operates through eighteen plants. EEW produces several types of energies from waste: electricity, process stream for industrial use and district heating. Thanks to its high technological plants, always at the top of the new technologies, EEW is one of the leaders of its sector. Its plants can treat around 5 million tons of waste making EEW a major actor in the development of sustainable economy in Europe. Locally, they play also an important role with its six TWh of production in energy. In 2014, EUR 539 million sales were realized by the EEW activities17.
EQT Infrastructure II played an important role in the growth and development of EEW through strategic acquisitions, through a reinforcement of the management team and its corporate governance structure. Among the strategic acquisitions, EEW acquired IHKW Andernach, an incinerator of captive waste, in June 2014. In September 2015, EEW acquired NHKW Stavenhagen, a captive Energy from Waste, located in in the North-East of Germany. This firm had a contract with Unilever for the supply of steam required to ensure good operations of one of their food transformation factory17. Thanks to EQT, EEW has become an
17 EQT AB (2017). EEW Energy from Waste. Online on the EQT website:
efficient firm with a long-term vision but also solutions for the management and transformations of waste17.
The most important changes during the EQT ownership are, first of all, the implementation of the Troika introducing of their Industrial Advisors. In this case at hand, it went along with the appointment of a new CEO, COO and CFO as well as a reinforcement of the management team in place. Altogether, they improved the cost structure, the operational model and increased the plant utilisation, by example, in increasing amount of waste treated using importation as a secondary source of waste or by reinforcing the sales force17.
As already mentioned, shortly after the acquisition by EQT Infrastructure II, a new CEO, Bernard Kemper, was appointed in 2014. Bernard Kemper was a member of the Board since 2013. With an education in Political Science and Law studies, he has a previous experience in energy and waste sector with RWE and Sulo. The new CFO appointed in 2013 was Markus Hauck. He holds a master degree in Business Administration and has a previous experience in the industrial sector at Holcim. Finally, the new COO was Karl Heinz Müller and was appointed in 2013. Like Markus Hauck, he has also an experience in this industry at Alcoa and he is trained in physics. The Chairman of the Board implemented by EQT is Jürgen Rauen, the Industrial Advisor. Jürgen has a previous experience at Sulo and Veolia, two actors in the waste management sector.
The EEW project represented around 9% of the committed capital in EQT Infrastructure II (EUR 1.938 billion) which is equivalent to an investment of around EUR 171 million in equity.
EQT decided to invest and to acquire EEW for several reasons. First of all, EEW is positioned as a market leader in Germany on the waste incineration market. The company stands out by its exceptional technical asset quality and its secured, strong cash flow generation through long term contracts with municipal and industrial customers. Thanks to its economies
of scale but also its excellent mastery in waste flow management, EEW can easily and successfully renew its contracts with its actual partners. EEW constitutes also an entry point for growth opportunities in the greenfield and brownfield.
Table 3 : key performance indicators18
During the ownership of EEW by EQT, the sales increased by around 10% between 2013 and 2015 with an increase of about 5% per year. The net debt decreased by 14% between 2013 and 2014 and increased by 21.64% between 2014 and 2015. This increase is due to the purchasing of the 49% remaining by EQT from E.ON in 2015. The Net Debt / EBITDA ratio was respectively 2.75 in 2013, 2.20 in 2014 and 2.43 in 2015. An important point to highlight is that, despite a more important Net Debt amount in 2015 compared to 2013, the ratio Net Debt / EBITDA decreased. the EBITDA between 2013 and 2015 increased by 18.24% with an increase of 7.65% over the financial period 2014 and of 9.83% for financial year 2015. The ratio
EBITDA / Sales is 33% in 2013, 34% in 2014 and 36% in 2015 which means an increase of the ratio by 3% over the period from 2013 to 2015. Now, if we consider the pro forma
18 Source: internal report dated 31 March 2016 (strictly private and confidential) – Original documents
are available in the appendices
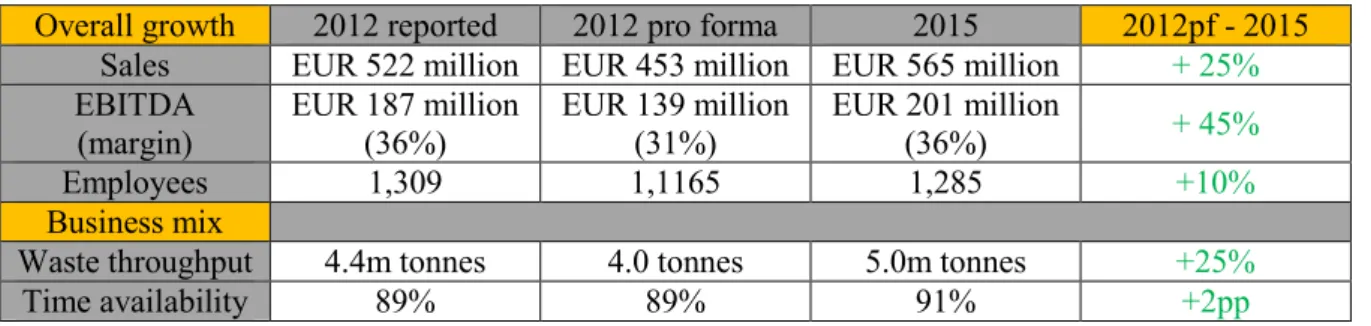
Overall growth 2012 reported 2012 pro forma 2015 2012pf - 2015
Sales EUR 522 million EUR 453 million EUR 565 million + 25%
EBITDA (margin) EUR 187 million (36%) EUR 139 million (31%) EUR 201 million (36%) + 45% Employees 1,309 1,1165 1,285 +10% Business mix
Waste throughput 4.4m tonnes 4.0 tonnes 5.0m tonnes +25%
Time availability 89% 89% 91% +2pp
• EEW is the market leading Energy-from-Waste company in Germany, also active in Luxembourg and the Netherlands
• With 1,050 employees the company operates 18 Energy-from-Waste plants and produces electricity, district heating and process steam for industrial use
• The plants are modern facilities with state-of-the-art technology, frequently updated to meet the latest technological standards • EEW operates an installed waste capacity of around 4.7 million tonnes
making an important contribution to European sustainable economy and playing a vital part in the local energy infrastructure, producing in total 6 TWh of energy
Leading Energy-from-Waste service provider in Germany
EEW Energy from Waste – Company Overview (1/4)
Company overview
Investment rationale
Historical financial development
Geographical & segment sales split
2% 8% 90% EUR 565m 3% 26% 16% 55% EUR 565m
• Leading market position in the German waste incineration market • Exceptional technical asset quality
• Secured, strong cash flow generation through long term contracts with municipal and industrial customers
• Strong position to successfully renew contracts due to economies of scale and waste flow management capabilities
• Platform to approach greenfield and brownfield growth opportunities
O&M Waste management The Netherlands Germany 33% 34% 36% 565 539 514 489 402 468 201 183 170 EUR m 2014 2015 2013 EBITDA % Sales Net Debt EBITDA
Table 4 : historical financial development18
figures19 the sales increases by 25% between 2012 and 2015 and the EBITDA increases by 45%. For the same period, the number of employees increased by 10% with 1165 employees in 2012 and 1284 employees in 2015. The waste throughput rose from 4.4m tons in 2012 (4.0m tons in 2012 pro forma figures) to 5.0m tonnes in 2015, which means an increase of 25%.
In 2015, 90% of sales were generated from the German market, 8% from the Dutch market and only 2% from the Luxembourgish market. The
sales were segmented in Waste management for 55%, Energy for 26%, 16% for O&M and 3% for other.
The transaction occurred between December 2012 and March 2013. The enterprise value of EEW at the time of the acquisition was EUR 1,170m with a ratio EV / EBITDA of 6.3, Senior Debt / EBITDA of 2.9 and Debt / Equity of 78%. The process of selling EEW was highly competitive. During an auction, three potential buyers bided to acquire the company. The winner of the auction was a Chinese municipal government owned conglomerate Beijing Enterprises Holdings that acquires
EEW back in February 2016. The enterprise value given by internal documents was then EUR 2,032m. However, the enterprise value given by the multiple method with a ratio EV / EBITDA of 10.9 gave EUR 2,190.9m. The gross IRR was 81% and gross MOIC was 6.3 which means a return of 1,077.3m considering an initial investment of EUR 171m.
During the ownership of EQT, several initiatives were taken to create value. Relating to the operational improvements, key operational KPIs (Key Performance Indicators) were improved such as the availability and the cost per ton but also, the centralization and internal
19 2012 pro forma figures are adjusted for certain operations assumed to close down at the time of
benchmarking. An effective market approach was developed through new sales structure and systems. Assets transformations also occurred with successful carve-out, an improvement of the risk profile, sales centralization and changes in customer approach. The successful carve-out and improvement of the risk profile have allowed for a strategic repositioning. Moreover, two new plants acquisitions are realized during this period which played a role in the overall growth realized by EEW. The organic growth was assured through an improvement of the supply/demand situation in Germany and a stronger market positioning. Also, two plants should have initially closed. However, the implementation of a profitable business model enabled to save these two plants.
The analysis of the value creation sources shows that 63% of the value creation is due to the strategic repositioning of EEW, 29% is explained by the leverage effect. The sales growth represents 8% of the value creation. Nevertheless, the margin expansion is as decrease of 1% percent.
Analysis
Even though EQT is using the standard tools of a classical private equity houses to enhance the return for investors, EQT distinguishes itself by its philosophy, politic and strategy of investments. It does not limit itself to a classic value creation process only using leveraged buyout transactions and incentive mechanisms for the management but the business model of EQT is based on a value creation by investing in companies which have a potential to be developed and sustainable growth. The success of the investment strategy and business model of EQT are the proof that in a market more and more competitive, it is necessary to identify other sources of value creation, as mentioned by Braun M. R., Latham S. F. (2007). The outcome for EQT is to be a company in full expansion that reinforces its position and becomes a major actor on the private equity market as they just ranks at the 10th position of the PEI 300 ranking in 201620. Moreover, their industrial approach encourages even sellers to negotiate with EQT instead of other private equity house such as Top Toy or Nordic Aviation Capital, EQT said.
The business model of EQT is totally based on a collaboration between the different parties: management team, CEO and the Troika. Together, they build up a strategic plan to ensure everybody is working towards the same objectives for the company. In addition to the obligation of the management to invest in the company, setting up a common vision for the future of the company enables to reduce the risk of conflicts of interest and so, the principal-agent problem.
Moreover, EQT is strongly involved in the management of the companies that they acquire. When EQT acquires a company, the first thing they do is the implementation of a Board of Directors whose chairman is an industrial advisor from the EQT industrial advisors network
this assures a total independency of the board as the Chairman and the CEO function are not hold by the same person. This phenomenon is often observed in USA. There is also the presence of an investment advisory partner from EQT. Together with the CEO, this tripartite forms the so-called Troika. This model of corporate governance applied to each company in the portfolio of EQT and its strong industrial advisors network is the characteristic and the competitive advantage of that private equity house. It ensures a very close monitoring and an alignment of the interests but also an access to all the essential resources to pursue the strategic plan and achieve the objectives. Indeed, the presence of the industrial advisors bring to the acquired company the necessary competences and is in agreement with Acharya V. V., Gottschalg O. F., Hahn M., Kehoe C. (2013). The results of this governance policy is a great success of EQT investments and also, the sustain development and growth of the companies even after the EQT ownership. EQT corporate governance model confirms the propositions of Braun M.R., Latham S.F. (2007) and Cumming D., Walz U. (2010) that a good structure can be a source of success in buyouts operations. However, Cornelli F., Karakas O. (2008) mentions that the active implication of the PE in the management of the firm is costly and limited because the PE houses involve their employees. EQT seems to get around the problem thanks to is industrial advisors network. EQT developed during long years a strong and trustful relationship with their industrial advisors. They are an integral part of EQT on who EQT can trust and base its strategy due to their long collaboration. This allows to reduce a lot the implication of the direct employees of EQT. Moreover, the cost remains the same that if EQT hire outside directors.
EEW was analysed to illustrate the value creation process of an EQT fund. A part of this successful investment can be attributed to a highly competitive auction between tree potential buyers which, to a certain extent, was the consequence the implementation of the strategy and corporate governance model of EQT. This strong interest from the bidder was not only driven by the value created throughout the EQT ownership but mainly because this value
was created with a long term and sustainable vision which can be further carried out by the new owner.
First of all, the Board was implemented and a strategic plan defined. Together, the CEO, the Board of Directors and the Troika identified tree pillars as value creation sources. Theses tree axes are the growth in sales, operational improvements and strategic repositioning to achieve sustainable growth. Throughout them EEW could assure a strong and sustainable growth. The analysis of the creation value sources showed that only 29% of the value creation was due to the levered effect. This result is below of the result obtain by Achleitner A.-K., Braun R., Engel N., Figge C., Tappeiner F. (2010) who supported that 33% of value creation is due to the levered effect. The essential of the value creation source (63%) was due to the strategic repositioning. This example illustrates very well the way EQT works and creates long term and sustainable value for the firms they acquire through their funds. The financial engineering is not central point of the value creation process, but is rather a way to be able to boost the return for the investors. They focus essentially on a development and sustainable growth thanks to the corporate governance model that they implement and their own expertise through their industrial advisor network. This expertise was brought by the appointment of a new CEO, COO, CFO and industrial advisor. All of them have a former experience in the industry, energy, waste sector. In particular, Jürgen Rauen, the industrial advisor appointed by EQT, has a previous experience at Sulo and Veolia, two actors in the waste management sector. Thanks to their expertise they were able to understand the market, identify the challenges and be able to capture the opportunities.
As we discussed in the chapter related to value creation, the deal partner who has a specific background in the industry is able to take key decision to improve the firm internally while the partner that has more of a financial background will be key in restructuring the companies. Through the Troika model, EQT has found a way to take advantage of both