EUROPEAN ORGANIZATION FOR NUCLEAR RESEARCH (CERN)
CERN-PH-EP/2013-037 2014/10/23
CMS-HIG-13-001
Observation of the diphoton decay of the Higgs boson and
measurement of its properties
The CMS Collaboration
∗Abstract
Observation of the diphoton decay mode of the recently discovered Higgs boson and measurement of some of its properties are reported. The analysis uses the en-tire dataset collected by the CMS experiment in proton-proton collisions during the 2011 and 2012 LHC running periods. The data samples correspond to integrated lu-minosities of 5.1 fb−1at√s =7 TeV and 19.7 fb−1 at 8 TeV. A clear signal is observed in the diphoton channel at a mass close to 125 GeV with a local significance of 5.7 σ, where a significance of 5.2 σ is expected for the standard model Higgs boson. The mass is measured to be 124.70±0.34 GeV=124.70±0.31 (stat)±0.15 (syst) GeV, and the best-fit signal strength relative to the standard model prediction is 1.14+0.26−0.23 =
1.14±0.21 (stat)+−0.050.09(syst) +−0.090.13(theo). Additional measurements include the signal strength modifiers associated with different production mechanisms, and hypothesis tests between spin-0 and spin-2 models.
Published in the European Physical Journal C as doi:10.1140/epjc/s10052-014-3076-z.
c
2014 CERN for the benefit of the CMS Collaboration. CC-BY-3.0 license
∗See Appendix A for the list of collaboration members
1
1
Introduction
In 2012 the ATLAS and CMS Collaborations announced the observation [1, 2] of a new bo-son with a mass, mH, of about 125 GeV and properties consistent, within uncertainties, with
expectations for a standard model (SM) Higgs boson. The Higgs boson is the particle pre-dicted to exist as a consequence of the spontaneous symmetry breaking mechanism acting in the electroweak sector of the SM [3–5]. This mechanism was first suggested nearly fifty years ago [6–11], and introduces a complex scalar field, which also gives masses to the fundamental fermions through a Yukawa interaction. Results using the full available dataset have recently been published by CMS [12–19], and by ATLAS [20–25].
The diphoton decay channel provides a clean final-state topology that allows the mass of the decaying object to be reconstructed with high precision. Having in mind the discovery of a low mass Higgs boson in the diphoton channel, the electromagnetic calorimeter performance was a design priority for CMS. The diphoton decay is mediated by loop diagrams containing charged particles. The top quark loop and the W boson loop diagrams dominate the decay amplitude, though they contribute with opposite sign. The branching fraction is small, reaches a maximum value of 0.23% at mH =125 GeV and falls steeply to values less than 0.1% above 150 GeV [26].
As a consequence the search reported in this paper is limited to the mass range, 110 < mH <
150 GeV. Despite the small branching fraction and the presence of a large diphoton continuum background, the diphoton decay mode provides an expected signal significance for the 125 GeV SM Higgs boson that is one of the highest among all the decay modes.
This paper presents the analysis performed on the full dataset collected in 2011 and 2012, recon-structed with the final detector calibration values, in pp collisions at the Large Hadron Collider (LHC), with an integrated luminosity of 5.1 fb−1at a centof-mass energy of 7 TeV (herein re-ferred to as the “7 TeV dataset”) and 19.7 fb−1at 8 TeV (“8 TeV dataset”). The results supersede those previously reported by CMS for this decay mode [27, 28].
The primary production mechanism of the Higgs boson at the LHC is gluon-gluon fusion (ggH) [29] with additional smaller contributions from vector boson fusion (VBF) [30] and pro-duction in association with a W or Z boson (VH) [31] or a tt pair (ttH) [32, 33]. Events from specific production mechanisms are identified and classified by the presence of additional ob-jects in the final state. Requiring the presence of two forward jets, in addition to the photon pair, favours events produced by the VBF mechanism, while event classes designed to preferentially select VH or ttH production require the presence of muons, electrons, missing transverse en-ergy from neutrinos, or jets arising from the hadronization of b quarks. To achieve the best sensitivity, the remaining events, and also the dijet events selected as having a VBF signature, are further separated using multivariate classifiers that provide measures of their probability to be signal rather than background. The signal is measured performing a simultaneous fit to the diphoton invariant mass distributions in the various event classes. The signal model is derived from simulation, while the background is obtained from the fit to data. A very large sample of events is available in which a Z boson decays to a pair of electrons; treating the electron showers in these events as if they were from photons allows precise and detailed knowledge to be obtained concerning the accuracy of the simulation of the signal, specifically the simulation of the energy reconstruction and selection of photons, and the simulation of the selection and classification of diphoton events.
With respect to analyses of this decay mode previously reported by CMS there are refinements in methodology, which are described in the main body of the paper. In addition, the analysis uses an improved intercalibration of the electromagnetic calorimeter channels and an improved energy regression algorithm to correct the clustered energy, resulting in better energy
resolu-2 2 CMS detector
tion. The simulation of the signal and Z boson samples is also improved. The changes in the energy-equivalent noise in the electromagnetic calorimeter during the data-taking period are simulated, and a significantly increased time window is used to simulate the effect of deposited energy coming from interactions in earlier bunch crossings.
The paper is organized as follows. After a brief description of the CMS detector and event re-construction in Section 2 and of the data and simulated samples in Section 3, the rere-construction and identification of photons is detailed in Section 4. The issue of identifying the diphoton vertex is covered in Section 5. In Section 6 the event classification is described. The section first describes the construction of a multivariate event classifier which takes as input quantities associated with the two photons, and then goes on to describe the tagging of events by the presence of objects in the final state, in addition to the photon pair, that give the event a signa-ture characteristic of one of the production processes. It concludes by detailing the use of two multivariate event classifiers to additionally subdivide into classes both the untagged events, and the events tagged as coming from the VBF process. Sections 7 and 8 describe, respec-tively, the signal and background models used in the statistical procedures which provide the results of the analysis, and Section 9 discusses the systematic uncertainties taken into account in those procedures. Section 10 outlines three alternative analyses that use specific variations of methodology that provide corroboration of particular aspects of the main analysis. Finally, in Section 11 the results of the measurements of the Higgs boson production and its properties are presented and discussed.
2
CMS detector
The central feature of the CMS apparatus is a superconducting solenoid, 13 m in length and with an inner diameter of 6 m, which provides an axial magnetic field of 3.8 T. The bore of the solenoid is instrumented with both the central tracker and the calorimeters. The steel flux-return yoke outside the solenoid hosts gas ionization detectors used to identify and reconstruct muons.
The CMS experiment uses a right-handed coordinate system, with the origin at the nominal interaction point, the x axis pointing to the centre of the LHC, the y axis pointing up (perpen-dicular to the LHC plane), and the z axis along the anticlockwise-beam direction. The polar angle θ is measured from the positive z axis and the azimuthal angle φ is measured in the x-y plane. Transverse energy, denoted by ET, is defined as the product of energy and sin θ, with θ
being measured with respect to the nominal interaction point. Charged-particle trajectories are measured by the silicon pixel and strip tracker, with full azimuthal coverage within|η| <2.5, where the pseudorapidity η is defined as η = −ln[tan(θ/2)]. A lead tungstate crystal elec-tromagnetic calorimeter (ECAL) and a brass/scintillator hadron calorimeter (HCAL) surround the tracking volume and cover the region|η| <3. The ECAL barrel extends to|η| <1.48 while the ECAL endcaps cover the region 1.48 < |η| <3.0. A lead/silicon-strip preshower detector is located in front of the ECAL endcap in the region 1.65< |η| <2.6. The preshower detector includes two planes of silicon sensors measuring the x and y coordinates of the impinging par-ticles. A steel/quartz-fibre Cherenkov forward calorimeter extends the calorimetric coverage to |η| < 5.0. In the region|η| < 1.74, the HCAL cells have widths of 0.087 in both η and φ. In the η-φ plane, and for|η| < 1.48, the HCAL cells map on to 5×5 ECAL crystal arrays to form calorimeter towers projecting radially outwards from points slightly offset from the nom-inal interaction point. In the endcap, the ECAL arrays matching the HCAL cells contain fewer crystals.
3
photons from π0 → γγ and η → γγ decays, and electrons from W → eν and Z → e+e− decays [34]. Changes in the transparency of the ECAL crystals due to irradiation during the LHC running periods and their subsequent recovery are monitored continuously, and corrected for, using light injected from a laser system [34].
The first level of the CMS trigger system, composed of custom hardware processors, uses in-formation from the calorimeters and muon detectors to select the most interesting events in a fixed time interval of less than 4 µs. The high-level trigger processor farm further decreases the event rate from around 100 kHz to around 400 Hz, before data storage.
A more detailed description of the CMS detector can be found in Ref. [35].
Reconstruction of the photons used in this analysis is described in Section 4, and uses a cluster-ing of the energy recorded in the ECAL, known as a “supercluster”, which may be extended in the φ direction to form an extended cluster or group of clusters.
The global event reconstruction (also called particle-flow event reconstruction) consists of re-constructing and identifying each particle with an optimized combination of all subdetector information [36, 37]. In this process, the identification of the particle type (photon, electron, muon, charged hadron, neutral hadron) plays an important role in the determination of the particle direction and energy. Photons are identified as ECAL energy clusters not linked to the extrapolation of any charged-particle trajectory to the ECAL. Electrons are identified as a primary charged-particle track associated with ECAL energy clusters corresponding to this track’s extrapolation to the ECAL and to possible bremsstrahlung photons emitted along the way through the tracker material. Muons are identified as a track in the central tracker con-sistent with either a track or several hits in the muon system, associated with less energy in the calorimeters than would be deposited by a charged hadron or electron. Charged hadrons are identified as charged-particle tracks neither identified as electrons, nor as muons. Finally, neutral hadrons are identified as HCAL energy clusters not linked to any charged hadron tra-jectory, or as ECAL and HCAL energy excesses with respect to the expected energy deposited by a matching charged hadron.
The energy of photons used in the global event reconstruction is directly obtained from the ECAL measurement. The energy of electrons is determined from a combination of the track momentum at the main interaction vertex, the corresponding ECAL cluster energy, and the en-ergy sum of all bremsstrahlung photons attached to the track. The enen-ergy of muons is obtained from the corresponding track momentum. The energy of charged hadrons is determined from a combination of the track momentum and the corresponding ECAL and HCAL energy, cali-brated for the nonlinear response of the calorimeters. Finally, the energy of neutral hadrons is obtained from the corresponding calibrated ECAL and HCAL energies.
For each event, hadronic jets are clustered from these reconstructed particles using the infrared-and collinear-safe anti-kTalgorithm [38] with a size parameter of 0.5. The jet momentum is
de-termined as the vectorial sum of all particle momenta in the jet, and the scale is found in the simulation to be within 5% to 10% of the true momentum over the whole transverse momen-tum spectrum and detector acceptance. Jet energy corrections are derived from simulation, and are confirmed with in situ measurements using the energy balance of dijet and γ/Z+jet events [39]. The jet energy resolution typically amounts to 15% (8%) at 10 (100) GeV, to be compared to about 40% (12%) obtained when the calorimeters alone are used for jet clustering. To identify jets originating from the hadronization of bottom quarks, the combined secondary vertex b-tagging algorithm [40] is employed. The algorithm tags jets from b-hadron decays by identifying their displaced decay vertex. The working point of the tagging algorithm used
pro-4 3 Data sample and simulated events
vides an efficiency for identifying b-quark jets of about 70% and a misidentification probability for jets from light quarks and gluons of about 1%.
The missing transverse energy vector is taken as the negative vector sum of all reconstructed particle candidate transverse momenta in the global event reconstruction, and its magnitude is referred to as EmissT .
3
Data sample and simulated events
The events used in the analysis were selected by diphoton triggers with asymmetric trans-verse energy thresholds and complementary photon selections. One selection requires a loose calorimetric identification based on the shape of the electromagnetic shower and loose isolation requirements on the photon candidates, while the other requires only that the photon candi-date has a high value of the R9shower shape variable. High trigger efficiency is maintained by
allowing both photons to satisfy either selection. The R9variable is defined as the energy sum
of 3×3 crystals centred on the most energetic crystal in the supercluster divided by the energy of the supercluster. Photons that convert before reaching the calorimeter tend to have wider showers and lower values of R9than unconverted photons. To cover the entire data taking
pe-riod two trigger threshold configurations are used: ET > 26(18)GeV on the leading (trailing)
photon, and ET > 36 (22)GeV. The measured trigger efficiency is 99.4% for events satisfying
the diphoton preselection required for events entering the analysis, as described in Section 4. The Monte Carlo (MC) simulation of detector response employs a detailed description of the CMS detector, and usesGEANT4 version 9.4 (patch 03) [41]. Simulated events include simula-tion of the multiple pp interacsimula-tions taking place in each bunch crossing and are weighted to reproduce the distribution of the number of interactions in data. They thus simulate the effects of pileup — the presence of signals from multiple pp interactions, in multiple bunch crossings, in each recorded event. The interactions used to simulate pileup are generated with the same versions ofPYTHIA [42], 6.424 or 6.426, that are used for other purposes as described below.
The PYTHIA tunes used for the underlying event activity are Z2 and Z2* for the 7 and 8 TeV
samples, respectively [43]. Simulated Higgs boson signal events are used both for training of multivariate discriminants and to construct the signal model used in the statistical proce-dures employed to extract the results. Sufficient samples have been produced to ensure that the samples of simulated signal events used for construction of the signal model (Section 7) are not used for training the multivariate discriminants. The MC signal event samples for the ggH and VBF processes are obtained using the next-to-leading order (NLO) matrix-element generatorPOWHEG(version 1.0) [44–48] interfaced withPYTHIA. For the 7 TeV samples, events are weighted so that the transverse momentum spectrum of Higgs bosons produced by the ggH process agrees with the next-to-next-to-leading logarithm + NLO distribution computed by HqT(version 1.0) [49–51]. At 8 TeV, POWHEG has been tuned following the
recommenda-tions of the LHC Higgs Cross Section Working Group [52] and reproduces theHqTspectrum. The ggH process cross section is reduced by 2.5% for all values of mHto account for the
inter-ference with nonresonant diphoton production [53]. For the VH and ttH processesPYTHIA is used alone; processes are generated at leading-order by PYTHIA, and higher order diagrams are accounted for only by PYTHIA’s “parton showering” model. The SM Higgs boson cross sections and branching fractions used are taken from Ref. [54]. Samples used for the testing of spin hypotheses were generated with leading-order accuracy byJHUGEN[55, 56], interfaced to PYTHIA.
Simulated samples of Z → e+e−, Z → µ+µ−, and Z → µ+µ−γ events used for comparison with data, and for the derivation of energy scale and resolution smearing corrections are
gener-5
ated with MADGRAPH,SHERPA, andPOWHEG[57], allowing comparisons to be made between the different generators.
Simulated background samples are used only for training multivariate discriminants and defin-ing selection and classification criteria. The background is simulated usdefin-ing a combination of samples. At√s = 7 TeV the diphoton processes are simulated using a combination of MAD -GRAPH 5 [58] interfaced toPYTHIAfor processes apart from the gluon-fusion box diagram, and
PYTHIAalone for the box diagram. At√s=8 TeV the diphoton continuum processes involving
two prompt photons are simulated usingSHERPA 1.4.2 [59]. TheSHERPAsamples give a notice-ably improved description of diphoton continuum events accompanied by one or two jets, and enable training of a more effective multivariate discriminant in the case of diphoton-plus-dijet events. The remaining processes where one of the photon candidates arises from misidentified jet fragments are simulated usingPYTHIA alone, the cross sections of the processes are scaled by K-factors derived from CMS measurements [60, 61].
4
Photon reconstruction and identification
Photon candidates for the analysis are reconstructed from energy deposits in the ECAL using algorithms that constrain the superclusters in η and φ to the shapes expected from electrons and photons with high pT. The algorithms do not make any hypothesis as to whether the
particle originating from the interaction point is a photon or an electron; when reconstructed in this way, electrons from Z → e+e− events provide measurements of the photon trigger, reconstruction, and identification efficiencies, and of the photon energy scale and resolution. The clustering algorithms achieve a rather complete (≈95%) collection of the energy of pho-tons and electrons, even those that undergo conversion and bremsstrahlung in the material in front of the ECAL. In the barrel region, superclusters are formed from five-crystal-wide strips in η, centred on the locally most energetic crystal (seed), and have a variable extension in φ. In the endcaps, where the crystals are arranged according to an x-y rather than an η-φ geom-etry, matrices of 5×5 crystals, which may partially overlap and are centred on a locally most energetic crystal, are summed if they lie within a narrow φ road. The photon candidates are required to be within the fiducial region|η| < 2.5, excluding the barrel-endcap transition re-gion 1.44 < |η| < 1.57, where the photon reconstruction is suboptimal. The fiducial region requirement is applied to the supercluster position in the ECAL, i.e. the value of η is calculated with respect to the origin of the coordinate system. The exclusion of the barrel-endcap transi-tion region ensures complete clustering of the accepted showers in either the ECAL barrel or endcaps.
About half of the photons convert in the material upstream of the ECAL. If the resulting charged particle tracks originate sufficiently close to the interaction point so as to pass through three or more tracking layers, conversion track pairs may be reconstructed and matched to the photon candidate.
4.1 Photon energy
The photon energy is computed from the signals recorded by the ECAL. In the region covered by the preshower detector (|η| > 1.65) the signals recorded in it are also considered. In order to obtain the best energy resolution, the calorimeter signals are calibrated and corrected for several detector effects [34]. The variation of crystal transparency during the run is continu-ously monitored and corrected for using a factor based on the measured change in response to the light from the laser system, with the response for each crystal being computed approxi-mately every 40 minutes. The single-channel response of the ECAL is equalized exploiting the
6 4 Photon reconstruction and identification
φ-symmetry of the energy flow, the mass constraint on the energy of the two photons in π0 and η decays, and the momentum constraint on the energy of isolated electrons from W- and Z-boson decays. Finally, the containment of the shower in the clustered crystals, the shower losses for photons that convert in the material upstream of the calorimeter, and the effects of pileup, are corrected using a multivariate regression technique. The photon energy response distribution is parameterized by a function with a Gaussian core and two power law tails, an extended form of the Crystal Ball function [62]. The regression provides a per-photon estimate of the parameters of the function, and therefore a prediction of the distribution of the ratio of true energy to uncorrected supercluster energy. The most probable value of this distribution is taken as the corrected photon energy. The width of the Gaussian core is further used as a per-photon estimator of the energy uncertainty. The regression input variables are a collection of shower shape variables including R9of the supercluster, the ratio of the 5×5 crystal energy
cen-tred around the seed crystal to the uncorrected supercluster energy sum, the energy-weighted η-width and φ-width of the supercluster, and the ratio between the hadronic energy behind the supercluster and the electromagnetic energy of the cluster. The global η coordinate of the su-percluster is included, and for the barrel the global φ coordinate and the coordinates of the seed cluster with respect to the crystal centre are also included. In the endcap, the ratio of preshower energy to raw supercluster energy is included. Finally, the number of primary vertices and the median energy density ρ [63] in the event are included in order to allow for the correction of residual energy scale effects due to pileup.
A multistep procedure has been implemented to correct the energy scale in data, and to de-termine the parameters of Gaussian smearing to be applied to showers in simulated events so as to reproduce the energy resolution seen in data. First, the energy scale in data is equalized with that in simulated events, and residual long-term drifts in the response are corrected, using Z → e+e− decays in which the electron showers are reconstructed as photons. The data are corrected as a function of the time at which they were taken, using 8 epochs in the 7 TeV dataset and 51 epochs in the 8 TeV dataset. Following this, the photon energy resolution predicted by the simulation is made more realistic by adding a Gaussian smearing determined from the comparison between the Z→e+e−line-shape in data and in simulated events. The amount of smearing required is extracted differentially in|η|(two bins in the barrel and two in the end-cap) and R9 (two bins). In the fits from which the required amount of smearing is extracted,
the data energy scale is allowed to float, and a residual scale correction for the data is extracted in the same eight bins. A sufficient number of Z →e+e−events is available in the 8 TeV data to allow a third step, in which the energy scale for the ECAL barrel is further corrected in 20 bins defined by ranges in|η|, R9, and ET, and the smearing magnitude is allowed to have an
energy dependence; the additional energy resolution (σ/E) is parameterized as the quadratic sum of a constant term and a term proportional to 1/√ET, and the relative magnitude of the
two components extracted from the fits.
Figure 1 shows the invariant mass of electron pairs reconstructed in Z → e+e−events in the 8 TeV data and in simulated events in which the electron showers are reconstructed as pho-tons, and the full set of corrections to the data, and smearings of the simulated energies, are applied. The selection applied to the diphoton candidates is the same, apart from the inversion of the electron veto, as is applied to diphoton candidates entering the analysis (as described in Section 6). There is excellent agreement between the data and the simulation in the core of the distributions. A slight discrepancy is present in the low-mass tail in the endcaps, where the Gaussian smearing is not enough to account for some noticeable non-Gaussian energy loss. The mass peaks are shifted from the true Z-boson mass, both in data and simulation, because the electron showers are reconstructed as photons.
4.2 Photon preselection 7 Events / 0.5 GeV 0 5 10 15 20 4 10 × (8 TeV) -1 19.7 fb CMS Barrel-Barrel Data (MC) -e + e → Z (GeV) ee m 75 80 85 90 95 100 105 Data/MC 0.8 1 1.2 Events / 0.5 GeV 0 20 40 60 80 3 10 × (8 TeV) -1 19.7 fb CMS
Not Barrel-Barrel Data (MC) -e + e → Z (GeV) ee m 75 80 85 90 95 100 105 Data/MC 0.8 1 1.2
Figure 1: Invariant mass of e+e− pairs in Z → e+e−events in the 8 TeV data (points), and in simulated events (histogram), in which the electron showers are reconstructed as photons, and the full set of photon corrections and smearings are applied. The comparison is shown for (left) events with both showers in the barrel, and (right) the remaining events. For each bin, the ratio of the number of events in data to the number of simulated events is shown in the lower main plot.
4.2 Photon preselection
The continuum background to the H→γγprocess is mainly due to prompt diphoton produc-tion, with a reducible contribution from pp→ γ+jet and dijet processes where at least one of the objects reconstructed as a photon comes from a jet. Typically these photon candidates come from one or more neutral mesons that take a substantial fraction of the total jet pTand are thus
relatively isolated from hadronic activity in the detector. In the transverse momentum range of interest, the photons from neutral pion decays are rather collimated and are reconstructed as a single photon. In the events used for the analysis, i.e. after all selection and classification criteria are applied, MC simulation predicts that about 70% of the total background is due to the irreducible prompt diphoton production.
The photons entering the analysis are required to satisfy preselection criteria similar to, but slightly more stringent than, the trigger requirements. These consist of
• pγT1 > 33 GeV and pγT2 > 25 GeV, where pγT1 and pγT2 are the transverse momenta of the leading (in pT) and subleading photons, respectively.
• a selection on the hadronic leakage of the shower, measured as the ratio of energy in HCAL cells behind the supercluster to the energy in the supercluster,
• a loose selection based on isolation and the shape of the shower,
• an electron veto, which removes the photon candidate if its supercluster is matched to an electron track with no missing hits in the innermost tracker layers, thus exclud-ing almost all Z→e+e−events.
The selection requirements are applied with different stringency in four categories defined to match the different selections used in the trigger. The four categories are shown in Table 1. The efficiency of the photon preselection is measured in data using a “tag-and-probe” tech-nique [64]. The efficiency of all preselection criteria, except the electron veto requirement, is
8 4 Photon reconstruction and identification
measured using Z → e+e− events. The efficiency for photons to satisfy the electron veto re-quirement is measured using Z → µ+µ−γevents, in which the photon is produced by final-state radiation, which provide a more than 99% pure source of prompt photons. The ratio of the photon efficiency measured in data to that found in simulated Z →e+e−events, e
data/eMC, is
consistent with unity in all categories. The complete set of efficiencies, in data and in simulated Z→e+e−events, and the ratios edata/eMC, are shown in Table 1. The systematic uncertainty in
the measurement is included in both the efficiencies and the ratio. The statistical uncertainties in the efficiencies measured in simulated events are negligible. The measured edata/eMCratios
are used to correct the simulated signal sample, and the associated uncertainties are taken into account as systematic uncertainties in the signal extraction procedure. For photons in simu-lated Higgs boson events the efficiency of the preselection criteria in the four categories ranges from 92% to 99%.
Table 1: Photon preselection efficiencies for both the 7 and 8 TeV datasets measured for Z →
e+e−events, where the electrons are reconstructed as photons, in four photon categories. The statistical uncertainties in the efficiencies found in simulated events are negligible, and the uncertainties measured in data are discussed in the text.
Preselection category edata(%) eMC(%) edata/eMC
7 TeV dataset Barrel; R9>0.90 98.7±0.3 99.1 0.996±0.003 Barrel; R9<0.90 96.2±0.5 96.7 0.995±0.006 Endcap; R9 >0.90 99.1±0.9 98.2 1.008±0.009 Endcap; R9 <0.90 96.1±1.5 95.6 1.005±0.018 8 TeV dataset Barrel; R9>0.90 98.8±0.3 98.6 0.999±0.003 Barrel; R9<0.90 95.7±0.6 96.1 0.995±0.006 Endcap; R9 >0.90 98.4±0.9 97.9 1.005±0.009 Endcap; R9 <0.90 95.5±1.7 94.5 1.011±0.018 4.3 Photon identification
A boosted decision tree (BDT), implemented using theTMVA[65] framework, is trained to
sep-arate prompt photons from photon candidates resulting from misidentification of jet fragments passing the preselection requirements. The following variables are used as inputs to the photon identification BDT:
1. Lateral shower shape variables, six of which use data from the ECAL crystals, and one of which measures the shower spread in the preshower detector (where it is present). The shape variables obtained in the MC simulation are compared to those observed in Z→e+e−and Z→µ+µ−γdata samples. No significant differences are observed. 2. Isolation variables, based on the particle-flow algorithm [37], and using sums of the pT
of photons, and of charged hadrons, within regions of∆R < 0.3 around the candidate, where ∆R = √(∆φ)2+ (∆η)2. Two charged-hadron isolation variables are used: one
that considers charged hadrons coming from the vertex chosen for the event (described in Section 5), and one that is the largest of all such pTsums among those made for each
reconstructed vertex. The second variable is effective when a photon candidate originat-ing from misidentification of jet fragments comes from a vertex other than the chosen one (Section 5 describes the vertex choice).
4.3 Photon identification 9
3. The energy median density per unit area in the event, ρ. This variable is introduced to allow the BDT classifier to take into account the pileup dependence of the isolation variables.
4. The pseudorapidity and energy of the supercluster corresponding to the reconstructed photon. These variables are introduced to allow the dependence of the shower topology and isolation variables on η and pTto be taken into account.
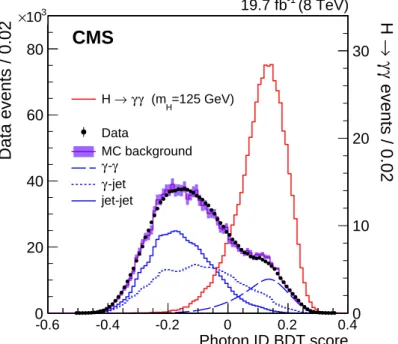
Figure 2 shows the photon identification BDT score of the lower-scoring photon in diphoton pairs with an invariant mass, mγγ, in the range 100 < mγγ < 180 GeV, for events passing the
preselection in the 8 TeV dataset and for simulated background events (histogram with shaded error bands showing the statistical uncertainty). The tall histogram on the right corresponds to simulated Higgs boson signal events. Although the simulated background events are only used for training the BDT, it is worth noting that the agreement of their BDT score distribution with that in data is good. The bump that can be seen in both distributions at a BDT score of slightly above 0.1 corresponds to events where both photons are prompt and, therefore, signal-like. Photon ID BDT score -0.6 -0.4 -0.2 0 0.2 0.40 10 20 30 0 20 40 60 80 (8 TeV) -1 19.7 fb
CMS
3 10 × Data events / 0.02 events / 0.02 γγ → H =125 GeV) H (m γ γ → H Data MC background γ -γ -jet γ jet-jetFigure 2: Photon identification BDT score of the lower-scoring photon of diphoton pairs with an invariant mass in the range 100 < mγγ < 180 GeV, for events passing the preselection in
the 8 TeV dataset (points), and for simulated background events (histogram with shaded error bands showing the statistical uncertainty). Histograms are also shown for different compo-nents of the simulated background, in which there are either two, one, or zero prompt signal-like photons. The tall histogram on the right (righthand vertical axis) corresponds to simulated Higgs boson signal events.
The agreement between data and simulation for photon identification is assessed using elec-trons from Z→e+e−decays, photons from Z→µ+µ−γdecays, and the highest-pTphoton in
diphoton events with mγγ>160 GeV in which the relative magnitude of the contribution from
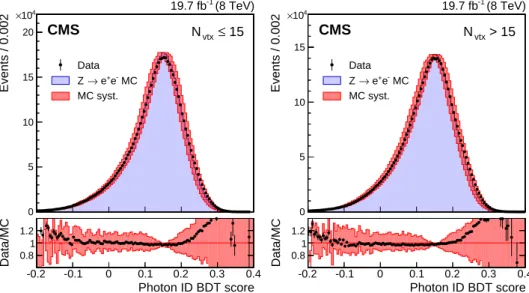
misidentified jet fragments is small. Figure 3 shows a comparison of the photon identification BDT score for Z →e+e−electron showers reconstructed as photons in the barrel, for data and MC simulated events. The events must pass all the preselection requirements, but the electron
10 5 Diphoton vertex
veto condition is inverted. The systematic uncertainty assigned to the photon identification BDT score is shown as a band, and corresponds to a shift of±0.01 in the score. The comparison is made for the 8 TeV dataset, and is shown for two sets of events with different numbers of primary vertices, Nvtx, to demonstrate the independence of the result from effects coming from
pileup. The differences between the distributions for the data and the simulation fall within the assigned systematic uncertainties for both the lower-pileup (Nvtx ≤15) and higher-pileup
(Nvtx >15) sets of events, and the difference between the distributions in the two sets is
negli-gible. Events / 0.002 0 5 10 15 20 N vtx≤ 15 Data MC -e + e → Z MC syst. 4 10 × (8 TeV) -1 19.7 fb CMS Photon ID BDT score -0.2 -0.1 0 0.1 0.2 0.3 0.4 Data/MC 0.8 1 1.2 Events / 0.002 0 5 10 15 > 15 vtx N Data MC -e + e → Z MC syst. 4 10 × (8 TeV) -1 19.7 fb CMS Photon ID BDT score -0.2 -0.1 0 0.1 0.2 0.3 0.4 Data/MC 0.8 1 1.2
Figure 3: Comparison of the photon identification BDT score for electron showers in the barrel in Z→e+e−events in the 8 TeV dataset and MC simulated events, for events passing the pre-selection, but with the electron veto condition inverted. The systematic uncertainty assigned to the photon identification BDT score is shown as a band. The comparison is shown for two sets of events with different numbers of primary vertices, Nvtx. For each bin, the ratio of the
number of events in data to the number of simulated events is shown in the lower plot.
5
Diphoton vertex
The mean number of pp interactions per bunch crossing is 9 in the 7 TeV dataset and 21 in the 8 TeV dataset. In the longitudinal direction, z, the interaction vertices, built from the re-constructed tracks, have a distribution with an RMSspread of about 6 (5) cm in the 7 (8) TeV
dataset.
The diphoton mass resolution has contributions from the resolution of the measurement of the photon energies and the measurement of the angle between the two photons. If the vertex from which the photons originate is known to within about 10 mm, then the experimental resolution on the angle between them makes a negligible contribution to the mass resolution. Thus, if the diphoton is associated with the charged particle vertex corresponding to the interaction in which it originated, then the mass resolution will be entirely dominated by the photon energy resolution, since the longitudinal coordinate of the charged particle vertices is known to greater precision than 10 mm.
5.1 Diphoton vertex identification 11
5.1 Diphoton vertex identification
No charged particle tracks result from photons that do not convert, so the diphoton vertex is identified indirectly, using the kinematic properties of the diphoton system and its correlations with the kinematic properties of the recoiling tracks. If either of the photons converts, the direction of the resulting tracks can provide additional information.
Three discriminating variables are calculated for each reconstructed primary vertex: the sum of the squared transverse momenta of the charged particle tracks associated with the vertex, and two variables that quantify the vector and scalar balance of pT between the diphoton system
and the charged particle tracks associated with the vertex. The three variables are: 1. ∑~p2 T 2. −∑(~pT· ~pγγ T |~pγγ T | ), and 3. (|∑~pT| − |~pγγT |)/(|∑~pT| + |~pγγT |),
where the sums are over the transverse momentum vectors of the charged tracks,~pT, and~pTγγ
is the transverse momentum vector of the diphoton system. In addition, if either photon is associated with any charged particle tracks that have been identified as resulting from conver-sion, then a further variable, gconv, is used, as defined below. An estimate of the primary vertex
longitudinal position, ze, is obtained from the conversion track(s), and the additional variable
gconvis defined as the pull between zeand the longitudinal position of the reconstructed vertex,
zvtx: gconv= |ze−zvtx|/σ, where σ is the uncertainty in ze. The variables are used as the inputs
to a multivariate system based on a BDT to choose the reconstructed vertex to be associated with the diphoton system.
The vertex finding efficiency, defined as the efficiency that the chosen vertex is within 10 mm of the true vertex location, has been measured using Z→ µ+µ−events. The performance of the algorithm is evaluated after re-reconstruction of the vertices following removal of the muon tracks, so that the event mimics a diphoton event. The use of tracks from a converted photon to locate the vertex is validated in γ+jet events. In both cases the ratio of the efficiency measured in data to that measured in MC simulation is within 1% of unity when viewed as a function of the number of vertices in the event. When viewed as a function of the Z-boson pT, the
deviation of the ratio from unity increases to a few percent in the region where pZT < 15 GeV. The measured ratio as a function of the Z-boson pTis used as a correction to the vertex finding
efficiency in simulated Higgs boson signal events. The vertex finding efficiency for a Higgs boson of mass 125 GeV, integrated over its pT spectrum, is computed to be 85.4 (79.6)% in the
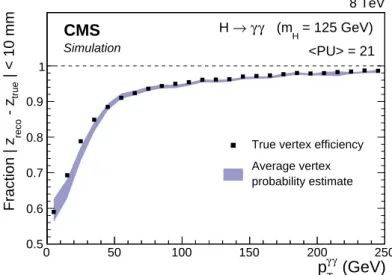
7 (8) TeV dataset. Figure 4 shows the efficiency with which a diphoton system is assigned to a vertex reconstructed within 10 mm of the true diphoton vertex in simulated Higgs boson events (mH=125 GeV) in the 8 TeV dataset, as a function of the transverse momentum of the diphoton
system.
5.2 Per-event vertex probability
A second vertex-related multivariate discriminant has been designed to estimate, event-by-event, the probability for the vertex assignment to be within 10 mm of the diphoton interaction point. This, in conjunction with the event-by-event estimate of the energy resolution of each photon, is used to estimate the diphoton mass resolution for each individual event, and this estimate is used in the event classification, as described in Section 6. The inputs of the vertex probability BDT are
12 5 Diphoton vertex (GeV) γ γ T p 0 50 100 150 200 250 | < 10 mm true - z reco Fraction | z 8 TeV CMS Simulation 0.5 0.6 0.7 0.8 0.9 1 = 125 GeV) H (m γ γ → H <PU> = 21
True vertex efficiency
probability estimate Average vertex
Figure 4: Fraction of diphoton vertices (solid points) assigned, by the vertex assignment BDT, to a reconstructed vertex within 10 mm of their true location in simulated Higgs boson events, mH = 125 GeV,
√
s = 8 TeV, as a function of pγγ
T . Also shown is a band, the centre of which is
the mean prediction, from the vertex probability BDT (described in Section 5.2), of the proba-bility of correctly locating the vertex. The mean is calculated in pγγ
T bins, and the width of the
band represents the event-to-event uncertainty in the estimates.
• the values of the vertex identification BDT output for the three most likely vertices in the event,
• the total number of reconstructed vertices in the event,
• the transverse momentum of the diphoton system, pγγ
T ,
• the distances between the chosen vertex and the second- and third-best vertices,
• the number of photons with an associated conversion track or tracks.
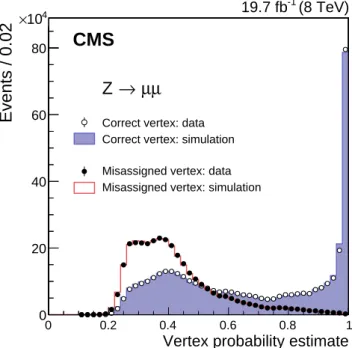
The vertex probability BDT is tested with simulated signal events as shown in Fig. 4, and the performance in data is tested using Z→µ+µ−events. Validation of the vertex probability BDT for events in which conversion tracks are present is achieved using γ+jet events in which one or more conversion tracks are reconstructed. The probability to identify a close-enough vertex (vertex probability) has a linear relationship with the vertex probability BDT score, the parameters of which are obtained from a fit using a sample of simulated signal events. Figure 5 shows the distribution of the vertex probability estimate, obtained from the BDT score, in Z→
µ+µ−events. The charged particle tracks belonging to the muon pair are used to identify the vertex, and are then removed from the event before re-reconstructing the vertices and passing them to the vertex identification and the vertex probability BDTs. The pTof the dimuon pair is
used in the BDT calculation in place of~pγγ
T . The vertex identified by the muons is assumed to
be the correct or true vertex, so that if the vertex assignment BDT chooses that vertex, it chooses the right vertex, otherwise it chooses the wrong vertex. The vertex probability estimates in data (points), are compared to MC simulation (histograms). The comparison is made separately for events in which the vertex assignment BDT assigns the right vertex, and for those in which it assigns a wrong vertex.
13
Vertex probability estimate
0 0.2 0.4 0.6 0.8 1 0 20 40 60 80 (8 TeV) -1 19.7 fb
CMS
4 10 × Events / 0.02 µ µ → ZCorrect vertex: data Correct vertex: simulation Misassigned vertex: data Misassigned vertex: simulation
Figure 5: Distribution of the vertex probability estimate in Z → µ+µ− events. The vertex probability estimates in 8 TeV data (points), are compared to the estimates in MC simulation (histograms). The comparison is made separately for events in which the vertex is assigned to the same (open circles and filled histogram), or to a different vertex (filled circles and outlined histogram), as that identified by the muons.
6
Event classification
The analysis uses events with two photon candidates satisfying the preselection requirements (described in Section 4.3) with an invariant mass, mγγ, in the range 100<mγγ <180 GeV, and
with pTγ1 > mγγ/3 and p γ2
T > mγγ/4. In the rare case of multiple diphoton candidates, the
one with the highest pγ1
T + p
γ2
T is selected. The use of pT thresholds scaled by mγγ prevents
the distortion of the low end of the mγγ spectrum that results if a fixed threshold is used. An
additional requirement is applied on the photon identification BDT scores for both photons, which are required to be greater than−0.2 (see Fig. 2). This requirement retains more than 99% of simulated signal events fulfilling the other analysis selection requirements, while removing about 24% of events in data. The requirements listed above are referred to as the “full diphoton preselection”.
To achieve the best analysis performance, the events are separated into classes based on both their mass resolution and their relative probability to be due to signal rather than background. The first step in the classification of the events involves the extraction of those tagged by the presence of objects in the final state, in addition to the photon pair, that give the event a signa-ture characteristic of one of the production processes. The remaining untagged events, which constitute the majority (≈99%) of the events used in the analysis, are classified according to a variable constructed using multivariate techniques.
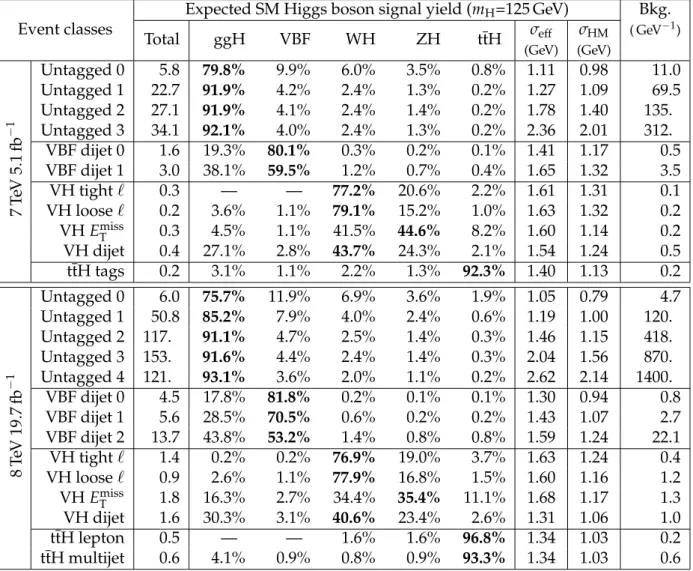
The classification procedure, which is described in detail below, results in 11 event classes for the 7 TeV dataset and 14 for the 8 TeV dataset. The event classes, and the expected number of SM Higgs boson events and estimated background in those classes, are set out later, in Table 3, together with the composition of the expected SM Higgs boson signal in terms of the produc-tion processes, and the diphoton mass resoluproduc-tion expected for the signal in each of the classes.
14 6 Event classification
To ensure that the classes are mutually exclusive, events are tested against the class selection requirements in a fixed order as described in Section 6.4.
6.1 Multivariate event classifier
A multivariate event classifier, the diphoton BDT, is constructed to satisfy the following criteria: 1. The diphoton BDT should assign a high score to events that have
(a) good diphoton mass resolution,
(b) high probability of being signal rather than background.
2. The classifier should not select events according to the mass of the diphoton system rela-tive to the particular mass of the Higgs boson signal used for training.
The classifier incorporates a per-event estimate of the diphoton mass resolution, the identifica-tion BDT scores of both photons, and the kinematic properties of the diphoton system, except for mγγ. To avoid any dependence on mH, the transverse momenta and resolutions are divided
by mγγ.
The complete list of variables used in the BDT is the same as used in previous versions of the analysis [28]: the scaled photon transverse momenta (pγT1/mγγ and p
γ2
T /mγγ), the
pseu-dorapidities of both photons, the photon identification BDT classifier values for both photons, the cosine of the angle between the two photons in the transverse plane, the expected relative diphoton mass resolutions under the hypotheses of selecting the correct/a wrong interaction vertex, and also the probability of selecting the correct vertex.
The diphoton mass resolution depends on several factors: the location of the associated energy deposits in the calorimeter; whether or not one or both photons converted in the detector vol-ume in front of the calorimeter; and the probability that the true diphoton vertex has been iden-tified. Events in which one of the photons has a low identification BDT score are more likely to be due to background processes. The Higgs signal-to-background ratio, S/B, varies with the kinematic properties of the diphoton system mainly through the η of the photons (highest S/B when both are in the barrel), and pγγ
T (highest S/B for large p
γγ
T ). The BDT is trained using a
simulated signal sample having a mass, mH=123 GeV, near the centre of the mass range of the
analysis. The relative abundance of events from different production processes in the sample is set according to the expectations for a SM Higgs boson with that mass.
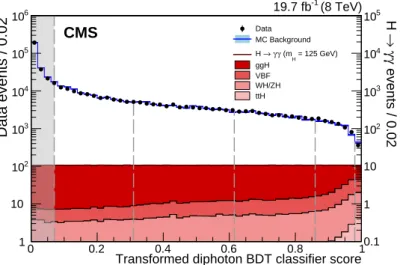
The multivariate classifier assigns a score to each event. It has been verified that selecting simulated background events with high diphoton BDT score does not result in any peak in the diphoton invariant mass distribution of the selected events. Figure 6 shows, for the 8 TeV dataset, how the BDT performs on simulated SM H → γγsignal events with mH = 125 GeV,
and on data satisfying the full diphoton preselection. The classifier score has been transformed such that the sum of signal events from all processes has a uniform, flat, distribution. This transformation assists visualization of the performance of the BDT. The outlined histogram, following the data points, is for simulated background events. The vertical dashed lines indi-cate the boundaries of the untagged event classes, the determination of which is described in Section 6.3. Given that the data are completely dominated by background events, it can be seen that the signal-to-background ratio increases substantially with the classifier score, and that the VBF, VH, and ttH processes tend to achieve high scores, due to their significantly harder pγγ
T
6.2 Events tagged by exclusive signatures 15
Transformed diphoton BDT classifier score
0 0.2 0.4 0.6 0.8 10.1 1 10 2 10 3 10 4 10 5 10 1 10 2 10 3 10 4 10 5 10 6 10 (8 TeV) -1 19.7 fb CMS Data events / 0.02 events / 0.02 γγ → H Data MC Background = 125 GeV) H (m γ γ → H ggH VBF WH/ZH ttH
Figure 6: Transformed diphoton BDT classifier score for events satisfying the full diphoton preselection in the 8 TeV data (points with error bars, left axis), and for simulated signal events from the four production processes (solid filled histograms, right axis). The outlined histogram, following the data points, is for simulated background events. The vertical dashed lines show the boundaries of the untagged event classes, with the leftmost dashed line representing the score below which events are discarded and not used in the final analysis (described in Sec-tion 6.3).
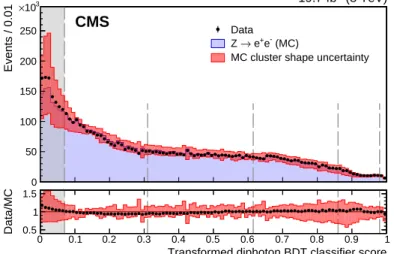
Figure 7 shows a comparison of the transformed classifier score for Z → e+e− data and for MC simulated events, in which for both cases the electrons are reconstructed as photons. The electron showers in the events satisfy the full diphoton preselection requirements with the elec-tron veto condition inverted. The classifier score has been subjected to the same transformation as was used for Fig. 6. The score for Z → e+e−events peaks at low values whilst Higgs bo-son signal events have a flat distribution, reflecting the differences between the two types of event, but it can be seen that sufficient numbers of Z → e+e−events are present even at high values of the classifier score to enable the agreement between data and MC simulation to be adequately tested there. The good agreement between MC simulation and data for Z→e+e− events constitutes an important check that the modeling of the BDT input variables and their correlations in the simulation of the Higgs boson signal is accurate. The simulated events have been weighted so that the Z-boson pT distribution matches that observed in Z → e+e− data.
The band indicates the systematic uncertainty resulting from propagating to the diphoton BDT event classifier both the uncertainty associated with the photon identification BDT score (which corresponds to a shift of±0.01 of the score) and the uncertainty in the per-photon estimate of the energy resolution (which amounts to a scaling of its value by±10%). Since the magnitudes of these two uncertainties were chosen to cover the discrepancies between data and simulation in the tails of the distributions of the two variables, the resulting uncertainty in the diphoton BDT event classifier appears to be slightly overestimated.
6.2 Events tagged by exclusive signatures
Selections enriched in Higgs boson production mechanisms other than ggH can be made by requiring, in addition to the diphoton pair, the presence of other objects which provide signa-tures of the production mechanism. Higgs bosons produced by VBF are accompanied by a pair of jets separated by a large rapidity gap. Those resulting from the VH production mechanism may be accompanied by one or more charged leptons, large Emiss
T , or jets from the decay of
16 6 Event classification 0 0.1 0.2 0.3 0.4 0.5 0.6 0.7 0.8 0.9 1 0.4 0.6 0.8 1 1.2 1.4 1.6 Events / 0.01 0 50 100 150 200 250 Data (MC) -e + e → Z
MC cluster shape uncertainty (8 TeV)
-1
19.7 fb
CMS
Transformed diphoton BDT classifier score 0 0.1 0.2 0.3 0.4 0.5 0.6 0.7 0.8 0.9 1 Data/MC 0.5 1 1.5 3 10 ×
Figure 7: Transformed diphoton BDT classifier score for Z → e+e− events in 8 TeV data, and
in MC simulation, in which the electrons are reconstructed as photons. The distribution of simulated events is represented by a histogram, and the data by points with error bars. For each bin, the ratio of the number of events in data to the number of simulated events is shown in the lower plot. The bands in the two plots indicate the systematic uncertainty related to the MC cluster shape uncertainty (see text). The vertical dashed lines show the boundaries of the untagged event classes, with the leftmost dashed line representing the score below which events are discarded and not used in the final analysis (described in Section 6.3).
quarks, accompanied by b quarks, and may be accompanied by charged leptons or additional jets.
The tagging of dijet events, targeting VBF production, significantly increases the overall sensi-tivity of the analysis and precision on the measured signal strength, and increases the sensitiv-ity to deviations of the Higgs boson couplings from their expected values. The tagging aimed at the VH process increases the sensitivity to deviations of the couplings, and the ttH tagging further probes the compatibility of the observed signal with a SM Higgs boson.
The pTspectrum of Higgs bosons produced by the VBF, VH, and ttH processes is significantly
harder than that of Higgs bosons produced by ggH, or of background diphotons. This results in a harder leading-photon pT spectrum. In the tagged-class selections advantage is taken of
this difference by raising the pTrequirement on the leading photon.
6.2.1 Dijet-tagged event selection and BDT classifiers for VBF production
Vector boson fusion production results in two forward jets, originating from the two scattered quarks. Separating events tagged by the presence of dijets compatible with the VBF process into specific event classes not only increases the separation between signal and background, it also increases the separation between signal production processes. In the purest VBF dijet-tagged class the signal is expected to have a contribution of only 18% from ggH production. A loose preselection of dijet events is defined and a dijet BDT is trained to separate VBF signal from diphoton background using samples of MC events satisfying this dijet preselection. Sig-nal events from ggH satisfying the dijet preselection are included as background in the training. Details of the dijet preselection and the BDT input variables are given below. A further, “com-bined”, BDT is then trained. This BDT has only three input variables: the score of the dijet BDT, the score of the diphoton BDT, and the transverse momentum of the diphoton system divided by its mass, pγγ
6.2 Events tagged by exclusive signatures 17
the loose dijet preselection, by placing a minimum requirement on their combined BDT score, and the selected events are then classified using that score.
The dijet preselection is applied to diphoton events satisfying the full diphoton preselection and requires the leading (in pT) and subleading jets in the event, within |η| < 4.7, to have pT > 30 and 20 GeV respectively, and for the pair to have an invariant mass mjj > 250 GeV.
The pseudorapidity requirement (|η| <4.7) is more restrictive than the full detector acceptance (|η| . 5), to avoid the use of jets for which the energy corrections are large and less reliable, and is found to decrease the signal acceptance by<2%. Additionally, the pT threshold of the
leading photon is raised, requiring pγT1 >mγγ/2 for VBF dijet-tagged events.
The jet energy measurement is calibrated to correct for detector effects using samples of dijet, γ+jet, and Z+jet events [39]. The energy from pileup interactions and from the underlying event is also included in the reconstructed jets. This energy is subtracted using an η-dependent transverse momentum density calculated with the jet areas technique [63, 68, 69], evaluated on an event-by-event basis. Particles produced in pileup interactions may be clustered into jets of relatively large pT, referred to as pileup jets. These pileup jets are largely removed using
selection criteria based on the width of the jet or the compatibility of the tracks in a jet with the primary vertex [70]. Finally, jets within∆R < 0.5 of either of the photons are rejected to exclude the possibility of photons having been included in the reconstruction of the jet.
The variables used in the dijet BDT are the scaled transverse momenta of the photons, pγ1
T /mγγ
and pγ2
T /mγγ, the transverse momenta of the leading and subleading jets, p
j1 T and p
j2
T, the dijet
invariant mass, mjj, the difference between the pseudorapidities of the jets,|∆ηjj|, the difference
between the average pseudorapidity of the two jets and the pseudorapidity of the diphoton system,|ηγγ− (ηj1+ηj2)/2|[71], and the absolute difference in the azimuthal angle between
the diphoton system and the dijet system,∆φγγjj. Because of the large theoretical uncertainty in
the cross section due to higher-order contributions to the ggH process accompanied by two jets in the region very close to∆φγγjj = π[54, 72], the maximum value of the variable is restricted to π−0.2; events with∆φγγjj >π−0.2 are treated as if the value was π−0.2.
6.2.2 Lepton-, dijet-, andEmissT -tagged event classes for VH production
The selection requirements for the classes aimed at selecting events produced by the VH pro-cess have been obtained by minimizing the expected uncertainty in the measurement of signal strength of the process, using data in control regions to estimate the background and MC signal samples to estimate the signal efficiency. Four classes are defined: events with a muon or an electron are separated into two classes, according to whether there is significant ETmiss or an-other lepton in the event, or there is not; a third class selects events with two or more jets; and the fourth class consists of events with large Emiss
T . The leading photon in the events selected
for the lepton classes and for the EmissT -tagged class is required to satisfy pγT1 >3mγγ/8; for the
dijet-tagged VH class the requirement is tighter, pγ1
T >mγγ/2.
Muons are reconstructed with the particle-flow algorithm and are required to be within|η| < 2.4. A tight selection is applied, based on the quality of the track and the number of hits in the tracker and muon spectrometer. A strict match between the tracker and the muon spectrom-eter segments is also applied to reduce the contamination from muons produced in decays of hadrons and from beam halo interactions. Finally, a loose particle-flow isolation requirement is applied.
Electrons are identified as clusters of energy deposited in the ECAL matched to tracks. Electron candidates are required to have an ECAL supercluster within the same fiducial region as for
18 6 Event classification
photons. Electron identification is based on a multivariate technique [14]. The electron track has to fulfil requirements on the transverse and longitudinal impact parameter with respect to the electron vertex and cannot have more than one missing hit in the innermost layers of the tracker. Electrons from conversions are excluded as described in Ref. [73] and a loose particle-flow isolation requirement is applied.
The tightly selected lepton class (“VH tight`”) is characterised by the full signature of a lepton-ically decaying W or Z boson, and requires, in addition to the electron or muon, the presence of ETmiss > 45 GeV or another lepton of the same flavour as the first and with opposite sign. For the lepton plus ETmiss signature the pT of the lepton is required to be greater than 20 GeV.
For the dilepton signature the lepton pT requirement is relaxed to pT > 10 GeV, but the
in-variant mass of the pair is required to be between 70 and 110 GeV. For the loose lepton class (“VH loose `”) only a single electron or muon with pT > 20 GeV is required but additional
requirements are made to reduce background from leptonic decays of Z bosons with initial- or final-state radiation: muons and electrons are required to be separated from the closest pho-ton by∆R > 1.0, and the invariant mass of electron-photon pairs is required to be more than 10 GeV away from the Z-boson mass. In addition, a conversion veto is applied to the electrons to reduce the number of electrons originating from photon conversions.
Events selected for the dijet-tagged VH class are required to have a pair of jets with pT >
40 GeV, within the region|η| < 2.4, and with an invariant mass within the range 60 < mjj <
120 GeV; additional jets may also be present. The pT of the diphoton system is required to
satisfy pγγT > 13mγγ/12. The selection also exploits the expected angular distribution of the
diphoton pair with respect to the dijet pair from the vector boson decay. The angle, θ?, that the diphoton system makes, in the diphoton-dijet centre-of-mass frame, with respect to the direction of motion of the diphoton-dijet system in the lab frame is computed. The distribution of cos θ?for signal events coming from VH production is rather flat, whereas background and signal events from ggH production result in cos θ?distributions strongly peaked at|cos θ?| =1. Consequently|cos θ?| <0.5 is required.
For the EmissT tag, additional selection criteria are applied on the azimuthal angular separa-tion between the diphoton system and the ETmissdirection,|∆φγγEmiss
T | > 2.1, and between the
diphoton system and the leading jet in the event, |∆φγγj1| < 2.7. Discrepancies between data
and simulated events in the direction and magnitude of the EmissT vector have been studied in detail and a set of corrections derived, some of which need to be applied to simulated events, and others to data. The corrected Emiss
T is required to satisfy EmissT >70 GeV.
In addition to the requirements described above, a minimum requirement is also made on the diphoton BDT classifier score for entry into the event classes tagging VH production. The severity of the requirement is optimized for each class: 0.17 for the two lepton-tagged classes, 0.62 for the EmissT -tagged class, and 0.76 for the VH dijet-tagged class, where the numerical scale is the classifier score shown in Figs. 6 and 7.
6.2.3 Event classes tagged for ttH production
The production of Higgs bosons in association with top quarks has a small cross section, and so the overall cross section times branching fraction of the decay to photons is only 0.3 fb at NLO. Therefore, in the full dataset only a handful of events are expected. To maximize signal efficiency we devise event selections that collect both leptonic and hadronic decays of the top quarks, defining both a lepton-tagged and a multijet-tagged event class.
6.3 Classification of VBF dijet-tagged and untagged events 19
produced by the ttH process have been obtained by minimizing the expected uncertainty in the measurement of signal strength of the process, using data in control regions to estimate the background, and MC signal samples to estimate the signal efficiency. The leading photon is required to have pγ1
T > mγγ/2. Jets are required to have pT > 25 GeV and both classes require
the presence of at least one b-tagged jet. The lepton tag is then defined by requiring at least one more jet in the event and at least one electron or muon with pT>20 GeV, and the multijet tag is
defined by the requirement of at least four more jets in the event and no lepton. Requirements are also made on the minimum diphoton BDT classifier score for entry into the two classes tagging ttH: 0.17 for the lepton class, and 0.48 for the multijet class, where the numerical scale is the classifier score shown in Figs. 6 and 7. For the 7 TeV dataset the events in the two classes are combined after selection to form a single ttH event class.
6.3 Classification of VBF dijet-tagged and untagged events
Classes for the VBF dijet-tagged events and the untagged events are defined using the scores of the classification BDTs: the combined dijet-diphoton BDT score is used to select and define the dijet-tagged classes, and the diphoton BDT score defines the untagged class into which the untagged events are placed. The BDT score requirements that constitute the event class bound-aries are set by an optimization procedure, using simulated event samples, aimed at minimiz-ing the expected uncertainty in the signal strength. To avoid biases, the simulated events are divided into three non-overlapping sets, which are then used only for the training of the BDTs, or the optimization of event class boundaries, or to model the signal in the extraction of the final results. The number of available simulated events limits the statistical precision in the op-timization procedure. The small number of simulated events for some background processes where one or more of the photon candidates result from misidentified jet fragments, results in a very uneven and spikey distribution of the event classifier scores for the simulated background in the range of BDT scores in which there is some contribution from these processes, but it is rare. So, for the event class boundary optimization procedure, the event classifier BDT scores are smoothed, using an adaptive-width Gaussian smoothing in the ROOFITpackage [74]. Dif-ferences in performance of less than about 2% are indistinguishable from statistical fluctuations and are regarded as insignificant.
As a result of the optimization procedure, four untagged event classes and two VBF dijet-tagged classes are defined for the 7 TeV dataset. For the 8 TeV dataset five undijet-tagged and three tagged classes are defined. Events that fail the requirement on the combined dijet-diphoton BDT score to enter the VBF dijet-tagged classes may enter other event classes. Un-tagged events that have a diphoton BDT score less than the lower boundaries of the unUn-tagged classes in the two datasets are not used in the final statistical analysis. The goal of the opti-mization setting the diphoton BDT score requirements, which define the untagged classes, is to minimize the expected uncertainty in the overall signal strength measurement. The goal of the optimization for the setting of the combined dijet-diphoton BDT score boundaries, which de-fine the VBF dijet-tagged classes, is to minimize the expected uncertainty in the signal strength associated with the VBF production mechanism. When optimizing the boundaries for the 7 TeV dataset, for which the number of MC background events available is particularly limited, the number of tagged classes is limited to two and the lower boundary of the lowest dijet-tagged class is fixed so that the same efficiency times acceptance is obtained for VBF signal events as in the 8 TeV dataset.
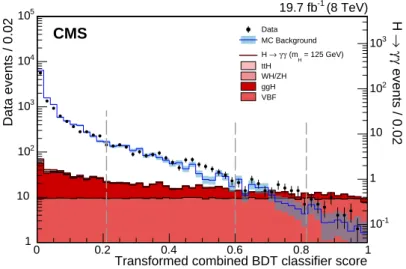
Figure 8 shows the combined dijet-diphoton BDT score for events satisfying the dijet preselec-tion in 8 TeV data, and for simulated signal events from the four producpreselec-tion processes. The out-lined histogram is for simulated background events; the shaded error bands on the histogram
20 6 Event classification
Transformed combined BDT classifier score
0 0.2 0.4 0.6 0.8 1 -1 10 1 10 2 10 3 10 1 10 2 10 3 10 4 10 5 10 (8 TeV) -1 19.7 fb CMS Data events / 0.02 events / 0.02 γγ → H Data MC Background = 125 GeV) H (m γ γ → H ttH WH/ZH ggH VBF
Figure 8: Score of the combined dijet-diphoton BDT for events satisfying the dijet preselection in 8 TeV data (points with error bars, left axis) and for simulated signal events from the four production processes (histograms, right axis). The outlined histogram is for simulated back-ground events; the shaded error bands on the histogram show the statistical uncertainty in the simulation. The vertical dashed lines show the boundaries of the event classes, with the leftmost dashed line representing the score below which events are not included in the VBF dijet-tagged classes, but remain candidates for inclusion in other classes. The classifier score is transformed such that signal events produced by the VBF process have a uniform, flat, distri-bution.
show the statistical uncertainty in the simulation. The VBF dijet-tagged class boundaries used for the 8 TeV dataset are shown by vertical dashed lines. The classifier score is transformed such that signal events produced by the VBF process have a uniform, flat, distribution across the full range of the score. This allows the visualization of the extent to which signal events produced by the VBF process are favoured over background (which predominates in the data), and signal events produced by other processes. Events with scores below the lower boundary fail the VBF dijet-tagged selection, but remain candidates for inclusion in other classes.
The lower boundary on the untagged event class with the lowest signal-to-background ratio controls the total number of events used in the analysis and the overall signal efficiency times acceptance of the analysis (see Fig. 6). The boundary excludes events with very low score in the diphoton BDT for which the background is poorly modelled by MC simulation. Exclusion of these events has the advantage of allowing a better assessment of the expected sensitivity of the analysis, but the exact placement of the boundary is of little consequence.
It is found that, within the statistical uncertainty described above, it makes no difference if the optimization goal is the expected overall uncertainty in signal strength, the expected signifi-cance of the signal, or the expected uncertainty in the measured signal strength associated with the VBF production mechanism. It is also found that the performance maxima that fix the event class boundaries are rather shallow, so that the boundaries can be moved without significantly changing the expected performance. Adding further event classes for either the untagged or the VBF dijet-tagged events does not significantly improve the expected performance.
The overall efficiency times acceptance for SM Higgs boson events with mH=125 GeV is 49.3%
(48.6%) in the 8 (7) TeV analysis. Investigating the properties of the simulated signal events in the untagged classes reveals, as expected, that the best untagged class (“untagged 0”) contains events in which the diphoton system has high pT(almost all events have pTγγ>80 GeV), while