1
SLUM MAPPING
A comparison of single class learning and expert system
object-oriented classification for mapping slum settlements in
Addis Ababa city, Ethiopia.
II
SLUM MAPPING
A comparison of single class learning and expert system object-oriented
classification for mapping slum settlements in Addis Ababa city,
Ethiopia.
Dissertation supervised by; Joel Silva (Supervisor) Mario Caetano (Co-supervisor) Ignacio Guerrero (Co-supervisor)
III
ACKNOWLEDGMENTS
It is a great pleasure for me to acknowledge the assistance provided to me and the contributions made by different organizations and individuals during my study and the thesis work. First and foremost, I would like to thank the Almighty God that enables me to complete this study.
I would like to express my gratitude and sincerest thanks to my supervisor Joel Silva, for his constructive comments and support from the very beginning of my thesis up to now. This thesis could not have been realized without his support. I am also grateful to my co-supervisors Mario Caetano, and Ignacio Guerrero for their critical comments in my thesis work. My special appreciation goes to Marco Painho for his guidance and support in any matter throughout my study.
I would like to take this opportunity to thank the Digital Globe Foundation for providing GeoEye-1 satellite images for this thesis as well as for delivering ERDAS Imagen software. I would also like to thank the Institute for Geoinformatics (IFGI), the University of Münster for providing eCognition software for this research. Moreover, I would also like to thank the European Union for the financial support and for allowing me to pursue my education.
It’s beyond words on how to express my heartfelt gratitude to my fiancée Mahi. Mearey Nayey you have been a constant source of love, and concern throughout my study, thank you. Furthermore, I would also like to thank my family, friends, and teachers who were always on my side with their advice and encouragement.
IV
SLUM MAPPING
A comparison of single class learning, and expert based object-oriented
classification for mapping slum settlements in Addis Ababa city,
Ethiopia.
ABSTRACT
Updated spatial information on the dynamics of slums can be helpful to measure and evaluate the progress of urban upgrading projects and policies. Earlier studies have shown that remote sensing techniques, with the help of very-high resolution imagery, can play a significant role in detecting slums, and providing timely spatial information. The main objective of this thesis is to develop a reliable object-oriented slum identification technique that enables the provision of timely spatial information about slum settlements in Addis Ababa city. It compares the one-class support vector machines algorithm with the expert defined classification rule set in the discrimination of slums, using GeoEye-1 imagery. Two different approaches, called manual and automatic fine-tuning, were deployed to determine the best value of parameters in one-class support vector machines algorithm. The manual fine-tuning of the parameters is done using extensive manual trial. The automatic tuning is done using cross-validation grid search with the overall accuracy as the performance metric. Two regions of study were defined with different landscape compositions, providing different classification scenarios to compare the classification approaches. After image segmentation, twenty predictive variables were computed to characterize the objects in both study areas. An image analyst collected one hundred sample objects of a slum to be used as training for the single-class learner. In parallel, an image analyst has defined a hierarchical rule set to discriminate the class of interest. Results in both study areas indicate that the one-class support vector machine with manual tuning yields higher overall accuracy (97.7% in subset 1, and 92% in subset 2) and requiring much less application effort and computing time than the expert system.
V
KEYWORDS
Remote sensing Slum mapping GeoEye-1 Image segmentation Image classificationObject-oriented image analysis Single class learning
One class support vector machine Expert system classification Automatic tuning
Manual tuning Addis Ababa city
VI
ACRONYMS
OCSVM – One Class Suppor Vector MechineNDVI – Normalized Difference Vegetation Index
UN-Habitat – United Nations Human Settlements Programme
SVM – Support Vector Machine
VHR – Very High Resolution
NIR – Near-Infrared
MRS – Multi-Resolution Segmentation
SDS – Spectral Difference Segmentation
UTM – Universal Transverse Mercator
WGS – World Geodetic System
N – North
AAILIC – Addis Ababa Integrated Land Information Center
m – meter
nm – nanometer
°C – Degree centigrade
VII
INDEX OF THE TEXT
Page ACKNOWLEDGMENTS ... III ABSTRACT ... IV KEYWORDS ... V ACRONYMS ... VI INDEX OF THE TEXT ... VII INDEX OF TABLES ... IX INDEX OF FIGURES ... X
1. INTRODUCTION ... 1
1.1. Slum mapping techniques ... 2
1.2. Problem statement ... 3
1.3. Research objective ... 4
1.4. Thesis organization ... 4
2. LITERATURE REVIEW ... 5
2.1. Approaches for slum mapping ... 5
2.2. Object based image analysis ... 8
2.3. Image classification techniques... 11
2.3.1. One-class support vector machines ... 14
2.3.2. Expert system classification ... 16
2.4. Comparison and evaluation of classifiers ... 18
3. DATA AND METHODS ... 20
3.1. Introduction ... 20
3.1.1. Study area ... 20
3.1.2. Input data ... 21
3.1.3. Data preprocessing ... 21
3.1.4. Sub-setting and selection of the study areas ... 22
3.2. Object-oriented image analysis ... 24
3.2.1. Image segmentation ... 24
3.2.2. Image object classification ... 27
3.3. Classification accuracy assessment ... 30
VIII
4.1. Results and accuracy assessment of one-class SVM and expert system classifier in
subset 1 ... 32
4.2. Results and accuracy assessment of one-class SVM and expert system classifier in subset 2 ... 37
4.3. Comparison of classifiers ... 40
5. CONCLUSION ... 44
BIBLIOGRAPHIC REFERENCES ... 45
IX
INDEX OF TABLES
Page Table 1. Frequency of methods versus main focus for slum mapping using VHR imagery
(2001 - 2016). ... 8
Table 2. Generic slum ontology ... 10
Table 3. A taxonomy of image classification methods ... 13
Table 4. Binary confusion matrix. ... 18
Table 5. GeoEye-1 satellite data characteristics. ... 21
Table 6. MRS parameters for subset 1 and subset 2. ... 26
Table 7. SDS parameters for subset 1 and subset 2. ... 27
Table 8.The definition of parameters used in the classification of subset 1 and subset 2 ... 28
Table 9. Classes, object feature and their threshold defined to extract and classify objects in subset 1. ... 29
Table 10. Classes, object feature and their threshold defined to extract and classify objects in subset 2. ... 29
Table 11. Parameterization of one-class SVM with automatic and manual fine-tuning in subset 1 and subset 2. ... 30
Table 12. Accuracy result of the classifiers for subset 1 ... 32
Table 13. Accuracy result of the classifiers for subset 2 ... 37
Table 14. Comparison of classifiers. ... 40
X
INDEX OF FIGURES
Page
Figure 1. Slum formation ... 2
Figure 2. Expert system rule-set development ... 17
Figure 3. Map of the study area. ... 20
Figure 4. Typical slum settlements in subset 1. ... 23
Figure 5. Typical slum settlements in subset 2. ... 23
Figure 6. A chart displays the process of the thesis. ... 25
Figure 7. Image segmentation ... 27
Figure 8. The implication of sensitivity results on the generated maps.. ... 33
Figure 9. An example shows underprediction of positive class in subset 1 ... 35
Figure 10. Example of misclassified class in subset 1(a) ... 35
Figure 11. Example of misclassified class in subset 1(b) ... 36
Figure 12. The implication of sensitivity results and cross-validation grid search (automatic tuning) on the generated maps ... 38
Figure 13. Example of misclassified class in subset 2 ... 39
Figure 14. Homogeneity of buildings in subset 1 ... 41
1
1. INTRODUCTION
The proliferation of the term slum traced back to the 1820s, used to identify the poorest quality housing and the most unsanitary conditions; a refuge for marginal activities including crime, and drug abuse (Elias, 2008). Although slums share some similarities at a global level, their characteristics vary between regions and countries that reflect local cultures and conditions (UN-Habitat, 2003). Consequently, slums are perceived and named in various ways, which makes the international comparison and monitoring of slums difficult, and the actions and policies that should be implemented to improve the slums complex (Calderon, 2008).
In a general way UN-Habitat, 2003 defined slum as - a heavily populated urban area characterized by substandard housing and squalor. The Cities Alliance action plan also defines slums as - neglected parts of cities where housing and living conditions are appallingly poor. Slums range from high-density, squalid central city tenements to spontaneous squatter settlements without legal recognition or rights, sprawling at the edge of cities. These definitions bring together the vital characteristics of a slum, which are: high densities, lack of formality, low standards of housing both in structure and services, squalor and poor environments, as well as lack of legality (Lemma et al., 2006).
Slums are spontaneously emerging as a dominant type of settlement especially in the cities of the developing world (United Nations, 2015). Since 2000, the global slum population grew on average by 6 million a year which means an increase of 16,500 People daily. In Sub-Saharan Africa, 59 percent of the population lives in slums (United Nations, 2015).
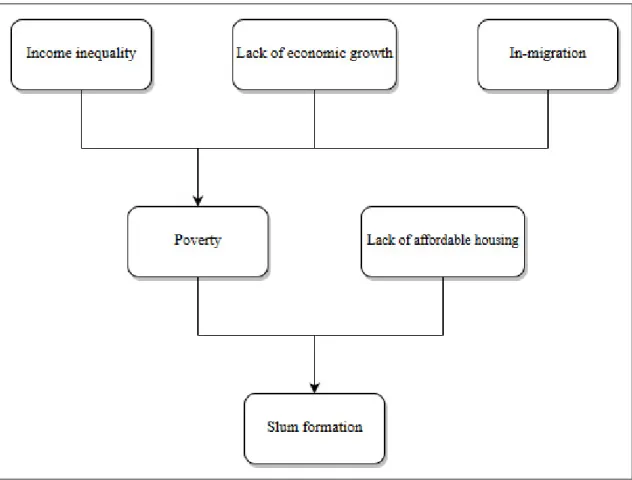
Slum settlements result from a combination of poverty with inadequacies in the housing provision system, so that poor people are forced to seek affordable accommodation and land that become increasingly inadequate. The numbers of urban people in poverty are, to a large extent, outside the control of city governments, and are exacerbated by a combination of economic stagnation, increasing inequality and population growth, especially growth through in-migration (UN-Habitat, 2013). Figure 1 below portrayed the situation of slum formation.
2
Figure 1. Slum formation (UN-Habitat, 2003)
1.1. Slum mapping techniques
The rapid expansion of slum settlements, especially in the cities of developing countries, is a major area of concern for local, national and international organizations. The initial step in slum eradication activities is the access to reliable spatial and other related data about slums, which in turn leads to the need for a reliable data collection technique that can help in evaluating the performance of slum eradication policies and programs (UN-Habitat, 2010).
Previous studies show that a variety of techniques have been implemented to map slum settlements in different cities. Mapping of slum settlements using a data collected through census survey is one approach for slum mapping. As census data is regularly collected in many countries, mostly every ten years so that it provides a stimulating option for slum mapping. However, the long temporal gap between two census periods restricted its utility, considering the dynamic nature of urban areas (Kohli et al., 2012). Other slum mapping technique, such as participatory approach, requires the involvement of local
3
people and expertise at various levels. Thus, it is time-consuming and resource-intensive technique (Joshi et al., 2002).
With the help of VHR satellite imagery, remote sensing-based slum mapping technique can help to improve the detection and characterization of slum settlements. It can provide spatially disaggregated data and regular information on slums with high temporal consistency, which can be facilitate rapid monitoring and effective intervention of slums by local authorities (Sliuzas et al., 2008, and Kohli et al., 2012).
1.2. Problem statement
The formulation of relevant policies and intervention programs for the improvement of slum neighborhoods requires the understanding of slums in a local context in one hand, and it demands accurate, timely and policy-relevant data on the other hand (Lemma et al., 2006). However, many policies and planning decisions made in many developing countries are taken without access to adequate data, which possibly increases the risk of inappropriate measures being adopted (Sliuzas, 2004).
In line with this, the identification of slum settlements in Addis Ababa city is mainly undertaken based on administrative definition (Political decision) of slums and sometimes based on socio-economic indicators. This technique provides only the number of slum dwellers rather than delivering maps of slum extents which would provide a much-needed picture of the locations, extents, and densities of slums in the city. Thus, informed decision making in slum intervention programs, by excluding spatial characteristics of slum settlements, has been hardly possible in the city. There is a lack of adequate and timely available spatial data, and scarcity of baseline information about slums. In addition to this, the context and characteristics of slum settlement at the local level (city level) have not been well assessed.
Therefore, the above-stated problems call upon a search for reliable slum detecting procedures and techniques in the city. As stated in Sliuzas et al. (2008), remote sensing techniques, with the help of VHR imagery, can play a significant role in detecting slum settlements and providing timely spatial information. Obtaining updated spatial information about slum settlements also would have great importance for any decisions
4
and can be helpful to measure and evaluate the progress of slum eradication policies (Kohli et al., 2013). Moreover, it allows to link the urban morphology with socioeconomic parameters and offer essential baseline information for developing and applying slum upgrading methods adapted to the local context.
1.3. Research objective
The principal objective of this thesis is to develop a reliable object-oriented slum identification technique that enables the provision of timely spatial information about slum settlements in Addis Ababa city. Specifically, this thesis is intended to;
• Evaluate the performance of one-class support vector machines classification for mapping slums.
• Assess the performance of expert system classification to identify and classify slums.
• Compare the accuracies and time consumption of one-class support vector machines, and expert system classification for slum mapping.
1.4. Thesis organization
This thesis is organized into five sections. The first section introduces the concept of slum and slum situations in the world. In addition, it provides a short introduction of slum mapping techniques followed by the statement of the problem, and the research objectives. Section two covers a literature review, where the theoretical and conceptual issues used to frame this study is discussed. Section three presents the data and methods used for the study. The result and discussion part of this thesis is presented in section four. Finally, Section five includes the main conclusions of the thesis.
5
2. LITERATURE REVIEW
The purpose of this section is to discuss the theoretical and conceptual issues used to frame the study. It is organized in two parts. The first subsection deals with the approaches to slum mapping, followed by details in object-oriented image analysis. The second subsection focus on the image classification techniques, and comparison and evaluation of classifiers.
2.1. Approaches for slum mapping
Previous studies show that there are three different slum mapping approaches based on the type of data used for mapping the slums. These are (i) Census-based approach, (ii) Participatory approach, and (iii) Remote sensing-based approach. As the focus of this thesis is on the remote sensing-based approach for slum mapping, less attention is giving to the census-based and participatory approaches.
Census-based approach
The census-based approach for slum mapping is based on the data collected through census survey. Census data contains detail data on social, economic and infrastructure aspects of the inhabitants in a country at the level of an enumeration unit. Weeks and others used census data from Accra, Ghana, to create a slum index based on the UN slum indicators for a place to be a slum and using it to measure the concentration of slums in different neighborhoods of the city. According to their study, a high correlation was found between the slum index, the socio-economic characteristics of neighborhoods and certain land cover characteristics derived from very high-resolution satellite imagery (Weeks et al., 2007). The prominent advantage of using this approach is that census data are routinely collected in many countries so that it provides detail information at the household level and provides an interesting option for slum mapping. However, the long temporal gap between two census periods, especially in developing countries, restricted its utility, considering the rapid changes that can occur in the slum areas (Kohli et al., 2012).
Participatory approach
Participatory approach for slum mapping is undertaken with the cooperation of the slum residents in mapping the details of slum settlement at the individual or household level
6
(Joshi et al., 2002). Lemma and others implemented a participatory approach using rapid appraisal techniques, that integrate local knowledge with GIS and remote sensing techniques for the identification and spatial analysis of slums on selected three sub-cities of Addis Ababa city. Their approach incorporates an input from stakeholders through the combination of focus group discussion, field observation and visual image interpretation using satellite images and aerial photographs (Lemma et al., 2006). Participatory approaches for slum mapping can help to generate spatial and non-spatial information in the form of thematic GIS layers that provide additional information to socio-economic surveys and included in slum related policy development and planning. However, the detailed level of information provided by the participatory approach is time-consuming. This technique may be difficult to upscale to larger areas, especially in cities with extensive slum settlements like in Addis Ababa. (Kohli et al., 2013).
Remote sensing-based approach
The remote sensing-based approach for slum mapping uses image processing techniques to map slums from satellite imagery. With the help of remote sensing techniques, it is possible to provide spatially disaggregated data with high temporal consistency, which can facilitate rapid monitoring and effective intervention of slums by local authorities. Moreover, remote sensing techniques reduced enumeration resources and can systematically generate citywide slum maps (Kohli et al., 2013).
Visual interpretation from very high-resolution images has been used to extract concentrations of slum areas (Sliuzas et al., 2008). Baud et al 2010, used very high-resolution images to identify precise patterns within slum areas using physical variables such as built-up density, building size, and physical site suitability. Extensive local expert knowledge is needed to produce reliable results using visual interpretation methods. The process of visual interpretation of VHR orthophotos is not automated, but requires extensive expert knowledge, systematic search and additional data to ensure effective identification of slum settlements. This technique is time-consuming and is not feasible for searching over extensive areas (Ward & Peters, 2007). Furthermore, it is not independent way of slum mapping technique, and unable to detect the time space dynamics of slum settlements.
7
Jain (2007) point out that, studying the development of informal settlement through image classification could explain the patterns over time and space. Weeks et al (2007) used pixel-based image classification to classify slum neighborhoods in Accra, Ghana. However, Myint et al point out that the application of pixel-based classification in slum mapping is incapable of representing the heterogeneity of an urban environment (Myint et al., 2011).
Very high-resolution airborne and satellite imagery in meter or submeter level has generated a new era in the information extraction of slum areas based on object-oriented image analysis techniques. Object-based image analysis approach can capture the heterogeneity of urban environment through following a hierarchy for object-classification that includes contextual information for objects and non-physical features (Hofmann, 2001).
Using very high-resolution images, object-based image analysis techniques for classification have demonstrated to be accurate in urban applications (Cleve et al., 2008; Sliuzas et al., 2008). Kuffer et al 2016, reviewed multiple techniques for slum mapping undertaken for 15 years (2001 - 2016) using very high-resolution imagery by focusing on the most promising methods with respect to extracted information level (objects or areas) and achieved accuracies (Table 1).
Though, the techniques to extract slums are rather diverse (Table 1 columns), the most frequently used method in the 15 years (2001- 2016) was object-based image classification approach (34.6%). Apart from object-based image analysis, visual image interpretation (17.95%) and pixel-based image classification were employed (10.25%). However, the reliance on standard pixel-based classification methods is not that appropriate for analyzing a complex urban environment having high spectral diversity, very small and clustered objects and diverse morphological characteristics (Kuffer et al., 2016). Though visual interpretation method for slum mapping is labor intensive, it is still used for slum identification, producing reliable results using expert interpretations (Kuffer et al., 2016).
8
METHODS
F
O
CUS
ML OBA PBA SM Tex. VI Total [%]
Analysis of types of slum area 1 1 0 1 1 2 6 (7.7)
Identification of slum Areas 8 15 3 2 9 11 48 (61.5)
Extraction of objects 0 7 0 0 1 1 9 (11.5)
Land use/cover Mapping 2 4 5 1 3 0 15 (19.3)
Total [%] 11 (14) 27 (34.6) 8 (10.25) 4 (5.12) 14 (17.95) 14 (17.95) 78 (100)
Table 1. Frequency of methods versus main focus for slum mapping using VHR imagery (2001 - 2016), Where VI is Visual Interpretation, Tex. is texture, SM is statistical model, PBA is pixel-based approach, OBA is object-based approach, ML is machine learning (Kuffer et al., 2016).
Therefore, as this thesis is using very high-resolution (0.5 meters) GeoEye-1 satellite imagery for identifying slum settlements in Addis Ababa city, I found the object-based image analysis techniques for classification accurate and suitable to achieve the objectives of the research.
2.2. Object based image analysis
Together with the increasing accessibility of very high-resolution satellite imagery, accurate identification, and extraction of ground objects using object-oriented approach has become increasingly important for a variety of remote sensing and GIS applications (Zhang & Maxwell, 2006).
The use of object-oriented approach is motivated among others by the fact that mostly the expected result of image analysis (especially using very high-resolution imagery) tasks is the extraction of real-world objects, proper in shape and classification. This expectation cannot be fulfilled by traditional pixel-based approaches, because an object in high-resolution imagery is usually composed of heterogeneous pixels with different spectral attributes (Giada et al., 2003). In addition to this, Pan-sharpened images is problematic for pixel-based classification because the pixel spectral values are artificial.
The important information necessary to interpret an image is represented in meaningful image objects. In comparison to pixels, image objects carry much more useful
9
information. Thus, they can be characterized by far more properties such as form, texture, neighborhood or context, than pure spectral or spectral derivative information (Conchedda et al., 2008).
Object-oriented image analysis uses the advantage of image segmentation which is the hierarchical network of image objects. An image object is a group of pixels in which each object represents a definite space within a scene and objects can provide information about this space (Definiens, 2015). The advantages of object-oriented analysis are the meaningful statistic and texture calculation, and the close relation between real-world objects with the segmented image objects. This relation improves the result of the final classification and cannot be fulfilled by common, pixel-based approaches (Giada et al., 2003).
Similarly, in the case of urban slum identification Jain (2007) found out that it is difficult to represent the heterogeneity of an urban environment with a pixel-based classification approach using only spectral values. Object-oriented image analysis has proved to be useful and accurate in urban classification applications (Cleve et al., 2008; Sliuzas et al., 2008).
Urban areas comprise a mix of land cover features, and object-oriented image analysis method enables identification of buildings, roads, and other anthropogenic features more accurately (Myint et al., 2011). It is more valuable in the case of slum settlements, which can have a relatively complex and undefined morphology by offering the potential to integrate spectral, spatial and contextual characteristics for classification (Hofmann, 2001). In a nutshell, Cleve et al., (2008) have demonstrated that an object-based approach, using high-resolution satellite imagery provided 41.73% greater accuracy than pixel-based classification for built area category.
The Advantages of using object-based image analysis are coupled with higher levels of complexity in terms of deriving real-world knowledge through remote sensing. Therefore, it is important to understand and integrate epistemological and ontological aspects of real-world to conceptualize the spatial characteristics of slums for object-based image analysis. (Blaschke et al., 2008).
10
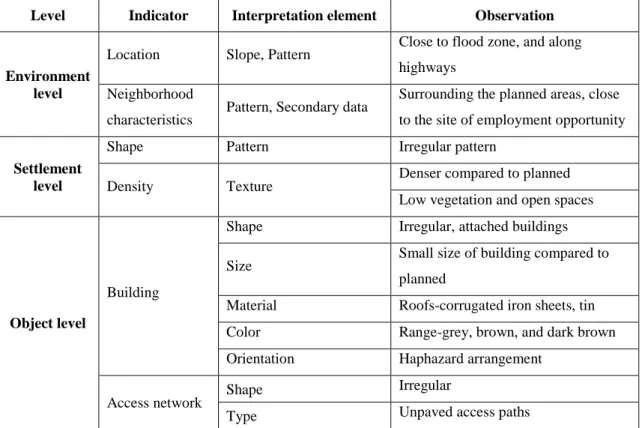
Kohli et al, 2012, develops an ontological framework to conceptualize slums using input from fifty domain experts covering sixteen different countries, named as Generic slum ontology. This generic slum ontology comprises concepts identified at three levels that refer to the morphology of the built environment. These are; the environment level, the settlement level, and the object level. The ontology can, thus, serves as a comprehensive basis for image-based classification of slums, particular using object-oriented image analysis techniques (Kohli et al., 2012).
Level Indicator Interpretation element Observation
Environment level
Location Slope, Pattern Close to flood zone, and along
highways Neighborhood
characteristics Pattern, Secondary data
Surrounding the planned areas, close to the site of employment opportunity
Settlement level
Shape Pattern Irregular pattern
Density Texture
Denser compared to planned Low vegetation and open spaces
Object level
Building
Shape Irregular, attached buildings
Size Small size of building compared to
planned
Material Roofs-corrugated iron sheets, tin
Color Range-grey, brown, and dark brown
Orientation Haphazard arrangement
Access network Shape
Irregular
Type Unpaved access paths
Table 2. Generic slum ontology (Kohli et al., 2012)
As described in Table 2, building and road characteristics are major components of the ontology at the object level. At the settlement level, texture measures can be potentially used to represent the contrast between planned and unplanned settlements. At the environment level, external factors which extend beyond the site itself are important indicators. The observation was undertaking in slum areas of Kisumu, India. These characteristics may be different for other study areas but show the applicability of the developed framework.
11
In a nutshell, the slum ontology helps to understand and obtain slum information at different levels. Acquiring basic knowledge of the study site is important for developing and setting up rules and methods for the image analysis and classification stage. The next subsection will focus on the image classification techniques and comparison and evaluation of classifiers.
2.3. Image classification techniques
Remote sensing is an attractive source of thematic maps such as those depicting land cover as it provides a map-like representation of the Earth’s surface that is spatially continuous and highly consistent, as well as available at a range of spatial and temporal scales. Thematic mapping from remotely sensed data is typically based on an image classification (Foody, 2002). Image classification is the process of extracting valuable information from massive satellite imagery by categorizing the image pixel values or image objects into meaningful categories. The idea behind image classification is that different features on the earth's surface have a different spectral reflectance (Lillesand & Keifer, 2004). There are several methods and techniques for satellite image classification. The development of image classifiers has been subject to ongoing research since the introduction of remote sensing. Each image classification technique has its own strengths and weaknesses relative to applications to which they may be applied (Lawrence & Wright 2001; Mather 2004). Satellite image classification methods can be broadly classified into two categories as; unsupervised classification, and supervised classification. With their own merits and demerits.
Unsupervised classification technique uses clustering mechanisms to group satellite image pixels into classes. Here, the analyst decides the number of classes to generate and which bands to use for classification. Based on this information, the image classification algorithm generates the intended classes. It is often the case that multiple clusters represent a single land cover class. The analyst merges clusters into a single land cover class so as to produce satisfactory classification result. This classification technique is commonly used when no training sample sites exist. There are two most frequent clustering methods used for unsupervised classification, namely, K-means and iterative self-organizing data
12
analysis technique. These two methods rely on pixel-based statistics and doesn’t incorporate prior knowledge of the characteristics of the themes under study (Brown de Colstoun et al., 2003).
On the other hand, supervised classification is a method in which the analyst collects a training sample which are the representative samples for each land cover class. In supervised classification, the analyst is required to be familiar with the area covered by the satellite image and the spectral properties of the land cover classes (Jawak et al., 2015). As the accuracy of the outcome of the classifier is heavily dependent on the training areas, which are used to train the classifier to recognize unknown areas, there must be carefully chosen. Insufficient chosen or incorrectly defined training areas will result in lower overall accuracy (Campbell, 2006; Mather, 2004). The common supervised classification algorithms are the minimum distance, maximum likelihood classifier, K-nearest neighbor, support vector machines, and spectral angle mapper (Jawak et al., 2015).
Satellite image classification is a complex and time-consuming process, which is affected by a wide variety of factors. When deciding on a classification method for an application, a user must compare the importance of several different factors. Efficacy of classification methods is usually judged in the literature according to the statistical accuracies of the final classification. However, the demand for human expertise, the time and expense of preparing and running the classifier, and the degree of automation required are aspects which must be considered (Pal & Mather, 2003). It should also be noted that the accuracies of different classification methodologies are often specific to the application to which they are put (Liu et al., 2002). It is therefore important that the user be aware of the different types of classifiers available, to judge which is better suited to the application at hand. The selection of suitable classification algorithm is also depending on the spatial resolution of the used satellite imagery. In the case of high-resolution data such as GeoEye-1, IKONOS, and World View-2, object-oriented classifiers may outperform the per-pixel classifier. In the case of medium and coarse spatial resolution, sub-pixel classifiers have proved to be more useful than per-pixel classifiers because of the mixed pixels problem. In this case, the loss of spatial information makes spectral information
13
more important than spatial one. Moreover, ancillary data can be also integrated with spectral data for improved classification results (Prasad et al., 2015).
Criteria Categories Characteristics Example
Training Sample
Supervised - Use training sets to classify pixels of unknown
identity.
MD MXL
Unsupervised - Divides pixels into number of classes based on
natural groupings. K-means ISODATA Assumptions on Data distribution Parametric
- Based on assumption of Gaussian distribution.
MXL - Mean vector and covariance matrix are generated
from training samples.
Non-Parametric - No prior assumptions about data distribution.
ANN SVMs Expert system Number of Outputs
Hard (crisp) - Each pixel shows membership to single class.
MXL MD ANN SVMs Soft (fuzzy)
- Each pixel exhibits partial class membership. MXL
- Produces more accurate result. ANN
FCM
Pixel Information
Per-pixel classifier
- Pixel by pixel classification. MXL
- Generates signatures by using the spectra of all
training pixels. ANN
- Low accuracy because of the impact of mixed pixel problem.
SVMs MD Sub-pixel
classifiers
- Provides membership of each pixel to each class. SMA
- Has the capability to handle the mixed pixel problem.
Fuzzy - classifiers
Per-field
- Integrates vector and raster data.
GIS-based approaches
- Suitable for fine spatial resolutions
Object-oriented
- Pixels are grouped into objects of different shape and scale (segmentation) and then classification is performed based on objects.
e-Cognition software - Additional information such as object texture, shape and relations to adjacent regions can be used. - Suitable especially for HR imagery.
Spatial Information
Spectral - Based on pure spectral information MXL
ANN
Contextual - Spatial measurements related to the
neighborhoods Markov random field Multiple classifiers Hybrid
Systems - Combine the advantages of multiple classifiers
Voting rules Evidential -reasoning Multiple ANN
14
Image classification has made great progress over the past few decades in the development and use of advanced classification algorithms. Supervised and unsupervised classifications can be used as alternative approaches but are often combined to form a hybrid system using more than one methods. On the other hand, when using the new generation of images, characterized by a higher spatial and spectral resolution, it is still difficult to obtain satisfactory results by using supervised and unsupervised techniques alone. As a result, a wide variety of classification approaches are available as presented in Table 3.
The taxonomy of image classification method in Table 3 is based on six different criteria’s. The first criteria depend on whether training samples are used or not in the image classification method, thus, classified as supervised and unsupervised classification approaches. The parametric and non-parametric classifiers are differentiated based on the assumption of data distribution, meaning it depends on whether parameters such as mean vector and covariance matrix are used or not. In Parametric classifiers, gaussian distribution is assumed. However, no assumption about the data is required in non-parametric classifier (Lu & Weng, 2007). The image classification methods are also grouped based on the kind of pixel information used for classification. Per-pixel classifiers typically develop a signature by combining the spectra of all training-set pixels from a given feature. The resulting signature contains the contributions of all materials present in the training-set pixels, ignoring the mixed pixel problems. Whereas, in object-oriented classification, pixels are grouped into objects of different shape and scale (segmentation) and then classification is performed based on objects (Lu & Weng, 2007).
2.3.1. One-class support vector machines
Supervised classification is the most commonly used image classification technique in remote sensing for research application (Mountrakis & Ogole, 2011). One significant advantage of supervised classification is that it allows tailoring the classification process in order to obtain a map depicting only the classes of interest (Foody et al., 2006). Indeed, users are often not interested in a complete characterization of the landscape but rather on a subset of the classes existing in the study area. Fundamentally, the accurate
15
discrimination of some classes is more important than the discrimination of others for some applications (Silva et al., 2017a).
In its beginning, the support vector machine (SVM) was developed to solve binary classification problems. However, the same principles can be applied to solve one-class problems (Schölkopf et al., 2000). This problem consists in detecting from a particular class, often called target class or class of interest. These problems differ greatly from the standard supervised classification in the sense that the training set is composed exclusively by data points from the target class, which is its most attractive feature in terms of focusing effort and resource on the class of interest (Silva et al., 2017b). On the other hand, there are no counterexamples to define the classification space outside the class of interest (Tax, 2001). The one-class classification has been utilized in a variety of applications and has great potential in remotely sensed data processing. There are two approaches to one-class classification based on SVM principles, One-Class Support Vector Machines (OCSVM) and the Support Vector Data Description (SVDD). This thesis is focused on the use of OCSVM. The basic idea behind the OCSVM is to determine a function that signals positive if the given data point belongs to the target class and negative otherwise (Silva et al., 2017b).
The development of a learning algorithm requires the use of accuracy metrics to assess the quality and compare the performance of alternative classifiers. Empirical evidence suggesting that parameter fine-tuning is often more important than the choice of algorithm (Carrizosa & Morales, 2013). Fine-tuning is the process of finding the parameterization of a classification algorithm that yields the maximum overall accuracy (Hastie et al., 2009).
The determination of the best values of the learning algorithm parameters is typically done by cross-validation trials (Friedman et al., 2001). The range of the parameters is divided into a grid, and the training set is broken into parts. Each part is in turn used as a testing set, and all others are used as training set. Then, a classifier is induced using the training set and tested with the testing set. The classification errors yielded with each part are then averaged, and the parameterization with the least classification error is selected (Deng et al., 2012).
16
To fine tune, an OCSVM is harder than to fine tune an SVM (Silva et al., 2017a). The training set of OCSVM does not contain data points outside the class of interest. Thus, it is not possible to assess the overall accuracy nor the specificity of the classifier in the cross-validation grid search process (automatic tuning). Sensitivity can be only assessed effectively. Using the sensitivity alone to parameterize a classification algorithm may result in a classifier with high sensitivity and low specificity, overestimating the extension of the classes of interest. To minimize the effects of this limitation, the cross-validation process can be carried out using the ratio between the sensitivity and the number of support vectors as a metric. This ratio enforces high sensibility while limiting model complexity which usually indicates good model generalization ability (Silva et al., 2017b). Moreover, it is possible to control the sensitivity value of a classification algorithm through manual tuning approach.
2.3.2. Expert system classification
More recent research has examined classification systems which use a set of expert-informed rules in logical structures to determine information classes from the different features within remotely-sensed imagery (Brown de Colstoun et al., 2003). These rule-based classifiers have two distinct advantages over more conventional methods: the logical, flexible and transparent manner in which image information is represented within a rule-set; and the modular arrangement of the rule-set, which allows for easy alterations or updates for classifier improvement (Cohen & Shoshany, 2002).
Expert system satellite image classification approach is an alternative classifier to overcome the limitations of training data. This technique comprises a number of rules which uses prior expert knowledge to define image classes. In the expert system classification approach the classes are assigned is by a set of threshold rules of the “If...Then...Else” structure (Bolstad & Lillesand, 1992). By examining the rule-set, users can familiarize themselves with the more discriminating features for each image class. Figure 2 below displays an example of expert system rule-set development. The primary disadvantage of expert system classification is that the creation of a usable rule-set from expert knowledge is time-consuming. Another disadvantage of rule-based expert systems is it requires a high level of expertise (Liu et al., 2002).
17
Moreover, both the one-class support vector machines and expert system classification approaches have been enhanced by object-orientated methods. Object-orientation image classification involves the delineation and classification of image objects rather than individual pixels, which allows for more meaningful analysis of spectral and textural features.
18
2.4. Comparison and evaluation of classifiers
The design and implementation of a learning algorithm require the use of accuracy metrics to assess the quality and compare the performance of alternative classifiers. For example, when fine-tuning a classification algorithm, it is often necessary to compute an accuracy metric to determine the parameterization that yields on average the highest accuracy value. Although commonly used, the overall classification accuracy (the proportion of correctly classified data points) may not a reliable metric when the training set is imbalanced (Silva et al., 2017a). This is because the majority class dominates the behavior of this metric, and thus it gives optimistically biased results (Xanthopoulos & Razzaghi, 2014). Indeed, the definition of the accuracy metric is particularly important for binary classification, since the performance of the classifiers can be particularly sensitive to the classes relative size (Shalev-Shwartz & Ben-David, 2014; Xanthopoulos & Razzaghi, 2014). In this condition, the results of the fine-tuning process may be unreliable not because of the process but rather because of the accuracy metric employed in the process (Silva et al., 2017a). If the training data set is unbalanced and the classification accuracy is utilized, the outcome of the fine-tuning process will indicate that a particular parameterization is the one with the highest classification accuracy but may indeed biased towards the majority class, since that parameterization may yield a classifier that classifies very accurately the majority class in detriment of the minority class (Hwang et al., 2011). There are better alternative accuracy metrics to the classification accuracy especially when the data set is imbalanced, for example, sensitivity and specificity (Hastie et al., 2009). At the basis of this analysis is the binary confusion matrix (Table 4).
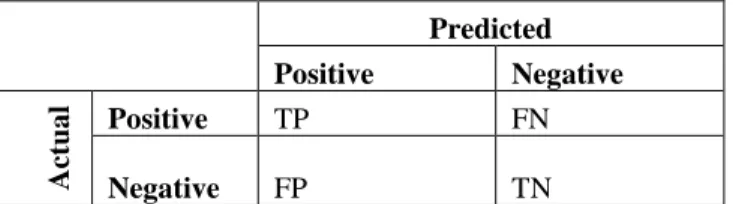
Predicted Positive Negative Act ua l Positive TP FN Negative FP TN
Table 4. Binary confusion matrix.
In Table 4, TP (true positives) represents the number of actual positive classes classified as positive. TN (true negatives) is the number of actual negative classes correctly classified. FP (false positives) represents the number of actual negative classes predicted as positive class, and FN (false negatives) is the number of actual positive classes
19
predicted as negative class. Therefore, classification accuracy is the proportion of true positives and true negatives which is commonly used to metric classification performance in multi-class problems (Silva et al., 2017a). But in binary classification, classification accuracy may not be a reliable indicator because it doesn’t reveal if an error was evenly distributed between classes. Thus, other quality metrics can be used as an alternative, such as sensitivity and specificity (Xanthopoulos & Razzaghi, 2014). Sensitivity refers to the proportion of true positives correctly classified. whereas specificity refers to the proportion of true negatives correctly classified (Hastie et al., 2009). In this way, sensitivity indicates how good the classifier is recognizing positive classes and specificity indicates how good the classifier is recognizing negative classes (Xanthopoulos & Razzaghi, 2014). Since the output classification of this research is binary one overall accuracy, sensitivity and specificity are deployed as a quality matrix. The next chapter of this thesis is focused on data and methods where the data used, and methodology deployed in the study presented.
20
3. DATA AND METHODS
This section examines the methodology used in the creation and application of the two-different object orientated classifications techniques. It is categorized into three major parts. The first part provides details about the study area, data, data processing techniques, and selection of the study areas. The second subsection is about object-oriented image analysis, where the segmentation and classification techniques used in this thesis presented. The final part of this section is dedicated to classification accuracy assessment.
3.1. Introduction
3.1.1. Study area
Addis Ababa, the capital city of Ethiopia, is one of the largest urban centers in sub-Saharan Africa (AAILIC, 2013). Geographically, it is located between 8° 49' 56" and 9° 5' 54" North latitude and between 38° 38' 17" and 38° 54' 20" East longitudes.
21
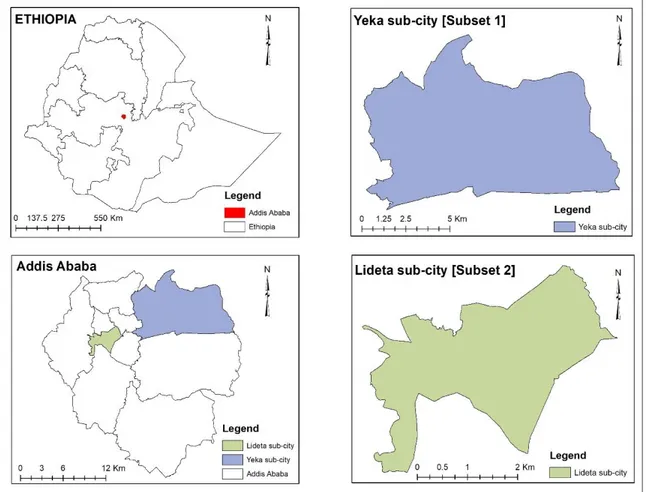
The city is extended to 540 Km2 of land with an altitudinal zone ranging from about 2050 to 2400 meter above sea level. The northern and western part of the city is characterized by high topography, whereas the southeastern and south-western part of the city is relatively flat, separated by a deep gorge and rivers crossing the city from north to the south direction. Long-term mean annual maximum and the minimum temperature of the city is 23 °C and 10.6 °C respectively. Long-term mean annual rainfall of the city is also 1180 mm (AAILIC, 2013). Specifically, the study areas are located in Yeka (Subset 1) and Lideta (Subset 2) sub-cities representing the slum situation in the periphery and central part of Addis Ababa city respectively (Figure 3).
3.1.2. Input data
GeoEye-1 orthoimages
The Very high-resolution (0.5m pixel size) GeoEye-1 images used in this thesis was acquired from Digital Globe Foundation, captured on 30 April 2015. The image dataset has four multispectral bands (red, green, blue, and Near-infrared) and panchromatic band. The images were obtained at the standard processing level, i.e., the geometric correction was done by the image provider, and geographically projected to the UTM zone 37N with WGS 84 Datum. Table 5 below presented the detail characteristics of the satellite image used for classification.
Acquisition
date Image size (Pixel) Spectral range (nm)
Spatial resolution (m)
Radiometric resolution (bits)
30-Apr-2015
Subset-1 1410 x 936 Band 1: Blue 450 - 510 2 x 2
11 Band 2: Green 510 - 580 2 x 2 Subset-2 2013 x 843 Band 3: Red 655 - 690 2 x 2 Band 4: NIR 780 - 920 2 x 2 Panchromatic 450 - 800 0.5 x 0.5
Table 5.GeoEye-1 satellite data characteristics.
3.1.3. Data preprocessing
Panchromatic sharpening
Panchromatic sharpening or commonly known pan-sharpening is the term given to the fusion of a higher resolution panchromatic band with a lower-resolution multispectral
22
bands, for the purposes of increasing the spatial resolution of the multispectral bands (Du et al., 2007; and Rahmani et al., 2010). GeoEye-1 images with a resolution of 0.5m panchromatic and 2m multispectral bands were used for classification in this thesis. A resolution merge by principal components was performed to produce a pan-sharpened image of four bands (Blue, Green, Red, NIR) with a 0.5m resolution.
3.1.4. Sub-setting and selection of the study areas
Due to the heavy computational demands of remote-sensing operations, it is a generally accepted practice to undertake analyses on smaller sections of an entire image. Two subsets of an image were created from the central and north-east part of Addis Ababa city. The size of the subsets was considered to be large enough to contain adequate coverage of the slums and non-slums in the area, while not so large to render object segmentation time impracticable (Table 5). The locations of the subsets were also purposefully chosen to include the different situation of slums in the city center and in the periphery area of Addis Ababa city. Subset-1 is part of the outer city which covers 26 hectares area (Appendix 1a). It comprises the slum (vegetations, road and open space, and non-slum buildings), and non-slum buildings. Subset-2 is part of the city center and is approximately 37 hectares in size (Appendix 1b). Similarly, it includes the slum and non-slum settlements.
In the process of formulating a strategy for identifying and extracting slum settlements from imagery, the contextual slum settlement has to be characterized. The initial identification and characterization of the slum settlement in this thesis is made through visual interpretation integrated with personal professional experience. In Addis Ababa city, buildings are highly variable in terms of size, color, and shape. By means of visual interpretation, using parameters such as building roof color, structure, orientation, road characteristics, as well as amounts and patterns of vegetation and open spaces, it was observed that there are many types of built-up areas. For example, the planned residential areas tend to have buildings that show a well-organized pattern with regular orientation and spacing and are often separated by planned green spaces or vegetation (Typical non-slum settlements). Some areas have buildings with grey, whitish grey or brown roofs with variable green spaces between them, and with a variety of size and orientation (Typical
23
slum settlements). Figure 4 and Figure 5 displays the instances of slum settlements in subset 1 and subset 2 respectively.
Figure 4. Typical slum settlements in subset 1.
24
Although, the slum settlements throughout the city varies considering the above listed characteristics, the selected study areas, as it is depicted in figure 4 and figure 5, are specifically characterized by the following properties:
• A group of single storied, small sized dwellings in a settlement without enough open space and greenery.
• Most of the roofs are constructed from corrugated iron and zinc sheets with variable textures. The color of the roofs occurs mostly bright grey to bright blue and in some parts bright red to dark brown; and
• Irregular patterns of buildings, without any planning orientation.
Acquiring basic knowledge of the study site is important for developing and setting up rules and methods for the image analysis and classification stage. The next subsection will focus on the consideration of the above mentioned physical characteristics of slum settlements in Addis Ababa city to outline the procedure of object-oriented image classification.
3.2. Object-oriented image analysis
Analysis of an image in the object-oriented approach involved classifying the image objects according to class descriptions organized in an appropriate knowledge base. Objects are defined based on the similarity of their spectral values, the contrast with neighboring objects, their own spatial and spectral characteristics, or a combination of these three properties (Giada et al., 2003).
The analysis plan for meeting the objectives of this study is depicted as a flowchart in Figure 6. A detailed description of each step is provided in the following sections. The process of the object-oriented classification mainly involved two parts; these are image segmentation, and image classification.
3.2.1. Image segmentation
The first step in an object-oriented image analysis is image segmentation. The process of image segmentation divides the image into spatially continuous and homogenous regions called image objects (Conchedda et al., 2008). The object-based image analysis software used in this thesis was eCognition version 9.1. eCognition provides a complete tool for
25
object-based image analysis with various segmentation algorithms. Considering the objective of this thesis both multi-resolution segmentation and spectral difference segmentation algorithms are deployed in the analysis. Each segmentation algorithms and their parameters are explained in this part.
Figure 6. A chart displays the process of the thesis.
I. Multi-Resolution Segmentation
Multiresolution segmentation (MRS) is an optimization procedure which, for a given number of image objects, minimizes the average heterogeneity and maximizes their respective homogeneity (Definiens, 2015). The important step in multiresolution segmentation is to assign appropriate values to the key parameters, namely scale, shape, and compactness to segment objects. Here, scale parameter determines the maximally allowed heterogeneity of the objects. A large value of scale parameter results in a low number of relatively large objects, whereas a small value for scale parameter results in a large number of relatively small objects. The parameter shape and color balance the shape versus the spectral homogeneity of objects as the sum of two is equal to one (Kohli et al., 2013). Color defines the digital value of the resulting image objects, and Shape defines the textural homogeneity of the resulting image objects. Each parameter can be weighted from 0 to 1 (Laliberte et al., 2004).
26
The MRS parameters for the study sites are assigned to achieve a realistic segmentation of image objects. All parameters of MRS are assigned through a trial-and-error but systematic experimentation. Several combinations of the parameters are tested, and one optimum set of parameters is selected for each study area based on the visual inspection of the resulting objects, as also described by Im et al., (2008) and Nobrega et al., (2006). The results of scale parameters ranging from 10 to 140 were sequentially tested and visually assessed. A scale parameter of 40 for subset 1 and 35 for subset 2 was determined to be the most suitable for the image segmentation in the respective study areas. A value of 50% was assigned to shape and color, both in subset 1 and in subset 2, to give equal weight to shape and spectral reflectance in the segmentation process.
In addition to scale parameter, shape and color criteria, the contribution of the input image channels in segmentation process is of great importance. Different weight variations were also tested among the layers, with the resulting segmentations visually analyzed for suitability. Finally, equal weight is given to all layers. The resulting multi resolution segmentation parameters for subset 1 and subset 2 are summarized in Table 6.
Area Scale parameter
(No unit) Shape (%) Color (%)
Image layer weight
B G R NIR
Subset 1 40 50 50 1 1 1 1
Subset 2 35 50 50 1 1 1 1
Table 6. MRS parameters for subset 1 and subset 2.
As the results of the image segmentation strongly depend on the image data and the assessment of the segmentation results depends on the classification task, it is almost impossible to suggest well-suited segmentation parameters in general (Hofmann, 2001).
II. Spectral Difference Segmentation
The Spectral difference segmentation (SDS) algorithm merges neighboring image objects according to their mean image layer intensity values. Neighboring image objects are merged if the difference between their layer mean intensities is below the value given by the maximum spectral difference. This algorithm is designed to refine existing segmentation results, by merging spectrally similar image objects produced by previous segmentations (Definiens, 2015). The maximum spectral difference for the study areas is
27
assigned to improve the segmentation process and to achieve more realistic image objects. The same trial-and-error but systematic strategy is also implemented for assigning the SDS parameters in both study areas. The SDS parameters used for subset 1 and subset 2 are summarized in Table 7 below.
Area Maximum spectral difference (No unit) Image layer weight
B G R NIR
Subset 1 25 1 1 1 1
Subset 2 10 1 1 1 1
Table 7. SDS parameters for subset 1 and subset 2.
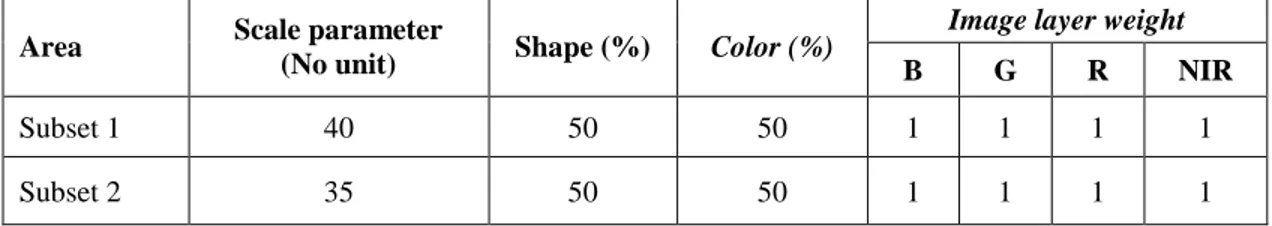
Figure 7 shows an example of the resulting image objects using only multiresolution segmentation [b] and with multiresolution segmentation and spectral difference segmentation together [c].
[a] [b] [c]
Figure 7. Image segmentation. a) orginal image. b) MRS. c) MRS plus SDS.
In this way, the resulting image objects are, thus, characterized not only by their spectral characteristics but also by their shape or texture features. The next step after image segmentation is image object classification, which is presented in the next subsection. 3.2.2. Image object classification
The object features provided in eCognition software supplies different attributes about the shape, spectral and textural values that are used as sources of information to define the parameters used to classify image objects (Sliuzas et al., 2008). This section deals with the two classification techniques used in this thesis. The first part explains the procedures used in the creation of the rule-set for the expert system classification. The second part details with the one class support vector machine classifications used in this thesis.
28
I. Rule-set development
The rule set development for the expert system classification is undertaken in eCognition version 9.1. eCognition provides different classification techniques and methods to train and build up a knowledge base for image object classification. The class hierarchy in eCognition is the frame of the knowledge base for the analysis and classification of image objects. It encompasses all classes of a classification scheme grouped either in a hierarchical manner or based on the given values of the image object. Within object-based analyses, spectral, textural, contextual and scale information can be integrated into the classification hierarchical rule-set. This information’s are expected to increase the quality of classifications (Conchedda et al., 2008). In this thesis, a rule set was developed independently for each of the two subset images to discriminate the slum settlements from the non-slums, based on twenty variables characterize each image object. These variables are categorized into three broad groups comprising spectral, texture, and geometry. Table 8 below explains the parameter used to classify the land cover classes in this thesis with their definition.
Parameters Definition
Spectral
Mean
The mean intensity of all pixels forming an image object in the blue, green, red, and NIR bands.
Ratio The amount that a given image layer contributes to the total brightness.
Texture
Standard deviation
The standard deviation is calculated from the image layer intensity values of all pixel forming an image objects.
Geometry
Area The number of pixels forming an image object. If unit information is
available, the number of pixels can be converted into a measurement. Rectangular
fit
The description of how well an image object fits into a rectangle of similar size and proportions. While 0 indicates no fit, 1 indicates for a complete fitting image object.
NDVI
An index developed to measure vegetation, defined as (NIR - Red) / (NIR + Red)
Table 8.The definition of parameters used in the classification of subset 1 and subset 2 (Definiens, 2015).
Since the classification in eCognition is recommended to be hierarchical, initially, the whole image is categorized into the following main landcover classes: [a] vegetation and green area, [b] Shadow [c] Road and open space, and [d] Buildings (Slum, and non-slum).
29
Thus, a membership threshold is implemented for the image objects to describe and classify different classes in the study areas.The vegetation and green area in both study area is classified by the external input of Normalized Difference Vegetation Indexes (NDVI). Table 9, and Table 10 represent the classes, feature objects and membership thresholds that are used during the extraction and classification procedure for subset 1 and subset 2, respectively. The decisions (thresholds) are derived from a series of tests across the study areas.
Area Class Object feature Threshold
Subset 1
Vegetation and Green areas NDVI > 0.2
Shadow Mean Green < 335
Non-slum Buildings Red channel Ratio 0.175 - 0.229
Slum Buildings Red channel Ratio 0.23 - 0.33
Area < 70 m2
Table 9. Classes, object feature and their threshold defined to extract and classify objects in subset 1.
The mean green value of the objects is used to classify the shadows in subset 1. In addition, to mean green value of objects, mean blue is also used to classify the shadow in subset 2. Because the dark slum buildings were also detected with the shadow area while using only mean green values as in subset 1.
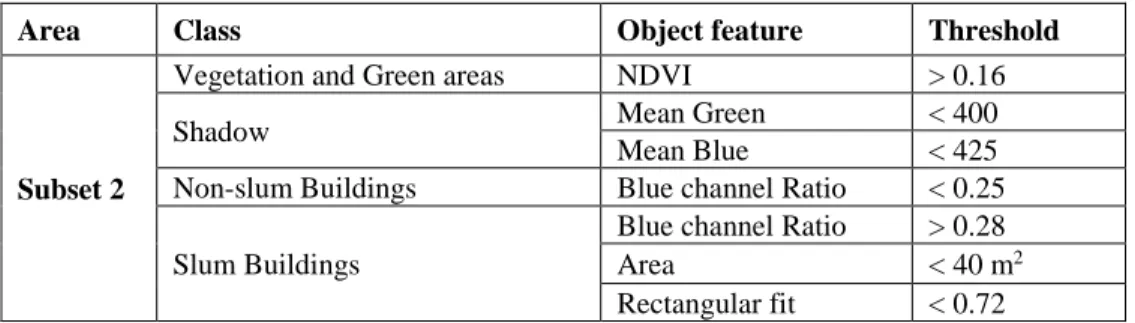
Area Class Object feature Threshold
Subset 2
Vegetation and Green areas NDVI > 0.16
Shadow Mean Green < 400
Mean Blue < 425
Non-slum Buildings Blue channel Ratio < 0.25
Slum Buildings
Blue channel Ratio > 0.28
Area < 40 m2
Rectangular fit < 0.72
Table 10. Classes, object feature and their threshold defined to extract and classify objects in subset 2.
The ratio of a given band is the amount that a given image layer contributes to the total brightness. The ratio of the bands is used in the subsequent building roof extraction process based on a machine-learning decision tree. The red channel ratio and area of the image objects are used to detect the slum areas in subset 1. Whereas, Blue channel ratio is used to extract the slum buildings in subset 2. Moreover, area and rectangular fit are also used as a criterion to identify the slum buildings in subset 2. In general, the rule set definition in each subset depends on the nature of the study area such as color, size, and shape of the buildings.
30
II. One-class SVM
One-class SVM is another technique of classification used in this thesis, to compare its performance of slum mapping with the expert system. Fine-tuning a one-class SVM is harder than to fine tune an SVM (Silva et al., 2017). The determination of the best values of the OCSVM algorithm parameters is done in two ways; manual fine-tuning, and automatic fine-tuning. The manual fine-tuning of the parameters is done using extensive manual trial in both study areas. The automatic tuning is done using cross-validation grid search.
Table 11 presents the parameterization of one-class support vector machine with automatic fine-tuning, and one-class support vector machine with manual fine-tuning in subset 1 and subset 2.
Study area Method Gamma nu
Subset 1 One-class SVM (automatic fine-tuning) 0.000488 0.1
One-class SVM (manual fine-tuning) 0.08 0.05
Subset 2 One-class SVM (automatic fine-tuning) 0.000122 0.12
One-class SVM (manual fine-tuning) 1.6 0.09
Table 11. Parameterization of one-class SVM with automatic and manual fine-tuning in subset 1 and subset 2.
The radial basis function was chosen as the kernel and it was used in all the tested approaches. The free-parameters gamma and nu of the radial basis function were determined using a ten-fold cross-validation grid-search with overall accuracy as the performance metric. In this way, the fine-tuning process is effectively searching for the parameterization with the highest overall accuracy regardless of the classes.
3.3. Classification accuracy assessment
In thematic mapping from remotely sensed data, the term accuracy is used typically to express the degree of correctness of a map or classification (Foody, 2002). A thematic map derived from a classification may be considered accurate if it provides an unbiased representation of the land cover of the region it portrays. Therefore, classification accuracy is typically taken to mean the degree to which the derived image classification agrees with reality or conforms to the truth. A classification error is, thus, some discrepancy between the situation depicted on the thematic map and reality (Foody, 2002).
31
The most common approach to assess the accuracy of remotely sensed data uses an error matrix and is referred to as confusion matrix. A confusion matrix is a square array of numbers set out in rows and columns, which expresses the relationship between the samples in the reference and the classified image (Table 4).
Using error matrix to represent accuracy is recommended and adopted as the standard reporting convention. For this purpose, 1000 samples points were selected for each subset using a random points generator tool. The samples were then labeled into their respective classes and a confusion matrix was designed. In addition, one hundred sample slum image objects were also collected from each subset to be used as training for the single-class learner. Since the output classification of this research is binary one overall accuracy, sensitivity and specificity are deployed as a quality matrix (Xanthopoulos and Razzaghi 2014). The next chapter of this thesis is focused on the result and discussion part, where the performance of each classifier to discriminate slums in Addis Ababa city is assessed.


![Figure 7 shows an example of the resulting image objects using only multiresolution segmentation [b] and with multiresolution segmentation and spectral difference segmentation together [c]](https://thumb-eu.123doks.com/thumbv2/123dok_br/15763941.1075145/37.918.154.794.500.700/resulting-multiresolution-segmentation-multiresolution-segmentation-spectral-difference-segmentation.webp)